Deck 13: Appendix: Managerial Analysis of Financial Statements
Full screen (f)
Question
Question
Question
Question
Question
Question
Question
Question
Question
Question
Question
Question
Question
Question
Question
Question
Question
Question
Question
Question
Question
Question
Question
Question
Question
Question
Question
Question
Question
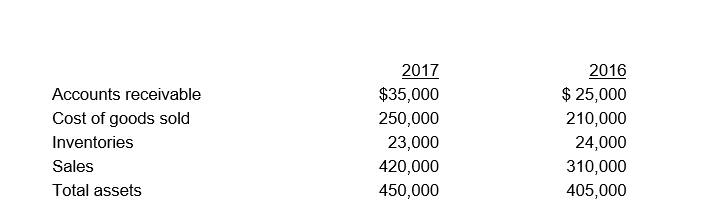
-Which of the following would result from a horizontal analysis of Robbins Corporation's balance sheet?
A) Inventories are 5.11% of total assets for 2017.
B) Accounts receivable increased $10,000 or 40.0% during 2017 .
C) Accounts receivable is 7.78% of total assets for 2017.
D) Accounts receivable is 4.0 times larger than inventories in 2017.
Question
-Which of the following would result from a vertical analysis of Robbins Corporation's balance sheet?
A) Accounts receivable increased $10,000 or 40.0% during 2017.
B) Inventories decreased $1,000 or 4.17% during 2017.
C) Cost of goods sold increased $40,000 or 19.05% during 2017.
D) Inventories are 5.11% of total assets for 2017
Question
-Which of the following would result from a horizontal analysis of Robbins Corporation's income statement?
A) Cost of goods sold increased $40,000 or 19.05% during 2017
B) Accounts receivable is 7.78% of total assets for 2017.
C) Gross margin is 40.48% of net sales for 2017.
D) Cost of goods sold is 59.52% of net sales for 2017.
Question
-Which of the following would result from a vertical analysis of Robbins Corporation's income statement?
A) Gross margin is 40.48 % of net sales for 2017.
B) Net sales increased $110,000 or 35.48% during 2017.
C) Accounts receivable increased $10,000 or 40.00% during 2017.
D) Cost of goods sold increased $40,000 or 19.05% during 2017.
Question
-Which of the following results would be found through a vertical analysis of the balance sheet or the income statement of Robbins Corporation?
A) Accounts receivable increased $10,000 or 40.00% during 2017.
B) Total assets increased $45,000 during 2017.
C) Cost of goods sold is 59.52% of net sales for 2017.
D) Cost of goods sold increased 19.05% during 2017.
Question
Question
Question
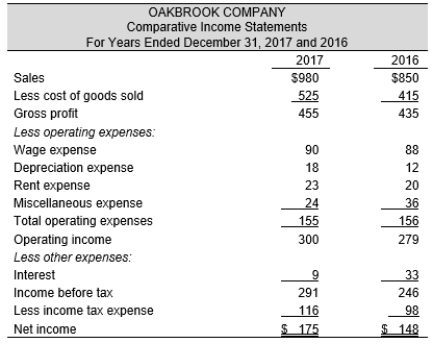
-In the judgment of the credit analysts of Oakbrook Company, what issue would be of most concern or source of optimism?
A) Income taxes increased 18.3 percent.
B) There was a 10.0 percent increase in income before taxes.
C) There was a 26.5 percent increase in cost of goods sold with only an 15.3 percent increase in sales.
D) Miscellaneous expense decreased 33.3 percent.
Question
-Using common-size analysis, what percentage would be attributable to the 2017 wage expense of Oakbrook Company?
A) 10.2 percent
B) 9.2 percent
C) 5.2 percent
D) 33.2 percent
Question
-Using common-size analysis, what percentage would be attributable to the 2017 income tax expense of Oakbrook Company?
A) 5.1 percent
B) 11.8 percent
C) 5.4 percent
D) 20.3 percent
Question
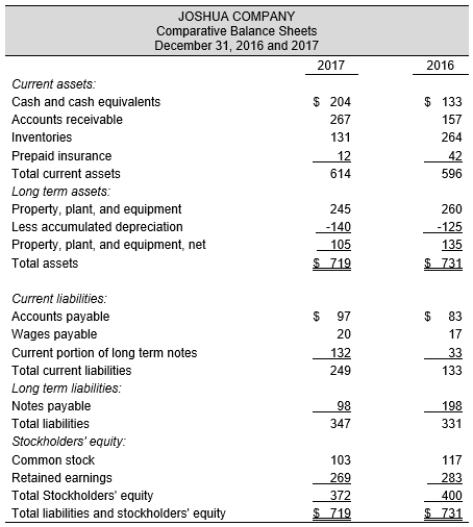
-Using common-size analysis, what percentage would be attributable to the 2017 accounts receivable of Joshua Company?
A) 14.5 percent
B) 13.5 percent
C) 35.4 percent
D) 37.1 percent
Question
-Using common-size analysis, what percentage would be attributable to the 2016 inventories of Joshua Company?
A) 34.5 percent
B) 36.1 percent
C) 31.3 percent
D) 21.5 percent
Question
-Using common-size analysis, what percentage would be attributable to the 2016 accumulated depreciation of Joshua Company?
A) (17.1) percent
B) 20.3 percent
C) 22.5 percent
D) (20.3) percent
Question
-Using common-size analysis, what percentage would be attributable to the 2017 wages payable of Joshua Company?
A) 2.8 percent
B) 3.1 percent
C) 3.8 percent
D) 17.2 percent
Question
-In the judgment of the credit analysts of Joshua Company, what issue would be of most concern or source of optimism?
A) Both common stock and retained income decreased by the same dollar amount.
B) The current portion of long-term notes payable increased by 300 percent.
C) Cash and accounts receivable increased 53.4 percent and 70.1 percent, respectively.
D) Fixed assets decreased 22.2 percent.
Question
Question
Question
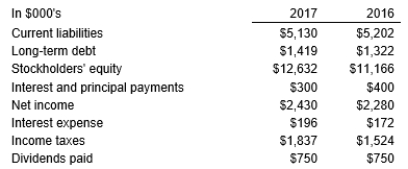
-Kamal Company's debt-to-equity ratio for 2017 is:
A) An indicator that Kamal Company's ability to meet current interest payments to creditors is increasing.
B) Increasing slightly from 2016 to 2017
C) An indicator that for every $1 of capital that stockholders provided, creditors provided nearly $0.52 in 2017
D) An indicator that Kamal Company has relied on stockholders for funds more in 2017 than in 2018
Question
-Kamal Company's times interest earned ratio for 2017:
A) Decreased slightly, which indicates the company has about the same ability to pay interest on its debt.
B) Indicates the company cannot meet its current year interest payments out of current year earnings.
C) Increased, which indicates the company's creditors will be pleased.
D) Shows an increase in the company's ability to make its interest payments.
Question
-Kamal Company's debt-to-equity ratio was 0.52 to 1 in 2017 and 0.58 to 1 in 2016. Which of the following statements is true concerning Kamal ?
A) The company has a smaller percentage of capital from owners at the end of 2017 than at the end of 2016.
B) The company is improving its debt-to-equity ratio.
C) The company relied more on creditors for capital during 2017 than in 2016.
D) The company appears to be in a weaker position at the end of 2017 to finance capital expenditures from cash flow generated by operating activities.
Question
Question
Below are selected data from the financial statements of Pepper Company for 2016 and 2017.
 The debt-to-equity ratio for 2017 is:
A) $1.337 to $1 which should be a cause of concern for Pepper Company managers.
B) $1.337 to $1 which should be a cause of concern for stockholders
C) Increasing, which should be a negative sign for credit analysts
D) All of the above.
The debt-to-equity ratio for 2017 is:A) $1.337 to $1 which should be a cause of concern for Pepper Company managers.
B) $1.337 to $1 which should be a cause of concern for stockholders
C) Increasing, which should be a negative sign for credit analysts
D) All of the above.
Question
Question
Question
Question
Question
Question
Question
Question
Question
Question
Question
Question
Question
Question
Question
Question
Question
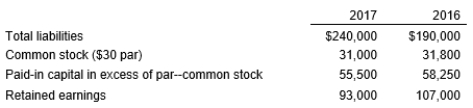
Presented below are selected data from the financial statements of Hamilton Corp. for 2017 and 2016.
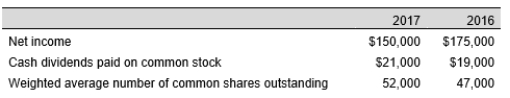 Earnings per share (EPS) is reported on the 2017 income statement as:
A) $1.80
B) $2.10
C) $2.88
D) $2.90
Earnings per share (EPS) is reported on the 2017 income statement as:A) $1.80
B) $2.10
C) $2.88
D) $2.90
Question
Presented below are selected data from the financial statements of Hamilton Corp. for 2017 and 2016.
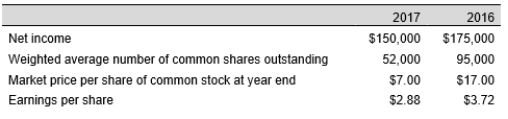 The price/earnings ratio for 2017 is:
A) 0.30 to 1
B) 5.20 to 1
C) 2.43 to 1
D) 0.10 to 1
The price/earnings ratio for 2017 is:A) 0.30 to 1
B) 5.20 to 1
C) 2.43 to 1
D) 0.10 to 1
Question
Question
Question
Question
Question
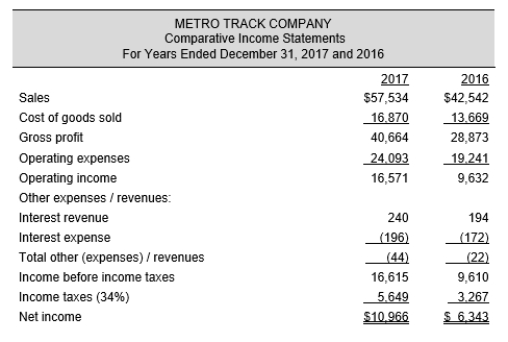
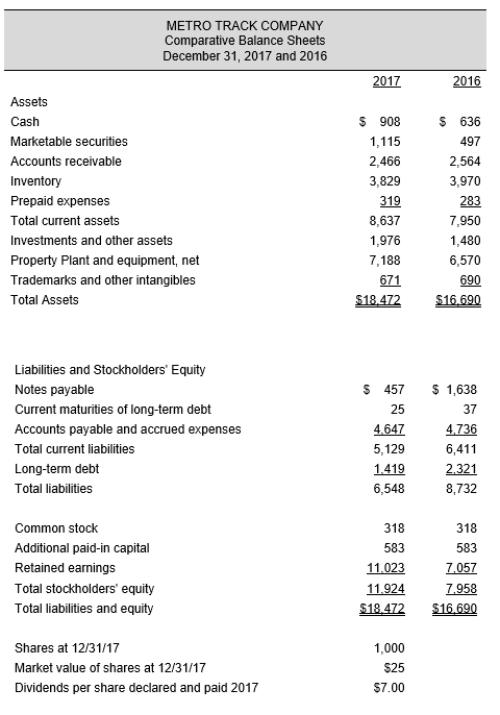
-The gross margin percentage for 2017 is:
A) 29.3 percent
B) 65.4 percent
C) 70.7 percent
D) 43.8 percent
Question
-The debt-to-equity ratio for 2017 is:
A) 54.9 percent
B) 48.2 percent
C) 45.1 percent
D) 61.9 percent
Question
-The return-on-sales ratio for 2017 is:
A) 5.0 percent
B) 19.3 percent
C) 5.3 percent
D) 9.5 percent
Question
-The earnings per share for 2017 is:
A) $60.07
B) $ 1.57
C) $ 7.16
D) $10.97
Question
-The price-earnings ratio for 2017 is:
A) 11.93 times
B) 12.13 times
C) 2.28 times
D) 4.68 times
Question
-The dividend yield ratio for 2017 is:
A) 28.00 percent
B) 13.00 percent
C) 5.87 percent
D) 5.00 percent
Question
-The dividend payout ratio for 2017 is:
A) 9.10 percent
B) 30.60 percent
C) 63.81 percent
D) 100.00 percent
Question
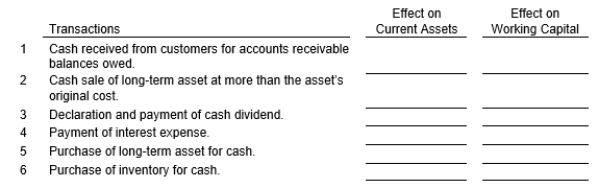
Show the effect of each of the transactions below on total assets and working capital by using one of the following symbols in each box to complete the table.

Unlock Deck
Sign up to unlock the cards in this deck!
Unlock Deck
Unlock Deck
1/91
Play
Full screen (f)
Deck 13: Appendix: Managerial Analysis of Financial Statements
1
Financial statement analysis is the process of interpreting and evaluating financial statements by using data and disclosures contained in them to produce additional financial measures.
True
2
Financial statement analysis involves comparing financial statements for the current period with those of previous periods and/or other companies, assessing the internal composition of the financial statements, and measuring relations within and among the financial statements.
True
3
Financial statement analysis enables managers to see their firm as outsiders see it, to ascertain compliance with credit restrictions, to compare their firm with similar firms, and to identify potential strengths and weaknesses.
True
4
Because it relates elements from the income statement and balance sheet, the asset turnover ratio is ideal as a single financial indicator.
Unlock Deck
Unlock for access to all 91 flashcards in this deck.
Unlock Deck
k this deck
5
Alternative accounting procedures such as methods of depreciation and inventory cost flow methods affect both the income statement and the balance sheet.
Unlock Deck
Unlock for access to all 91 flashcards in this deck.
Unlock Deck
k this deck
6
Inflation or deflation does not affect comparisons of financial statements between periods because the statements are based on historical dollars.
Unlock Deck
Unlock for access to all 91 flashcards in this deck.
Unlock Deck
k this deck
7
Because the income statement shows aggregated amounts such as sales, gross profit, and net income, a change in product mix can distort ratios and comparisons of financial statements.
Unlock Deck
Unlock for access to all 91 flashcards in this deck.
Unlock Deck
k this deck
8
In vertical common size analysis, the dollar figure for an account is expressed in terms of that same account figure for a previous year.
Unlock Deck
Unlock for access to all 91 flashcards in this deck.
Unlock Deck
k this deck
9
In order to determine the meaning of common size percentages, some kind of comparison, such as an industry average, trend analysis, or a firm's own history, is helpful.
Unlock Deck
Unlock for access to all 91 flashcards in this deck.
Unlock Deck
k this deck
10
Vertical and horizontal analyses are limited in that they involve comparisons of financial measures only for a single firm.
Unlock Deck
Unlock for access to all 91 flashcards in this deck.
Unlock Deck
k this deck
11
Vertical analysis helps to identify significant changes that have taken place during the period and to determine whether the changes have favorable or unfavorable impacts on solvency and performance.
Unlock Deck
Unlock for access to all 91 flashcards in this deck.
Unlock Deck
k this deck
12
Horizontal analysis is used to evaluate trends in the financial condition of an organization.
Unlock Deck
Unlock for access to all 91 flashcards in this deck.
Unlock Deck
k this deck
13
Solvency refers to a firm's ability to pay its debts as they come due.
Unlock Deck
Unlock for access to all 91 flashcards in this deck.
Unlock Deck
k this deck
14
Primary measures of short term solvency are the debt-to-equity ratio and the times-interest-earned measure.
Unlock Deck
Unlock for access to all 91 flashcards in this deck.
Unlock Deck
k this deck
15
Ratios useful in assessing long term solvency are the current ratio, acid test ratio, inventory turnover, and days sales in receivables.
Unlock Deck
Unlock for access to all 91 flashcards in this deck.
Unlock Deck
k this deck
16
Primary measures of performance are asset turnover, return on assets, return on equity, and earnings per share.
Unlock Deck
Unlock for access to all 91 flashcards in this deck.
Unlock Deck
k this deck
17
If the fixed cost of capital is greater than the return on assets, financial leverage is favorable.
Unlock Deck
Unlock for access to all 91 flashcards in this deck.
Unlock Deck
k this deck
18
Financial statement analysis is least useful for:
A) Providing creditors with information on the status of their loans
B) Providing investors with useful information for valuing securities
C) Providing managers with relevant information to help achieve organizational goals
D) Providing the Internal Revenue Service with information to determine the amount of taxes owed
Unlock Deck
Unlock for access to all 91 flashcards in this deck.
Unlock Deck
k this deck
19
Which of the following would be users of financial statement analysis?
A) Management
B) Bankers
C) Investment analysts
D) All of the above
A) Management
B) Bankers
C) Investment analysts
D) All of the above
Unlock Deck
Unlock for access to all 91 flashcards in this deck.
Unlock Deck
k this deck
20
With respect to credit analysts and managers, which of the following statements is incorrect?
A) Both credit analysts and managers are concerned about security prices.
B) Credit analysts are concerned with assessing the short-term liquidity of a company.
C) Credit analysts are concerned with assessing the long-term solvency of a company.
D) Managers are concerned about interest, principal, and dividend payments.
Unlock Deck
Unlock for access to all 91 flashcards in this deck.
Unlock Deck
k this deck
21
Which of the following statements describe the principal reasons why stockholders and credit analysts use financial statement analysis?
1) To assess the risks associated with payments on debt and return on investment
2) To predict the amount of expected returns
3) To establish recommended dividend and interest payments
4) To evaluate top and middle level management
A) 1 and 2
B) 1 and 4
C) 3 and 4
D) 1, 2, and 3
1) To assess the risks associated with payments on debt and return on investment
2) To predict the amount of expected returns
3) To establish recommended dividend and interest payments
4) To evaluate top and middle level management
A) 1 and 2
B) 1 and 4
C) 3 and 4
D) 1, 2, and 3
Unlock Deck
Unlock for access to all 91 flashcards in this deck.
Unlock Deck
k this deck
22
Factors that influence the financial statements and evaluation methods include:
A) Inadequacy of a single financial analysis measure
B) Alternative accounting methods and procedures
C) Inflation or deflation
D) All of the above
A) Inadequacy of a single financial analysis measure
B) Alternative accounting methods and procedures
C) Inflation or deflation
D) All of the above
Unlock Deck
Unlock for access to all 91 flashcards in this deck.
Unlock Deck
k this deck
23
Factors that influence the financial statements and evaluation methods include:
A) Changes in the product mix
B) Changes in organization structure
C) All of the above
D) None of the above
A) Changes in the product mix
B) Changes in organization structure
C) All of the above
D) None of the above
Unlock Deck
Unlock for access to all 91 flashcards in this deck.
Unlock Deck
k this deck
24
Competitor Analysis is comparison of a firm's financial measures to:
A) Those of previous periods
B) Similar measures for other firms in the industry or to industry averages
C) Industry forecasts and economic outlooks
D) Its budgeted measures
A) Those of previous periods
B) Similar measures for other firms in the industry or to industry averages
C) Industry forecasts and economic outlooks
D) Its budgeted measures
Unlock Deck
Unlock for access to all 91 flashcards in this deck.
Unlock Deck
k this deck
25
The dollar change and percentage change in the accounts payable account from 2016 to 2017 is calculated for Barker Enterprises. This is an example of:
A) Horizontal analysis
B) Vertical analysis
C) Performance analysis
D) Solvency analysis
A) Horizontal analysis
B) Vertical analysis
C) Performance analysis
D) Solvency analysis
Unlock Deck
Unlock for access to all 91 flashcards in this deck.
Unlock Deck
k this deck
26
Which of the following statements is false regarding vertical analysis?
A) Common-size financial statements cannot be used to compare businesses of different sizes.
B) Vertical analysis can only be used with balance sheet accounts.
C) Vertical analysis can only be used with income statement accounts.
D) All of these are false.
A) Common-size financial statements cannot be used to compare businesses of different sizes.
B) Vertical analysis can only be used with balance sheet accounts.
C) Vertical analysis can only be used with income statement accounts.
D) All of these are false.
Unlock Deck
Unlock for access to all 91 flashcards in this deck.
Unlock Deck
k this deck
27
In vertical analysis of the income statement, the base amount is most commonly:
A) Gross profit
B) Net income
C) Sales
D) Cost of goods sold
A) Gross profit
B) Net income
C) Sales
D) Cost of goods sold
Unlock Deck
Unlock for access to all 91 flashcards in this deck.
Unlock Deck
k this deck
28
Horizontal analysis is analysis:
A) Or comparison of a firm's current financial measures to those of previous periods
B) In which all items are presented as a percentage of a base item on the same financial statement
C) In which a statistic is calculated for the relationship between two items on a single financial statement or for two items on different financial statements
D) Of all ratios that increased or decreased over past accounting periods
Unlock Deck
Unlock for access to all 91 flashcards in this deck.
Unlock Deck
k this deck
29
-Which of the following would result from a horizontal analysis of Robbins Corporation's balance sheet?
A) Inventories are 5.11% of total assets for 2017.
B) Accounts receivable increased $10,000 or 40.0% during 2017 .
C) Accounts receivable is 7.78% of total assets for 2017.
D) Accounts receivable is 4.0 times larger than inventories in 2017.
Unlock Deck
Unlock for access to all 91 flashcards in this deck.
Unlock Deck
k this deck
30
-Which of the following would result from a vertical analysis of Robbins Corporation's balance sheet?
A) Accounts receivable increased $10,000 or 40.0% during 2017.
B) Inventories decreased $1,000 or 4.17% during 2017.
C) Cost of goods sold increased $40,000 or 19.05% during 2017.
D) Inventories are 5.11% of total assets for 2017
Unlock Deck
Unlock for access to all 91 flashcards in this deck.
Unlock Deck
k this deck
31
-Which of the following would result from a horizontal analysis of Robbins Corporation's income statement?
A) Cost of goods sold increased $40,000 or 19.05% during 2017
B) Accounts receivable is 7.78% of total assets for 2017.
C) Gross margin is 40.48% of net sales for 2017.
D) Cost of goods sold is 59.52% of net sales for 2017.
Unlock Deck
Unlock for access to all 91 flashcards in this deck.
Unlock Deck
k this deck
32
-Which of the following would result from a vertical analysis of Robbins Corporation's income statement?
A) Gross margin is 40.48 % of net sales for 2017.
B) Net sales increased $110,000 or 35.48% during 2017.
C) Accounts receivable increased $10,000 or 40.00% during 2017.
D) Cost of goods sold increased $40,000 or 19.05% during 2017.
Unlock Deck
Unlock for access to all 91 flashcards in this deck.
Unlock Deck
k this deck
33
-Which of the following results would be found through a vertical analysis of the balance sheet or the income statement of Robbins Corporation?
A) Accounts receivable increased $10,000 or 40.00% during 2017.
B) Total assets increased $45,000 during 2017.
C) Cost of goods sold is 59.52% of net sales for 2017.
D) Cost of goods sold increased 19.05% during 2017.
Unlock Deck
Unlock for access to all 91 flashcards in this deck.
Unlock Deck
k this deck
34
Financial Statement Analysis is analysis:
A) Of dollar changes and percentage changes in financial measures over several years
B) In which all items are presented as a percentage of one base item on a financial statement
C) In which a statistic is calculated for the relationship between two measures on a single financial statement or for two measures on different financial statements
D) All of the above are elements of financial statement analysis
Unlock Deck
Unlock for access to all 91 flashcards in this deck.
Unlock Deck
k this deck
35
Glamor Industries' cost of goods sold percentage increased from 33.9% in 2016 to 47.7% in 2017. What is the trend in this change?
A) An upward, favorable trend
B) An upward, unfavorable trend
C) It depends on whether gross margin increased or decreased during the period
D) Trends cannot be determined without the dollar amount of the increases provided
A) An upward, favorable trend
B) An upward, unfavorable trend
C) It depends on whether gross margin increased or decreased during the period
D) Trends cannot be determined without the dollar amount of the increases provided
Unlock Deck
Unlock for access to all 91 flashcards in this deck.
Unlock Deck
k this deck
36
-In the judgment of the credit analysts of Oakbrook Company, what issue would be of most concern or source of optimism?
A) Income taxes increased 18.3 percent.
B) There was a 10.0 percent increase in income before taxes.
C) There was a 26.5 percent increase in cost of goods sold with only an 15.3 percent increase in sales.
D) Miscellaneous expense decreased 33.3 percent.
Unlock Deck
Unlock for access to all 91 flashcards in this deck.
Unlock Deck
k this deck
37
-Using common-size analysis, what percentage would be attributable to the 2017 wage expense of Oakbrook Company?
A) 10.2 percent
B) 9.2 percent
C) 5.2 percent
D) 33.2 percent
Unlock Deck
Unlock for access to all 91 flashcards in this deck.
Unlock Deck
k this deck
38
-Using common-size analysis, what percentage would be attributable to the 2017 income tax expense of Oakbrook Company?
A) 5.1 percent
B) 11.8 percent
C) 5.4 percent
D) 20.3 percent
Unlock Deck
Unlock for access to all 91 flashcards in this deck.
Unlock Deck
k this deck
39
-Using common-size analysis, what percentage would be attributable to the 2017 accounts receivable of Joshua Company?
A) 14.5 percent
B) 13.5 percent
C) 35.4 percent
D) 37.1 percent
Unlock Deck
Unlock for access to all 91 flashcards in this deck.
Unlock Deck
k this deck
40
-Using common-size analysis, what percentage would be attributable to the 2016 inventories of Joshua Company?
A) 34.5 percent
B) 36.1 percent
C) 31.3 percent
D) 21.5 percent
Unlock Deck
Unlock for access to all 91 flashcards in this deck.
Unlock Deck
k this deck
41
-Using common-size analysis, what percentage would be attributable to the 2016 accumulated depreciation of Joshua Company?
A) (17.1) percent
B) 20.3 percent
C) 22.5 percent
D) (20.3) percent
Unlock Deck
Unlock for access to all 91 flashcards in this deck.
Unlock Deck
k this deck
42
-Using common-size analysis, what percentage would be attributable to the 2017 wages payable of Joshua Company?
A) 2.8 percent
B) 3.1 percent
C) 3.8 percent
D) 17.2 percent
Unlock Deck
Unlock for access to all 91 flashcards in this deck.
Unlock Deck
k this deck
43
-In the judgment of the credit analysts of Joshua Company, what issue would be of most concern or source of optimism?
A) Both common stock and retained income decreased by the same dollar amount.
B) The current portion of long-term notes payable increased by 300 percent.
C) Cash and accounts receivable increased 53.4 percent and 70.1 percent, respectively.
D) Fixed assets decreased 22.2 percent.
Unlock Deck
Unlock for access to all 91 flashcards in this deck.
Unlock Deck
k this deck
44
Which of the following is considered a solvency analysis measure?
A) Return on assets ratio
B) Dividend yield ratio
C) Acid-test ratio
D) Gross margin ratio
A) Return on assets ratio
B) Dividend yield ratio
C) Acid-test ratio
D) Gross margin ratio
Unlock Deck
Unlock for access to all 91 flashcards in this deck.
Unlock Deck
k this deck
45
Which of the following is an efficiency measure of solvency?
A) Working capital
B) Current ratio
C) Days sales in receivables ratio
D) Inventory turnover ratio
A) Working capital
B) Current ratio
C) Days sales in receivables ratio
D) Inventory turnover ratio
Unlock Deck
Unlock for access to all 91 flashcards in this deck.
Unlock Deck
k this deck
46
-Kamal Company's debt-to-equity ratio for 2017 is:
A) An indicator that Kamal Company's ability to meet current interest payments to creditors is increasing.
B) Increasing slightly from 2016 to 2017
C) An indicator that for every $1 of capital that stockholders provided, creditors provided nearly $0.52 in 2017
D) An indicator that Kamal Company has relied on stockholders for funds more in 2017 than in 2018
Unlock Deck
Unlock for access to all 91 flashcards in this deck.
Unlock Deck
k this deck
47
-Kamal Company's times interest earned ratio for 2017:
A) Decreased slightly, which indicates the company has about the same ability to pay interest on its debt.
B) Indicates the company cannot meet its current year interest payments out of current year earnings.
C) Increased, which indicates the company's creditors will be pleased.
D) Shows an increase in the company's ability to make its interest payments.
Unlock Deck
Unlock for access to all 91 flashcards in this deck.
Unlock Deck
k this deck
48
-Kamal Company's debt-to-equity ratio was 0.52 to 1 in 2017 and 0.58 to 1 in 2016. Which of the following statements is true concerning Kamal ?
A) The company has a smaller percentage of capital from owners at the end of 2017 than at the end of 2016.
B) The company is improving its debt-to-equity ratio.
C) The company relied more on creditors for capital during 2017 than in 2016.
D) The company appears to be in a weaker position at the end of 2017 to finance capital expenditures from cash flow generated by operating activities.
Unlock Deck
Unlock for access to all 91 flashcards in this deck.
Unlock Deck
k this deck
49
Which of the following is used to analyze a company's solvency?
A) Return on assets ratio
B) Days sales in receivables
C) Earnings per share
D) Asset turnover ratio
A) Return on assets ratio
B) Days sales in receivables
C) Earnings per share
D) Asset turnover ratio
Unlock Deck
Unlock for access to all 91 flashcards in this deck.
Unlock Deck
k this deck
50
Below are selected data from the financial statements of Pepper Company for 2016 and 2017.
The debt-to-equity ratio for 2017 is:
A) $1.337 to $1 which should be a cause of concern for Pepper Company managers.
B) $1.337 to $1 which should be a cause of concern for stockholders
C) Increasing, which should be a negative sign for credit analysts
D) All of the above.
The debt-to-equity ratio for 2017 is:A) $1.337 to $1 which should be a cause of concern for Pepper Company managers.
B) $1.337 to $1 which should be a cause of concern for stockholders
C) Increasing, which should be a negative sign for credit analysts
D) All of the above.
Unlock Deck
Unlock for access to all 91 flashcards in this deck.
Unlock Deck
k this deck
51
Which of the following generally indicates a positive change?
A) The number of days' sales in receivables decreases.
B) Earnings per share decreases.
C) The current ratio decreases.
D) The times-interest-earned ratio decreases.
A) The number of days' sales in receivables decreases.
B) Earnings per share decreases.
C) The current ratio decreases.
D) The times-interest-earned ratio decreases.
Unlock Deck
Unlock for access to all 91 flashcards in this deck.
Unlock Deck
k this deck
52
Oakridge Hobby Shop's inventory turned over six times during the year. Similar shops have an inventory turnover equal to twelve times per year.
What explains Oakridge's state of inventory management?
A) Oakridge sold too much inventory during the year.
B) Oakridge is performing twice as well as its competitors.
C) Oakridge needs to increase sales and decrease the amount of goods on hand.
D) Oakridge should increase the amount of goods on hand to accommodate the additional inventory demand.
Unlock Deck
Unlock for access to all 91 flashcards in this deck.
Unlock Deck
k this deck
53
By-George Products is considered "very liquid" or highly solvent for the year ended December 31, 2017. This means that By-George
A) Is able to pay its current debts using its current assets as they convert to cash
B) Must decrease its solvency in order to appear favorable to stockholders
C) Should sell plant assets in order to remain in business
D) Has a small current ratio
A) Is able to pay its current debts using its current assets as they convert to cash
B) Must decrease its solvency in order to appear favorable to stockholders
C) Should sell plant assets in order to remain in business
D) Has a small current ratio
Unlock Deck
Unlock for access to all 91 flashcards in this deck.
Unlock Deck
k this deck
54
The current ratio and acid-test ratio differ in:
A) the composition of assets in the ratio denominators.
B) the composition of liabilities in the ratio denominators.
C) that the acid test is more specifc than the current ratio as a test for solvency.
D) the usefulness as a performance measure.
A) the composition of assets in the ratio denominators.
B) the composition of liabilities in the ratio denominators.
C) that the acid test is more specifc than the current ratio as a test for solvency.
D) the usefulness as a performance measure.
Unlock Deck
Unlock for access to all 91 flashcards in this deck.
Unlock Deck
k this deck
55
The primary difference between the debt to equity ratio and the times interest earned ratio is:
A) The debt to equity ratio uses elements from the balance sheet; the times interest earned ratio uses elements from the income statement.
B) The debt to equity ratio is a long-term solvency measure; the times interest earned ratio is a short term solvency ratio.
C) The debt to equity ratio is a long-term solvency measure; the times interest earned ratio is a performance ratio.
D) The debt to equity ratio can be compared to industry averages; the times interest earned ratio varies too widely from firm to firm to permit comparisons to the industry.
Unlock Deck
Unlock for access to all 91 flashcards in this deck.
Unlock Deck
k this deck
56
Mamantor Company had a debt to equity ratio of 0.600. The company received a loan. The effect of the transaction is:
A) The ratio decreased.
B) The ratio remained the same.
C) The ratio increased.
D) There is insufficient information to predict the effect.
A) The ratio decreased.
B) The ratio remained the same.
C) The ratio increased.
D) There is insufficient information to predict the effect.
Unlock Deck
Unlock for access to all 91 flashcards in this deck.
Unlock Deck
k this deck
57
Consignment Shipments, Inc. had a times interest earned ratio of 11 to 1 in 2016. In 2017 the company incurred a substantial increase in interest expense with no overall effect on net income or taxes. The effect of the transaction is:
A) The ratio increased.
B) The ratio remained the same.
C) The ratio decreased.
D) There is insufficient information to predict the effect.
A) The ratio increased.
B) The ratio remained the same.
C) The ratio decreased.
D) There is insufficient information to predict the effect.
Unlock Deck
Unlock for access to all 91 flashcards in this deck.
Unlock Deck
k this deck
58
Which of the following is false regarding the current ratio compared to the acid test ratio?
A) The current ratio is less strict and more general.
B) The acid test ratio measures the firm's ability to pay its debts over a shorter period of time.
C) Both ratios use asset accounts, but the acid test ratio does not use inventories.
D) Both ratios exclude prepaid expenses in the numerator.
A) The current ratio is less strict and more general.
B) The acid test ratio measures the firm's ability to pay its debts over a shorter period of time.
C) Both ratios use asset accounts, but the acid test ratio does not use inventories.
D) Both ratios exclude prepaid expenses in the numerator.
Unlock Deck
Unlock for access to all 91 flashcards in this deck.
Unlock Deck
k this deck
59
Which of the following will increase working capital?
A) Purchasing inventory on credit
B) Payment of accounts payable
C) Cash sales
D) Purchasing office furniture with cash
A) Purchasing inventory on credit
B) Payment of accounts payable
C) Cash sales
D) Purchasing office furniture with cash
Unlock Deck
Unlock for access to all 91 flashcards in this deck.
Unlock Deck
k this deck
60
The basic activities conducted by a typical for-profit organization are:
A) Generating capital from equity and debt
B) Using assets to generate sales and profits
C) Using profits to pay the cost of capital
D) All of these responses are basic activities of a typical for-profit organization.
A) Generating capital from equity and debt
B) Using assets to generate sales and profits
C) Using profits to pay the cost of capital
D) All of these responses are basic activities of a typical for-profit organization.
Unlock Deck
Unlock for access to all 91 flashcards in this deck.
Unlock Deck
k this deck
61
Which of the following is not a basic performance activity conducted by a typical for-profit organization?
A) Generating capital from equity and debt
B) Using assets to generate sales and profits
C) Using profits to pay expenses such as wages, salaries, and bonuses
D) Using profits to pay the cost of capital
A) Generating capital from equity and debt
B) Using assets to generate sales and profits
C) Using profits to pay expenses such as wages, salaries, and bonuses
D) Using profits to pay the cost of capital
Unlock Deck
Unlock for access to all 91 flashcards in this deck.
Unlock Deck
k this deck
62
A solvency measure used also to assist in performance evaluation is:
A) Return on equity
B) Return on sales
C) Inventory turnover
D) Return on assets
A) Return on equity
B) Return on sales
C) Inventory turnover
D) Return on assets
Unlock Deck
Unlock for access to all 91 flashcards in this deck.
Unlock Deck
k this deck
63
A solvency measure used also to assist in performance evaluation is:
A) Days sales in receivables
B) Return on equity
C) Financial leverage
D) Return on assets
A) Days sales in receivables
B) Return on equity
C) Financial leverage
D) Return on assets
Unlock Deck
Unlock for access to all 91 flashcards in this deck.
Unlock Deck
k this deck
64
Primary measures of performance do not include:
A) Current ratio
B) Return on equity
C) Asset turnover
D) Return on assets
A) Current ratio
B) Return on equity
C) Asset turnover
D) Return on assets
Unlock Deck
Unlock for access to all 91 flashcards in this deck.
Unlock Deck
k this deck
65
Primary measures of performance include:
A) Earnings per share
B) Return on equity
C) Asset turnover
D) All of these responses are primary measures of performance.
A) Earnings per share
B) Return on equity
C) Asset turnover
D) All of these responses are primary measures of performance.
Unlock Deck
Unlock for access to all 91 flashcards in this deck.
Unlock Deck
k this deck
66
A firm's performance evaluation does not reflect on its
A) Ability to generate capital
B) Use of assets to generate sales and profits
C) Use of profits to pay the cost of capital
D) Ability to pay near term debts
A) Ability to generate capital
B) Use of assets to generate sales and profits
C) Use of profits to pay the cost of capital
D) Ability to pay near term debts
Unlock Deck
Unlock for access to all 91 flashcards in this deck.
Unlock Deck
k this deck
67
Presented below are selected data from the financial statements of Hamilton Corp. for 2017 and 2016.
Earnings per share (EPS) is reported on the 2017 income statement as:
A) $1.80
B) $2.10
C) $2.88
D) $2.90
Earnings per share (EPS) is reported on the 2017 income statement as:A) $1.80
B) $2.10
C) $2.88
D) $2.90
Unlock Deck
Unlock for access to all 91 flashcards in this deck.
Unlock Deck
k this deck
68
Presented below are selected data from the financial statements of Hamilton Corp. for 2017 and 2016.
The price/earnings ratio for 2017 is:
A) 0.30 to 1
B) 5.20 to 1
C) 2.43 to 1
D) 0.10 to 1
The price/earnings ratio for 2017 is:A) 0.30 to 1
B) 5.20 to 1
C) 2.43 to 1
D) 0.10 to 1
Unlock Deck
Unlock for access to all 91 flashcards in this deck.
Unlock Deck
k this deck
69
The return on sales ratio is
A) An estimate of a firm's utilization of resources
B) A measure of the firm's ability to generate profits from all of its activities
C) A measure of profits generated by sales produced from the firm's assets
D) Calculated as (sales - cost of goods sold) divided by sales
A) An estimate of a firm's utilization of resources
B) A measure of the firm's ability to generate profits from all of its activities
C) A measure of profits generated by sales produced from the firm's assets
D) Calculated as (sales - cost of goods sold) divided by sales
Unlock Deck
Unlock for access to all 91 flashcards in this deck.
Unlock Deck
k this deck
70
Managers monitor earnings per share (EPS) because:
A) Investors use EPS as a basis in evaluating the firm's profitability.
B) EPS should be used as a single broad measure of overall firm performance. .
C) EPS is affected by dividends paid.
D) Retained earnings must be available for the payment of EPS.
A) Investors use EPS as a basis in evaluating the firm's profitability.
B) EPS should be used as a single broad measure of overall firm performance. .
C) EPS is affected by dividends paid.
D) Retained earnings must be available for the payment of EPS.
Unlock Deck
Unlock for access to all 91 flashcards in this deck.
Unlock Deck
k this deck
71
Because of its relationship to earnings and market price, which ratio is important to investors?
A) Dividend index
B) Dividend equity ratio
C) Dividend yield ratio
D) Price earnings ratio
A) Dividend index
B) Dividend equity ratio
C) Dividend yield ratio
D) Price earnings ratio
Unlock Deck
Unlock for access to all 91 flashcards in this deck.
Unlock Deck
k this deck
72
In using industry benchmarking and comparisons:
A) The industry averages are valuable because they apply to all firms within an industry.
B) One should avoid generalizations such as current ratios should be 2 to 1.
C) One gains valuable projections and forecasts.
D) Industry averages are universally applicable because they mask the effects of firm size.
Unlock Deck
Unlock for access to all 91 flashcards in this deck.
Unlock Deck
k this deck
73
-The gross margin percentage for 2017 is:
A) 29.3 percent
B) 65.4 percent
C) 70.7 percent
D) 43.8 percent
Unlock Deck
Unlock for access to all 91 flashcards in this deck.
Unlock Deck
k this deck
74
-The debt-to-equity ratio for 2017 is:
A) 54.9 percent
B) 48.2 percent
C) 45.1 percent
D) 61.9 percent
Unlock Deck
Unlock for access to all 91 flashcards in this deck.
Unlock Deck
k this deck
75
-The return-on-sales ratio for 2017 is:
A) 5.0 percent
B) 19.3 percent
C) 5.3 percent
D) 9.5 percent
Unlock Deck
Unlock for access to all 91 flashcards in this deck.
Unlock Deck
k this deck
76
-The earnings per share for 2017 is:
A) $60.07
B) $ 1.57
C) $ 7.16
D) $10.97
Unlock Deck
Unlock for access to all 91 flashcards in this deck.
Unlock Deck
k this deck
77
-The price-earnings ratio for 2017 is:
A) 11.93 times
B) 12.13 times
C) 2.28 times
D) 4.68 times
Unlock Deck
Unlock for access to all 91 flashcards in this deck.
Unlock Deck
k this deck
78
-The dividend yield ratio for 2017 is:
A) 28.00 percent
B) 13.00 percent
C) 5.87 percent
D) 5.00 percent
Unlock Deck
Unlock for access to all 91 flashcards in this deck.
Unlock Deck
k this deck
79
-The dividend payout ratio for 2017 is:
A) 9.10 percent
B) 30.60 percent
C) 63.81 percent
D) 100.00 percent
Unlock Deck
Unlock for access to all 91 flashcards in this deck.
Unlock Deck
k this deck
80
Show the effect of each of the transactions below on total assets and working capital by using one of the following symbols in each box to complete the table.
Unlock Deck
Unlock for access to all 91 flashcards in this deck.
Unlock Deck
k this deck
Unlock Deck
Unlock for access to all 91 flashcards in this deck.


