Deck 18: Multiple Regression
Full screen (f)
Question
Question
Question
Question
Question
Question
Question
Question
Question
Question
Question
Question
Question
Question
Question
Question
Question
Question
Question
Question
Question
The scatterplot of X and Y are shown as below.
 Based on the plot, which model is the most appropriate to use?
A) Yi = b1Xi + a + ei.
B) Yi = b1Xi + b2Xi2 + a + ei.
C) Yi = b1Xi2 + a + ei.
D) Yi = b1Xi + b2Xi + b3Xi3 + a + ei.
Based on the plot, which model is the most appropriate to use?A) Yi = b1Xi + a + ei.
B) Yi = b1Xi + b2Xi2 + a + ei.
C) Yi = b1Xi2 + a + ei.
D) Yi = b1Xi + b2Xi + b3Xi3 + a + ei.
Question
Question
Question
Question
Question
Question
Question
Question

Unlock Deck
Sign up to unlock the cards in this deck!
Unlock Deck
Unlock Deck
1/29
Play
Full screen (f)
Deck 18: Multiple Regression
1
Variable 1 is to be predicted from a combination of variable 2 and one of variables 3, 4, 5, and 6. The correlations of importance are as follows:
R13 = .3; r23 = .9
R14 = .4; r24 = .2
R15 = .6; r25 = .8
R16 = .7; r26 = .1
Which of the following multiple correlation coefficients will have the smallest value?
A) r1.23
B) r1.24
C) r1.25
D) r1.26
R13 = .3; r23 = .9
R14 = .4; r24 = .2
R15 = .6; r25 = .8
R16 = .7; r26 = .1
Which of the following multiple correlation coefficients will have the smallest value?
A) r1.23
B) r1.24
C) r1.25
D) r1.26
A
2
Carol is studying the correlation of college GPA (X1) and the number of hours spent on watching TV (X2). As intelligence is expected to affect GPA, she would like to remove the influence of IQ (X3) from GPA scores when computing the correlation. This is an example of which one of the following?
A) Bivariate correlation
B) Partial correlation
C) Semipartial correlation
D) Regression correlation
A) Bivariate correlation
B) Partial correlation
C) Semipartial correlation
D) Regression correlation
C
3
The correlation of GPA (X1) and the number of hours spent on watching TV (X2) where the influence of IQ (X3) is removed from GPA only can be denoted by
A) r2.13
B) r12.3
C) r13.2
D) r1(2.3)
E) r2(1.3)
A) r2.13
B) r12.3
C) r13.2
D) r1(2.3)
E) r2(1.3)
E
4
Suppose for the three variables, GPA (X1), time spent on watching TV (X2), and IQ (X3), the bivariate correlation coefficients are computed as below:
R12 = -0.4; r13 = 0.6; r23 = 0.
If we remove the influence of IQ from GPA, the correlation of GPA and the time spent on watching TV will be
A) stronger than the bivariate correlation r12.
B) weaker than the bivariate correlation r12.
C) the same as the bivariate correlation r12.
D) uncertain.
R12 = -0.4; r13 = 0.6; r23 = 0.
If we remove the influence of IQ from GPA, the correlation of GPA and the time spent on watching TV will be
A) stronger than the bivariate correlation r12.
B) weaker than the bivariate correlation r12.
C) the same as the bivariate correlation r12.
D) uncertain.
Unlock Deck
Unlock for access to all 29 flashcards in this deck.
Unlock Deck
k this deck
5
David is studying the correlation of temperature (X1) and the consumption of ice cream (X2). As he expects that the price of ice cream (X3) is correlated with both temperature and the consumption of ice cream, he would like to remove the effects of price from both X1 and X2 when computing the correlation. This is an example of which one of the following?
A) Bivariate correlation
B) Partial correlation
C) Semipartial correlation
D) Regression correlation
A) Bivariate correlation
B) Partial correlation
C) Semipartial correlation
D) Regression correlation
Unlock Deck
Unlock for access to all 29 flashcards in this deck.
Unlock Deck
k this deck
6
The correlation between temperature (X1) and the consumption of ice cream (X2) controlling for price of ice cream (X3) can be denoted by
A) r2.13
B) r12.3
C) r13.2
D) r1(2.3)
E) r2(1.3)
A) r2.13
B) r12.3
C) r13.2
D) r1(2.3)
E) r2(1.3)
Unlock Deck
Unlock for access to all 29 flashcards in this deck.
Unlock Deck
k this deck
7
David states that the correlation of the price of ice cream and the consumption of ice cream is -0.3 when temperature is held constant. By saying "held constant", David is implying that
A) he conducted an experiment in a laboratory where the temperature can be artificially controlled.
B) the correlation of price and consumption of ice cream is -0.3 when the effects of temperature are removed.
C) the conclusion is reached using data collected at the same temperature.
D) the correlation of price and consumption of ice cream is stronger when the temperature stays the same than when the temperature varies.
Unlock Deck
Unlock for access to all 29 flashcards in this deck.
Unlock Deck
k this deck
8
For three variables, X1, X2, and X3, the bivariate correlation coefficients are:
R12 = 0.7; r13 = 0; r23 = 0.
The correlation of X1 and X2 controlling for X3 will be
A) stronger than the bivariate correlation r12.
B) weaker than the bivariate correlation r12.
C) the same as the bivariate correlation r12.
D) uncertain.
R12 = 0.7; r13 = 0; r23 = 0.
The correlation of X1 and X2 controlling for X3 will be
A) stronger than the bivariate correlation r12.
B) weaker than the bivariate correlation r12.
C) the same as the bivariate correlation r12.
D) uncertain.
Unlock Deck
Unlock for access to all 29 flashcards in this deck.
Unlock Deck
k this deck
9
The regression line for predicting selling price of houses (in $1000) (Y) from size of the house (in 1000 square feet) (X1) and number of bathrooms (X2) is found to be Y = -41.8 + 64.8X1 + 19.2X2 + ei. Which of the following statements is a correct interpretation of the equation?
A) Compared to a house with only one bathroom, a house with two bathrooms will be $19200 higher in terms of selling price.
B) For two houses of the same size, the house with one additional bathroom is expected to be $19200 higher in its selling price.
C) Larger houses are expected to have higher selling prices than smaller houses, regardless of the number of bathrooms.
D) To increase the selling price of his house, the home owner should build as many bathrooms as he/she can in the house.
Unlock Deck
Unlock for access to all 29 flashcards in this deck.
Unlock Deck
k this deck
10
In the scenario described in Question 9, if the residual (ei) is -3.5 for a particular house, it means that
A) the regression function overestimates the selling price by $3,500.
B) the regression function underestimates the selling price by $3,500.
C) the selling price is estimated to be 3.5 standard deviations below the average price.
D) the regression function is not valid because the prediction is erroneous.
Unlock Deck
Unlock for access to all 29 flashcards in this deck.
Unlock Deck
k this deck
11
The multiple regression model for predicting Y from X1, X2, and X3 is
Yi = b1X1i + b2X2i + b3X3i + a + ei. If the bivariate correlation of Y and X1 is positive (rY1 > 0), the partial slope for X1 (b1) will be
A) a positive value.
B) a negative value.
C) zero.
D) uncertain.
Yi = b1X1i + b2X2i + b3X3i + a + ei. If the bivariate correlation of Y and X1 is positive (rY1 > 0), the partial slope for X1 (b1) will be
A) a positive value.
B) a negative value.
C) zero.
D) uncertain.
Unlock Deck
Unlock for access to all 29 flashcards in this deck.
Unlock Deck
k this deck
12
In multiple regression, if the null hypothesis, H0: 1 = 2 = 3 = 4 = 0, is rejected, it means that
A) there is no linear relationship between Y and any of the independent variables.
B) there is a linear relationship between Y and all four independent variables.
C) there is a linear relationship between Y and at least one independent variable.
D) none of the individual regression coefficients (bk) are significantly different from 0.
E) all of the individual regression coefficients (bk) are significantly different from each other.
Unlock Deck
Unlock for access to all 29 flashcards in this deck.
Unlock Deck
k this deck
13
In a multiple regression model, Y is predicted from X1, X2, and X3. Both R2 and Radj2 are computed. If X3 is removed from the model, how will R2 change?
A) R2 will increase.
B) R2 will decrease.
C) R2 will not change.
D) uncertain.
A) R2 will increase.
B) R2 will decrease.
C) R2 will not change.
D) uncertain.
Unlock Deck
Unlock for access to all 29 flashcards in this deck.
Unlock Deck
k this deck
14
In a multiple regression model, Y is predicted from X1, X2, and X3. Both R2 and Radj2 are computed. If X3 is removed from the model, how will Radj2 change?
A) Radj2 will increase.
B) Radj2 will decrease.
C) Radj2 will not change.
D) uncertain.
A) Radj2 will increase.
B) Radj2 will decrease.
C) Radj2 will not change.
D) uncertain.
Unlock Deck
Unlock for access to all 29 flashcards in this deck.
Unlock Deck
k this deck
15
For the regression model, Yi = b1X1i + b2X2i + a + ei, consider the following two situations:
Situation 1: rY1 = -0.5 rY2 = 0.8 r12 = 0.1
Situation 2: rY1 = -0.5 rY2 = 0.8 r12 = 0.3
In which of the two situations will R2 be larger?
A) situation 1.
B) situation 2.
C) R2 will be the same in both situations.
D) uncertain.
Situation 1: rY1 = -0.5 rY2 = 0.8 r12 = 0.1
Situation 2: rY1 = -0.5 rY2 = 0.8 r12 = 0.3
In which of the two situations will R2 be larger?
A) situation 1.
B) situation 2.
C) R2 will be the same in both situations.
D) uncertain.
Unlock Deck
Unlock for access to all 29 flashcards in this deck.
Unlock Deck
k this deck
16
For the regression model, Yi = b1X1i + b2X2i + a + ei, consider the following two situations:
Situation 1: rY1 = -0.5 rY2 = 0.8 r12 = 0.1
Situation 2: rY1 = 0.2 rY2 = 0.8 r12 = 0.1
In which of the two situations will R2 be larger?
A) situation 1.
B) situation 2.
C) R2 will be the same in both situations.
D) uncertain.
Situation 1: rY1 = -0.5 rY2 = 0.8 r12 = 0.1
Situation 2: rY1 = 0.2 rY2 = 0.8 r12 = 0.1
In which of the two situations will R2 be larger?
A) situation 1.
B) situation 2.
C) R2 will be the same in both situations.
D) uncertain.
Unlock Deck
Unlock for access to all 29 flashcards in this deck.
Unlock Deck
k this deck
17
In a multiple regression, the F test for the overall model is highly significant, but none of the t values for individual predictors are significant. What is the most likely cause for this situation?
A) heterogeneous variances.
B) non-independence of residuals.
C) non-normality of residuals.
D) non-linearity relation between Y and the predictors.
E) collinearity of the independent variables.
A) heterogeneous variances.
B) non-independence of residuals.
C) non-normality of residuals.
D) non-linearity relation between Y and the predictors.
E) collinearity of the independent variables.
Unlock Deck
Unlock for access to all 29 flashcards in this deck.
Unlock Deck
k this deck
18
All of the following are possible effects of multicollinearity except
A) the standard error of the regression coefficients may be larger than expected.
B) the signs of the regression coefficients may be opposite of what is expected.
C) regression coefficients can be quite unstable across samples.
D) R2 may be significant, yet none of the predictors are significant.
E) the VIF is 0 for all predictors.
Unlock Deck
Unlock for access to all 29 flashcards in this deck.
Unlock Deck
k this deck
19
Which of the following statements about R2 and Radj2 is correct?
A) R2 is always larger than Radj2.
B) R2 will always increase as more predictors are added to the model.
C) Radj2 adjusts for the number of independent variables and sample size.
D) If an additional independent variable were entered in the model, an increase in R2 indicates the new variable is adding value to the model.
E) R2 and Radj2 will never be negative.
Unlock Deck
Unlock for access to all 29 flashcards in this deck.
Unlock Deck
k this deck
20
Carol is building a multiple regression model to predict college GPA from a set of predictors. There is theory suggesting that college GPA can be predicted by students' involvement in college when controlling for their prior achievement. Therefore, Carol first entered into the model a set of variables that measure prior achievement (e.g., high school GPA, SAT), and then added a set of variables that measure collegial involvement. Which one of the following procedures is used?
A) Backward elimination
B) Forward selection
C) Stepwise selection
D) Hierarchical regression
A) Backward elimination
B) Forward selection
C) Stepwise selection
D) Hierarchical regression
Unlock Deck
Unlock for access to all 29 flashcards in this deck.
Unlock Deck
k this deck
21
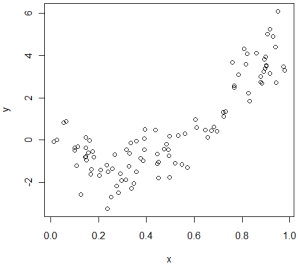
The scatterplot of X and Y are shown as below.
Based on the plot, which model is the most appropriate to use?
A) Yi = b1Xi + a + ei.
B) Yi = b1Xi + b2Xi2 + a + ei.
C) Yi = b1Xi2 + a + ei.
D) Yi = b1Xi + b2Xi + b3Xi3 + a + ei.
Based on the plot, which model is the most appropriate to use?A) Yi = b1Xi + a + ei.
B) Yi = b1Xi + b2Xi2 + a + ei.
C) Yi = b1Xi2 + a + ei.
D) Yi = b1Xi + b2Xi + b3Xi3 + a + ei.
Unlock Deck
Unlock for access to all 29 flashcards in this deck.
Unlock Deck
k this deck
22
Which of the following situations will result in the best prediction in multiple regression analysis?
A) rY1 = 0.1 rY2 = 0.4 r12 = 0.1
B) rY1 = 0.1 rY2 = 0.4 r12 = 0.8
C) rY1 = 0.6 rY2 = 0.4 r12 = 0.1
D) rY1 = 0.6 rY2 = 0.4 r12 = 0.8
A) rY1 = 0.1 rY2 = 0.4 r12 = 0.1
B) rY1 = 0.1 rY2 = 0.4 r12 = 0.8
C) rY1 = 0.6 rY2 = 0.4 r12 = 0.1
D) rY1 = 0.6 rY2 = 0.4 r12 = 0.8
Unlock Deck
Unlock for access to all 29 flashcards in this deck.
Unlock Deck
k this deck
23
An instructor wanted to know if the scores on pop quizzes are good predictors of the scores on the final exam. He used the following regression model,
Yi = b1X1i + b2X2i + b3X3i + a + ei, where Y is the score on the final exam, X1 is the score on the first quiz, X2 is the score on the second quiz, and X3 is the average score of the two quizzes. Evaluate this model.
A) The assumption of independence is violated.
B) The assumption of linearity is violated.
C) The assumption of noncollinearity is violated.
D) There is no indication of assumption violation based on the information given.
Unlock Deck
Unlock for access to all 29 flashcards in this deck.
Unlock Deck
k this deck
24
An interaction between X1 and X2 is present in which of the following situations?
A) The relationship between GPA (Y) and the time spent on watching TV (X1) is similar for students with different SAT scores (X2).
B) The relationship between GPA (Y) and the time spent on watching TV (X1) is different for students with higher SAT scores versus those with lower SAT scores (X2).
C) There is a strong correlation between the time spent on watching TV (X1) and SAT scores (X2).
D) There is a strong correlation between GPA (Y) and the time spent on watching TV (X1) controlling for SAT scores (X2).
Unlock Deck
Unlock for access to all 29 flashcards in this deck.
Unlock Deck
k this deck
25
Karen wants to use a categorical variable, levels of education, to predict annual income. There are six categories in the levels of education: High school graduate, Some college, Associate's degree, Bachelor's degree, Master's degree, Doctorate, or professional degree. How many categories need to be dummy coded and included in the regression model as predictors?
A) 4
B) 5
C) 6
D) 7
A) 4
B) 5
C) 6
D) 7
Unlock Deck
Unlock for access to all 29 flashcards in this deck.
Unlock Deck
k this deck
26
You are given the following data, where X1 (Pretest score) and X2 (Hours spent in the program) are used to predict Y (Posttest score):
Determine the following values: intercept, b1, b2, SSres, SSreg, F, sres2, s(b1), s(b2), t1, t2.
Determine the following values: intercept, b1, b2, SSres, SSreg, F, sres2, s(b1), s(b2), t1, t2.
Unlock Deck
Unlock for access to all 29 flashcards in this deck.
Unlock Deck
k this deck
27
Calculate the partial correlation r12.3 and the part correlation r1(2.3) from the following bivariate correlations: r12 = .3, r13 = -.5, r23 = -.8.
Unlock Deck
Unlock for access to all 29 flashcards in this deck.
Unlock Deck
k this deck
28
A researcher would like to predict GPA from a set of three predictor variables for a sample of 34 college students. Multiple linear regression analysis was utilized. Complete the following summary table ( = .05) for the test of significance of the overall regression model:
Unlock Deck
Unlock for access to all 29 flashcards in this deck.
Unlock Deck
k this deck
29
You are given the following data, where X1 (attendance rate) and X2 (average SAT score) are to be used to predict Y (average score in graduation test). Each case represents one school.
Determine the following values: intercept, b1, b2, SSres, SSreg, F, sres2, s(b1), s(b2), t1, t2.
Determine the following values: intercept, b1, b2, SSres, SSreg, F, sres2, s(b1), s(b2), t1, t2.
Unlock Deck
Unlock for access to all 29 flashcards in this deck.
Unlock Deck
k this deck
Unlock Deck
Unlock for access to all 29 flashcards in this deck.


