Deck 1: Data, Functions, and Models
Full screen (f)
Question
Question
Question
Question
The price per gallon of gas at various gas stations around town is listed in the table below. What is the median price per gallon? (Rounded to the nearest hundredth)

A) $2.88
B) $2.78
C) $3.02
D) $2.42
E) $2.56
A) $2.88
B) $2.78
C) $3.02
D) $2.42
E) $2.56
Question
Question
Question
The table below gives the cost for one-credit of tuition at various colleges.
The median cost gives a better description than average cost for the tuition costs.
The median cost gives a better description than average cost for the tuition costs.
Question
Question
The table below illustrates a set of data for a function. 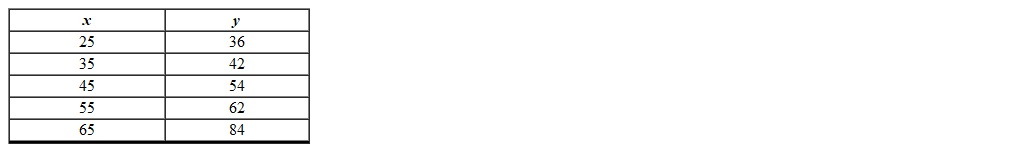
Question
Question
Question
Question
The table below illustrates a set of data for a function.
Question
Question
The table below describes the average temperatures for Portland, OR during a given year. What is the average temperature for the year? (Rounded to the nearest tenth)

A) 61.0
B) 68.5
C) 70.0
D) 67.0
E) 63.1
A) 61.0
B) 68.5
C) 70.0
D) 67.0
E) 63.1
Question
The table below describes the average temperatures for Portland, OR during a given year. What is the median temperature for the year?

A) 64.5
B) 67.0
C) 75.0
D) 71.0
E) 64.0
A) 64.5
B) 67.0
C) 75.0
D) 71.0
E) 64.0
Question
The relation  is not a function.
is not a function. Question
The price per gallon of gas at various gas stations around town is listed in the table below. What is the average price per gallon? (Rounded to the nearest hundredth)

A) $2.31
B) $2.52
C) $2.82
D) $2.76
E) $3.02
A) $2.31
B) $2.52
C) $2.82
D) $2.76
E) $3.02
Question
Question
Question
Find the input(s) corresponding to the output of 30.
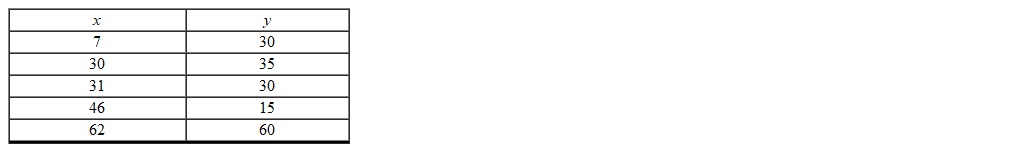
A) 30 and 35
B) 7 and 31
C) 7
D) 31
E) 35
A) 30 and 35
B) 7 and 31
C) 7
D) 31
E) 35
Question
Find the output(s) corresponding to the input of 30.
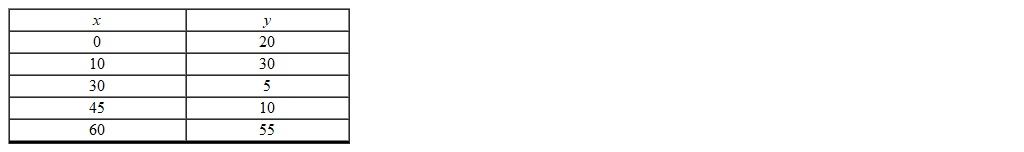
A) 10
B) 0
C) 30
D) 5
E) 55
A) 10
B) 0
C) 30
D) 5
E) 55
Question
The cost for a cell phone plan starts at $29.99 per month plus $0.07 per minute. Which of the following models the monthly cost of the cell phone based on the number of minutes used?
A) C = 29.99 m
B) C = 0.07 + 29.99 m
C) C = 29.99 + 0.07 m
D) C = 0.07 m
E) C = 29.99 0.07 m
A) C = 29.99 m
B) C = 0.07 + 29.99 m
C) C = 29.99 + 0.07 m
D) C = 0.07 m
E) C = 29.99
0.07 m Question
For the scatter plot below, which statement describes the relationship between the variables? 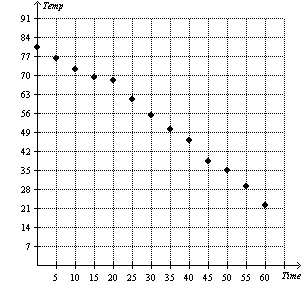
A) As the time increases, the temperature increases.
B) As the time increases, the temperature decreases.
C) As the time decreases, the temperature stays constant.
D) There is no relationship between the variables.
E) As the time decreases, the temperature decreases.
A) As the time increases, the temperature increases.
B) As the time increases, the temperature decreases.
C) As the time decreases, the temperature stays constant.
D) There is no relationship between the variables.
E) As the time decreases, the temperature decreases.
Question
Using the table below, determine the value for the blank.
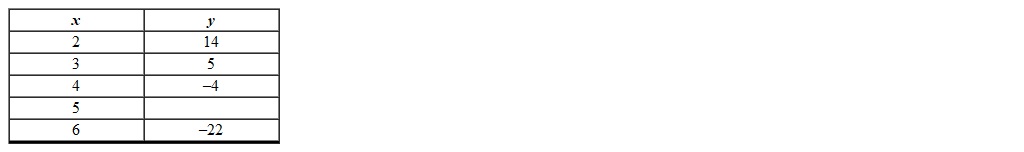
A) -6
B) -3
C) -13
D) -2
E) 14
A) -6
B) -3
C) -13
D) -2
E) 14
Question
The following table shows the values of airfare for a roundtrip ticket from San Antonio, TX to Portland, OR.
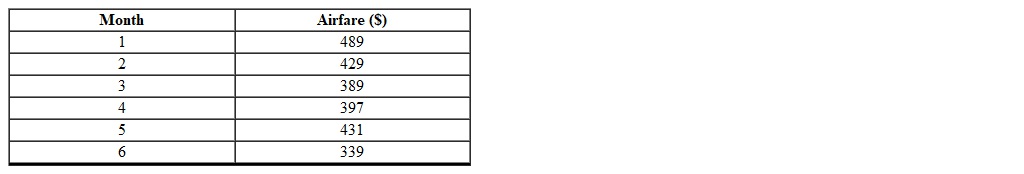
Which one of the following scatterplots illustrates this data?
A)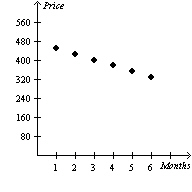
B)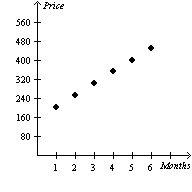
C)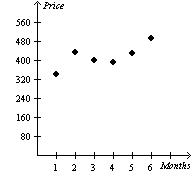
D) None of these options.
E)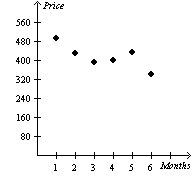
Which one of the following scatterplots illustrates this data?
A)
B)
C)
D) None of these options.
E)
Question
The number of gallons of water remaining in a pool t hours after it began to drain is illustrated in the table below.
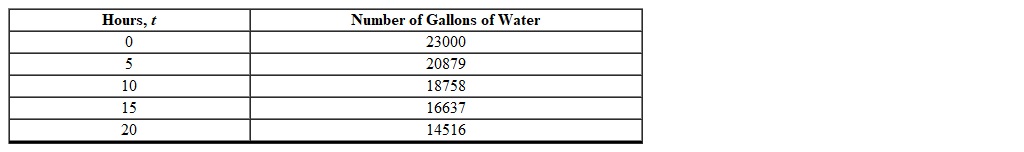
What is the first difference of the number of gallons of water?
A) -2121
B) 2121
C) 424.2
D) -424.2
E) 5
What is the first difference of the number of gallons of water?
A) -2121
B) 2121
C) 424.2
D) -424.2
E) 5
Question
The number of gallons of water remaining in a pool t hours after it began to drain is illustrated in the table below.
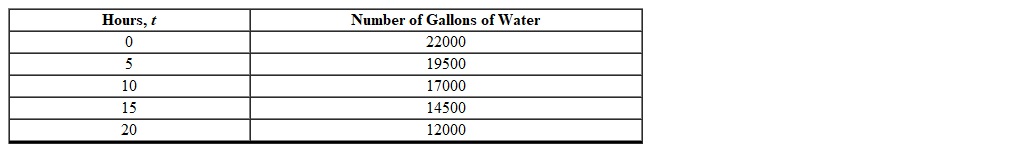
What is the initial number of gallons of water in the pool before it began to drain?
A) 19500
B) 22000
C) 14500
D) 17000
E) 12000
What is the initial number of gallons of water in the pool before it began to drain?
A) 19500
B) 22000
C) 14500
D) 17000
E) 12000
Question
Which one of the following models the data graphed in the scatter plot. 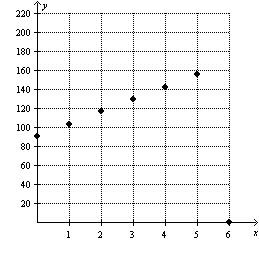
A)
B)
C)
D)
E)
A)
B)
C)
D)
E)
Question
Find the domain and range of the relation  .
.
A) Domain: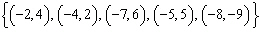 ; Range:
B) Domain: ; Range:
C) Domain: ; Range:
D) Domain: ; Range:
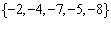
E) Domain: ; Range:
.A) Domain:
; Range: B) Domain:
; Range: C) Domain:
; Range: D) Domain:
; Range: E) Domain:
; Range: Question
The table below describes the average temperatures for Portland, OR during a given year. What month had the lowest temperature?

A) January
B) November
C) March
D) February
E) December
A) January
B) November
C) March
D) February
E) December
Question
The mass of bacteria (in micrograms) in a Petri dish for different times is shown in the table below. Approximately what time was the mass of the bacteria 45 mcg?

A) Between 9:00 am and 9:30 am
B) Between 9:30 am and 10:00 am
C) Not enough information
D) Between 8:30 am and 9:00 am
E) Between 8:00 am and 8:30 am
A) Between 9:00 am and 9:30 am
B) Between 9:30 am and 10:00 am
C) Not enough information
D) Between 8:30 am and 9:00 am
E) Between 8:00 am and 8:30 am
Question
Question
The table below describes the average temperatures for Portland, OR during a given year. What was the average temperature for May?

A) 73
B) 81
C) 68
D) 42
E) 60
A) 73
B) 81
C) 68
D) 42
E) 60
Question
The mass of bacteria (in micrograms) in a Petri dish for different times is shown in the table below. What is the mass of the bacteria (in mcg) at 9:30 am?

A) 61.89
B) 75.79
C) 50.60
D) 1.5
E) 31.08
A) 61.89
B) 75.79
C) 50.60
D) 1.5
E) 31.08
Question
The mass of bacteria (in micrograms) in a Petri dish for different times is shown in the table below. By how much did the bacteria grow from 8:30 am to 10:30 am?

A) 73.18
B) 51.35
C) 38.80
D) 34.38
E) 2
A) 73.18
B) 51.35
C) 38.80
D) 34.38
E) 2
Question
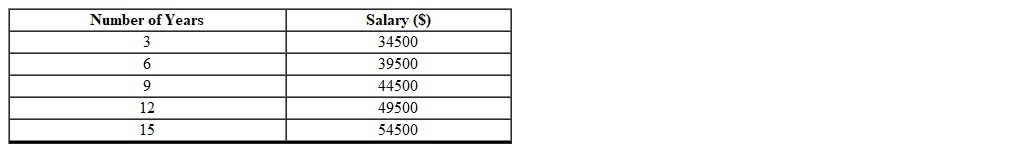
Given the data below, how can you determine if the set of data has a linear model?
A) By verifying that the salary values increases when the number of years increases.
B) Not enough information
C) By verifying that the first differences of the salary values are constant for successive increases in the number of years.
D) By verifying that the salary increases by the same amount.
E) By verifying that the number of years increases by the same amount.
Question
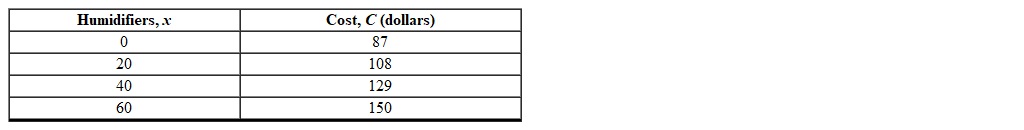
The following table shows data for the cost of humidifiers based on the number of humidifiers produced. Find a linear model for the cost C of producing x humidifiers.
A) C = 1.05 + 87 x
B) C = 1.05 x
C) C = 87 + 1.05 x
D) C = 87 + 20 x
E) C = 87 x
A) C = 1.05 + 87 x
B) C = 1.05 x
C) C = 87 + 1.05 x
D) C = 87 + 20 x
E) C = 87 x
Question
The number of gallons of water remaining in a pool t hours after it began to drain is illustrated in the table below.
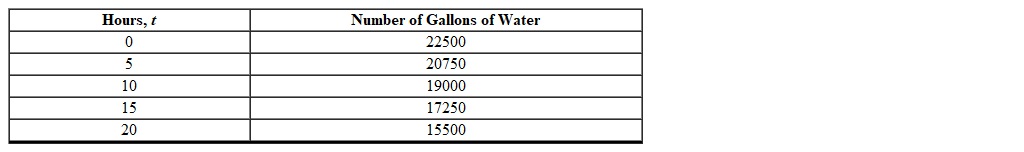
Which one of the following models this data?
A) N = 1750 350 t
350 t
B) N = 22500 + 1750 t
C) N = 22500 + 350 t
D) N = 22500 350 t
350 t
E) N = 22500 1750 t
Which one of the following models this data?
A) N = 1750
350 tB) N = 22500 + 1750 t
C) N = 22500 + 350 t
D) N = 22500
350 tE) N = 22500
1750 t Question
Using the table below, determine the value for the blank. 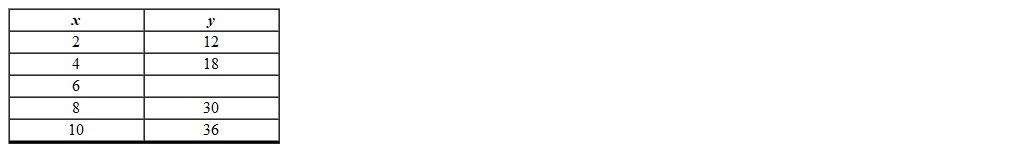
A) 24
B) 21
C) 28
D) 23
E) 27
A) 24
B) 21
C) 28
D) 23
E) 27
Question
Which one of the following graphs represent the function: 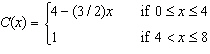
A)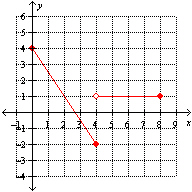
B)
C) None of these options.
D)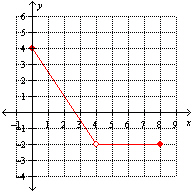
E)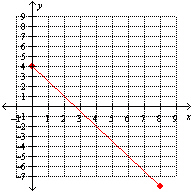
A)
B)
C) None of these options.
D)
E)
Question
A ball is thrown straight upward from a bridge and then falls all the way to the ground (past the bridge). The ball s height h (in feet) above the ground t seconds after the ball is thrown is given by h(t) =  16 t
16 t  + 48 t + 111. What is the meaning of h (2)?
A) After 2 seconds, the height of the ball is 175 feet above ground.
B) After 2 seconds, the height of the ball is 143 feet above ground.
C) After 2 seconds, the height of the ball is 111 feet above ground.
D) After 2 seconds, the height of the ball is 32 feet above ground.
E) After 2 seconds, the height of the ball is 817 feet above ground.
16 t + 48 t + 111. What is the meaning of h (2)?A) After 2 seconds, the height of the ball is 175 feet above ground.
B) After 2 seconds, the height of the ball is 143 feet above ground.
C) After 2 seconds, the height of the ball is 111 feet above ground.
D) After 2 seconds, the height of the ball is 32 feet above ground.
E) After 2 seconds, the height of the ball is 817 feet above ground.
Question
Given the table below, find the net change in the variable y as x changes from 2 to 4?

A) -9
B) 2
C) 9
D) 6
E) -3
A) -9
B) 2
C) 9
D) 6
E) -3
Question
A population of rabbits was tracked over a 55-day period. The data is shown in the following graph. What was the maximum number of rabbits during this time period? 
A) 61
B) 49
C) 38
D) 15
E) 83
A) 61
B) 49
C) 38
D) 15
E) 83
Question
Consider the function f(x) = 4 x  7. What is the name of the function? What is the input? What is the output?
A) Name: f ; Input: x ; Output: 4 x 7
7
B) Name: f(x) ; Input: x ; Output: 4 x 7
7
C) Name: f(x) ; Input: 4 x 7; Output: x
D) Name: f(x) ; Input: x ; Output: f
E) Name: f ; Input: 4 x 7; Output: x
7. What is the name of the function? What is the input? What is the output?A) Name: f ; Input: x ; Output: 4 x
7B) Name: f(x) ; Input: x ; Output: 4 x
7C) Name: f(x) ; Input: 4 x
7; Output: xD) Name: f(x) ; Input: x ; Output: f
E) Name: f ; Input: 4 x
7; Output: x Question
Find the domain of  .
.
A)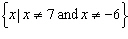
B)
C)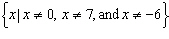
D)
E)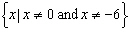
.A)
B)
C)
D)
E)
Question
A ball is thrown straight upward from a bridge and then falls all the way to the ground (past the bridge). The ball s height h (in feet) above the ground t seconds after the ball is thrown is given by h(t) =  16 t
16 t  + 48 t + 111. Find the net change in the height of the ball from time t = 1 seconds to t = 4 seconds.
A) 96 feet
B) 47 feet
C) -143 feet
D) -96 feet
E) 3 feet
16 t + 48 t + 111. Find the net change in the height of the ball from time t = 1 seconds to t = 4 seconds.A) 96 feet
B) 47 feet
C) -143 feet
D) -96 feet
E) 3 feet
Question
Determine the domain and range of the function represented by the graph. 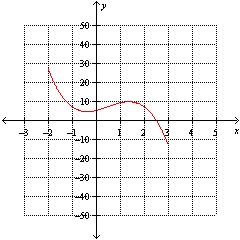
A) Domain: ; Range:
B) Domain: ; Range:
C) Domain: ; Range:
D) Domain: ; Range:
E) Domain: ; Range:
A) Domain:
; Range: B) Domain:
; Range: C) Domain:
; Range: D) Domain:
; Range: E) Domain:
; Range: Question
Let f(x) = 3 x  + 4 x
+ 4 x  4. Find f ( 4).
A) 48
B) -32
C) 32
D) 28
E) -68
+ 4 x 4. Find f ( 4).A) 48
B) -32
C) 32
D) 28
E) -68
Question
The temperature (in ° F) of a town is taken at the beginning of each hour throughout one day starting at 5 a.m. Let T be the function defined by T(x) = temperature of the town at time x . Which one of the following graphs represents this scenario?
A)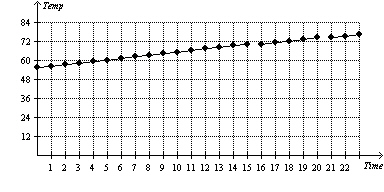
B) Not enough information
C)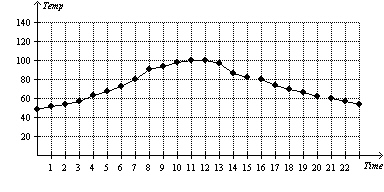
D)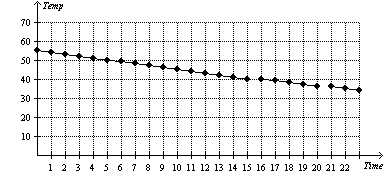
E)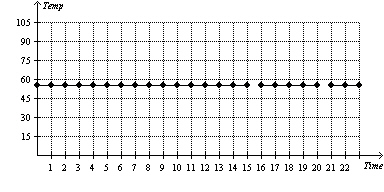
A)
B) Not enough information
C)
D)
E)
Question
Use the following graph to create an algebra model for the function. 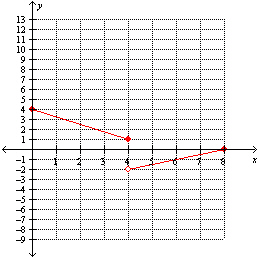
A)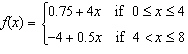
B)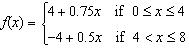
C)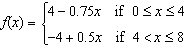
D)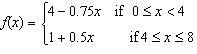
E)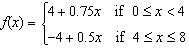
A)
B)
C)
D)
E)
Question
Which one of the following best describes the function  ?
?
A) The rule h is "divide the input by 4 and subtract 1, then multiply by 6."
B) The rule h is "multiply the input by 6 and subtract 1, then divide by 4."
C) The rule h is "multiply the input by 6 and divide by 4, then subtract 1."
D) The rule h is "divide 6 by 4 and multiply by the input, then subtract 1."
E) The rule h is "subtract 1 from the input and multiply by 6, then divide by 4."
?A) The rule h is "divide the input by 4 and subtract 1, then multiply by 6."
B) The rule h is "multiply the input by 6 and subtract 1, then divide by 4."
C) The rule h is "multiply the input by 6 and divide by 4, then subtract 1."
D) The rule h is "divide 6 by 4 and multiply by the input, then subtract 1."
E) The rule h is "subtract 1 from the input and multiply by 6, then divide by 4."
Question
A membership to a local fitness club costs $29 per month. The membership includes 10 hours of use of the club. If you want to use the club more than 10 hours per month, it will cost an additional $1.55 per hour. Which of the following functions model this situation?
A)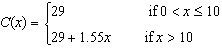
B)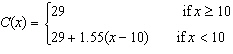
C)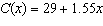
D)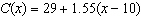
E)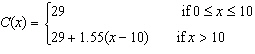
A)
B)
C)
D)
E)
Question
A population of rabbits was tracked over a 55-day period. The data is shown in the following graph. How did the population of rabbits change between day 3 and day 20? 
A) The population of rabbits increased from approximately 5 rabbits to 83 rabbits.
B) The population of rabbits decreased from approximately 83 rabbits to 5 rabbits.
C) The population of rabbits increased from approximately 5 rabbits to 61 rabbits.
D) The population of rabbits was constant during this time period.
E) The population of rabbits decreased from approximately 61 rabbits to 5 rabbits.
Question
A membership to a local fitness club costs $49 per month. The membership includes 20 hours of use of the club. If you want to use the club more than 20 hours per month, it will cost an additional $1.80 per hour. Let C represent the cost of the membership and x represent the number of hours of use of the club. Find and interpret  .
.
A) The cost of 33 hours of use of the club per month is $49.00.
B) The cost of 33 hours of use of the club per month is $50.80.
C) The cost of 33 hours of use of the club per month is $108.40.
D) The cost of 33 hours of use of the club per month is $23.40.
E) The cost of 33 hours of use of the club per month is $72.40.
.A) The cost of 33 hours of use of the club per month is $49.00.
B) The cost of 33 hours of use of the club per month is $50.80.
C) The cost of 33 hours of use of the club per month is $108.40.
D) The cost of 33 hours of use of the club per month is $23.40.
E) The cost of 33 hours of use of the club per month is $72.40.
Question
The distance d (in miles) that a car travels based on the amount of time t (in seconds) is given by the equation d = 3 t 
 2 t . What is the net change in distance d when the time t changes from 0 to 2 seconds?
A) 8 miles
B) 12 miles
C) 0 miles
D) 2 miles
E) 36 miles
2 t . What is the net change in distance d when the time t changes from 0 to 2 seconds?A) 8 miles
B) 12 miles
C) 0 miles
D) 2 miles
E) 36 miles
Question
The cost of college tuition for 12 credit hours at a local college during 2000 to 2008 is shown in the table below. Find the net change in the cost of college tuition from 2000 to 2005 and state if the net change was an increase or decrease. 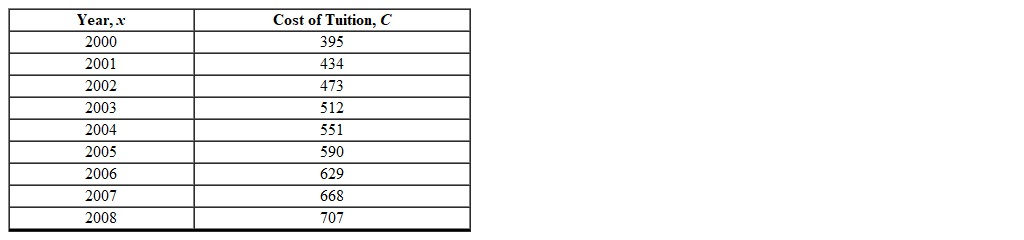
A) -195, decrease
B) 312, increase
C) -312, decrease
D) 195, increase
E) 39, increase
A) -195, decrease
B) 312, increase
C) -312, decrease
D) 195, increase
E) 39, increase
Question
Question
Which one of the following represents the graph of  ?
?
A)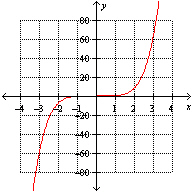
B)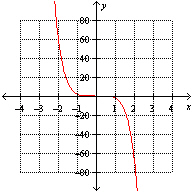
C)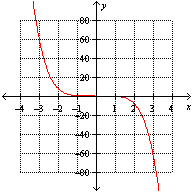
D)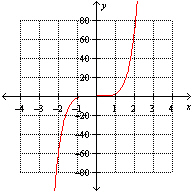
E) None of the above
?A)
B)
C)
D)
E) None of the above
Question
Given the table below, find the net change in the variable y as x changes from 1 to 4?

A) 8
B) 7
C) 6
D) 9
E) 0
A) 8
B) 7
C) 6
D) 9
E) 0
Question
Question
Question
For the function  , find the local maximum value of f .
A) 1.6
B) -0.6
C) 0
D) 1
E) 0.25
, find the local maximum value of f . A) 1.6
B) -0.6
C) 0
D) 1
E) 0.25
Question
For the function  , find the intervals on which
  is increasing.
A)
B)
C)
D)
E)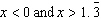
, find the intervals on which is increasing. A)
B)
C)
D)
E)
Question
Which of the following formulas express the average score for 4 exams?
A)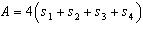
B)
C)
D)
E)
A)
B)
C)
D)
E)
Question
The table below shows the salary values for a job based on the number of years x worked. Find a linear model for the salary value S(x) as a function of the number of years x worked.

A) S(x) = 3000 x
B) S(x) = 36000 + 1000 x
C) S(x) = 1000 x
D) S(x) = 36000 + 3000 x
E) S(x) = 33000 + 1000 x
A) S(x) = 3000 x
B) S(x) = 36000 + 1000 x
C) S(x) = 1000 x
D) S(x) = 36000 + 3000 x
E) S(x) = 33000 + 1000 x
Question
Question
A population of rabbits was tracked over a 55-day period. The data is shown in the following graph. What was the approximate number of rabbits on day 30? 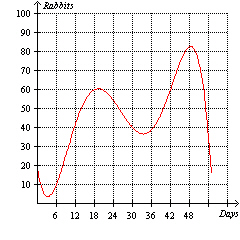
A) 40
B) 15
C) 10
D) 30
E) 83
A) 40
B) 15
C) 10
D) 30
E) 83
Question
Solve the equation  for
for  .
.
A)
B)
C)
D)
E)
for .A)
B)
C)
D)
E)
Question
The amount of an investment A after 36 months can be modeled by the formula 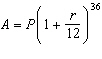 where P is the initial investment amount and r % is the interest rate. If Marcus invests $2000 in this account with an interest rate of 3.7500%, how much money will be in the account at the end of 36 months? (Rounded to the nearest hundredths)
A) $7,526.65
B) $2,006.25
C) $2000
D) $72,225.00
E) $2,237.75
where P is the initial investment amount and r % is the interest rate. If Marcus invests $2000 in this account with an interest rate of 3.7500%, how much money will be in the account at the end of 36 months? (Rounded to the nearest hundredths)A) $7,526.65
B) $2,006.25
C) $2000
D) $72,225.00
E) $2,237.75
Question
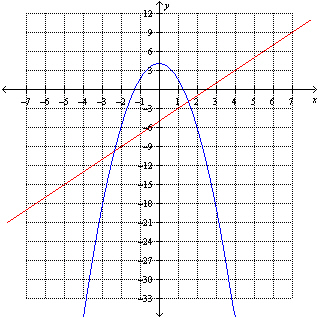
The graphs of  and
and  are shown below. Find the value(s) of x for which
  .
. 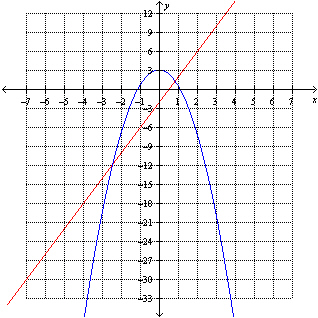
A) -2.4 and 0.8
B) 0.8
C) -2.4 and -11.7
D) -2.4
E) -11.7 and 1.3
and are shown below. Find the value(s) of x for which . A) -2.4 and 0.8
B) 0.8
C) -2.4 and -11.7
D) -2.4
E) -11.7 and 1.3
Question
Does the equation x = ( y  6)
6)  + 3 define the variable y as a function of the variable x ?
6) + 3 define the variable y as a function of the variable x ? Question
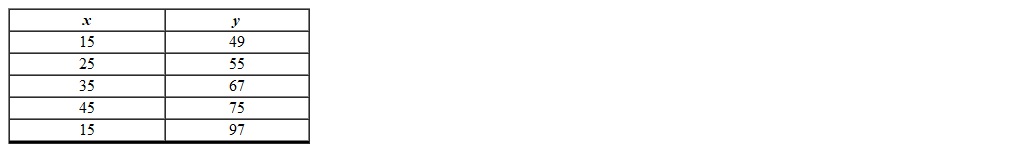
Given the table below, is the variable y a function of the variable x ?

Question
Question
Given the table below, is the variable y a function of the variable x ?

Question
The graphs of  and
and  are shown below. Find the value(s) of x for which
  .
. 
A)
B)
C)
D)
E)
and are shown below. Find the value(s) of x for which . A)
B)
C)
D)
E)
Question
For the function  , find the local minimum value of f .
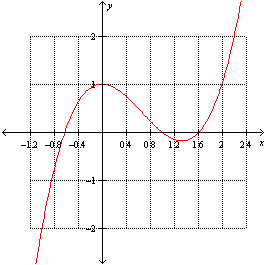
A) -0.6
B) -0.185
C) -1
D) 1
E) 1.6
, find the local minimum value of f . A) -0.6
B) -0.185
C) -1
D) 1
E) 1.6
Question
A population of rabbits was tracked over a 55-day period. The data is shown in the following graph. What was the minimum number of rabbits during this time? 
A) 20
B) 37
C) 83
D) 5
E) 15
A) 20
B) 37
C) 83
D) 5
E) 15
Question
The resistance R of a wire (in ohms) is related to its length L (in meters) and its diameter d (in meters) by the formula  . Find a formula for d .
A)
B)
C)
D)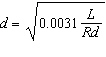
E)
. Find a formula for d .A)
B)
C)
D)
E)
Question
Find a formula that models the speed s of a car that travels d miles in t minutes.
A)
B)
C)
D)
E)
A)
B)
C)
D)
E)

Unlock Deck
Sign up to unlock the cards in this deck!
Unlock Deck
Unlock Deck
1/81
Play
Full screen (f)
Deck 1: Data, Functions, and Models
1
If the temperatures over a 12-hour period in Phoenix, Arizona were 76, 81, 90, 98, 101, 106, 100, 98, 93, 83, 72, and 75, what was the median temperature during this time period?
A) 90
B) 100
C) 106
D) 93
E) 91.5
A) 90
B) 100
C) 106
D) 93
E) 91.5
91.5
2
The set of all possible inputs is called the domain of the function.
True
3
All functions can be represented verbally, symbolically, numerically, and graphically.
False
4
The price per gallon of gas at various gas stations around town is listed in the table below. What is the median price per gallon? (Rounded to the nearest hundredth)
A) $2.88
B) $2.78
C) $3.02
D) $2.42
E) $2.56
A) $2.88
B) $2.78
C) $3.02
D) $2.42
E) $2.56
Unlock Deck
Unlock for access to all 81 flashcards in this deck.
Unlock Deck
k this deck
5
A variable y is a function of a variable x if each value of x (the input) corresponds to exactly one value of y (the output).
Unlock Deck
Unlock for access to all 81 flashcards in this deck.
Unlock Deck
k this deck
6
If the temperatures over a 12-hour period in Phoenix, Arizona were 72, 83, 91, 90, 103, 102, 98, 96, 93, 82, 80, and 72, what was the average temperature during this time period? (Round to the nearest degree)
A) 91
B) 72
C) 96
D) 89
E) 1062
A) 91
B) 72
C) 96
D) 89
E) 1062
Unlock Deck
Unlock for access to all 81 flashcards in this deck.
Unlock Deck
k this deck
7
The table below gives the cost for one-credit of tuition at various colleges.
The median cost gives a better description than average cost for the tuition costs.
The median cost gives a better description than average cost for the tuition costs.
Unlock Deck
Unlock for access to all 81 flashcards in this deck.
Unlock Deck
k this deck
8
If the net change of a function f from a to b is negative, then the function must steadily increase from a to b .
Unlock Deck
Unlock for access to all 81 flashcards in this deck.
Unlock Deck
k this deck
9
The table below illustrates a set of data for a function.
Unlock Deck
Unlock for access to all 81 flashcards in this deck.
Unlock Deck
k this deck
10
The graph of f(x) = -8 is a horizontal line.
Unlock Deck
Unlock for access to all 81 flashcards in this deck.
Unlock Deck
k this deck
11
All relations are functions.
Unlock Deck
Unlock for access to all 81 flashcards in this deck.
Unlock Deck
k this deck
12
A table of values is an example of a numeric representation of a function.
Unlock Deck
Unlock for access to all 81 flashcards in this deck.
Unlock Deck
k this deck
13
The table below illustrates a set of data for a function.
Unlock Deck
Unlock for access to all 81 flashcards in this deck.
Unlock Deck
k this deck
14
If your quiz scores for MAT 101 are 85, 92, 75, 100, and 69, what is your quiz average?
A) 421
B) 84.2
C) 4.21
D) 75
E) 105.25
A) 421
B) 84.2
C) 4.21
D) 75
E) 105.25
Unlock Deck
Unlock for access to all 81 flashcards in this deck.
Unlock Deck
k this deck
15
The table below describes the average temperatures for Portland, OR during a given year. What is the average temperature for the year? (Rounded to the nearest tenth)
A) 61.0
B) 68.5
C) 70.0
D) 67.0
E) 63.1
A) 61.0
B) 68.5
C) 70.0
D) 67.0
E) 63.1
Unlock Deck
Unlock for access to all 81 flashcards in this deck.
Unlock Deck
k this deck
16
The table below describes the average temperatures for Portland, OR during a given year. What is the median temperature for the year?
A) 64.5
B) 67.0
C) 75.0
D) 71.0
E) 64.0
A) 64.5
B) 67.0
C) 75.0
D) 71.0
E) 64.0
Unlock Deck
Unlock for access to all 81 flashcards in this deck.
Unlock Deck
k this deck
17
The relation is not a function.
is not a function. Unlock Deck
Unlock for access to all 81 flashcards in this deck.
Unlock Deck
k this deck
18
The price per gallon of gas at various gas stations around town is listed in the table below. What is the average price per gallon? (Rounded to the nearest hundredth)
A) $2.31
B) $2.52
C) $2.82
D) $2.76
E) $3.02
A) $2.31
B) $2.52
C) $2.82
D) $2.76
E) $3.02
Unlock Deck
Unlock for access to all 81 flashcards in this deck.
Unlock Deck
k this deck
19
If the net change of a function f from a to b is zero, then the function must be constant between a and b .
Unlock Deck
Unlock for access to all 81 flashcards in this deck.
Unlock Deck
k this deck
20
All functions are relations.
Unlock Deck
Unlock for access to all 81 flashcards in this deck.
Unlock Deck
k this deck
21
Find the input(s) corresponding to the output of 30.
A) 30 and 35
B) 7 and 31
C) 7
D) 31
E) 35
A) 30 and 35
B) 7 and 31
C) 7
D) 31
E) 35
Unlock Deck
Unlock for access to all 81 flashcards in this deck.
Unlock Deck
k this deck
22
Find the output(s) corresponding to the input of 30.
A) 10
B) 0
C) 30
D) 5
E) 55
A) 10
B) 0
C) 30
D) 5
E) 55
Unlock Deck
Unlock for access to all 81 flashcards in this deck.
Unlock Deck
k this deck
23
The cost for a cell phone plan starts at $29.99 per month plus $0.07 per minute. Which of the following models the monthly cost of the cell phone based on the number of minutes used?
A) C = 29.99 m
B) C = 0.07 + 29.99 m
C) C = 29.99 + 0.07 m
D) C = 0.07 m
E) C = 29.99 0.07 m
A) C = 29.99 m
B) C = 0.07 + 29.99 m
C) C = 29.99 + 0.07 m
D) C = 0.07 m
E) C = 29.99
0.07 m Unlock Deck
Unlock for access to all 81 flashcards in this deck.
Unlock Deck
k this deck
24
For the scatter plot below, which statement describes the relationship between the variables?
A) As the time increases, the temperature increases.
B) As the time increases, the temperature decreases.
C) As the time decreases, the temperature stays constant.
D) There is no relationship between the variables.
E) As the time decreases, the temperature decreases.
A) As the time increases, the temperature increases.
B) As the time increases, the temperature decreases.
C) As the time decreases, the temperature stays constant.
D) There is no relationship between the variables.
E) As the time decreases, the temperature decreases.
Unlock Deck
Unlock for access to all 81 flashcards in this deck.
Unlock Deck
k this deck
25
Using the table below, determine the value for the blank.
A) -6
B) -3
C) -13
D) -2
E) 14
A) -6
B) -3
C) -13
D) -2
E) 14
Unlock Deck
Unlock for access to all 81 flashcards in this deck.
Unlock Deck
k this deck
26
The following table shows the values of airfare for a roundtrip ticket from San Antonio, TX to Portland, OR.
Which one of the following scatterplots illustrates this data?
A)
B)
C)
D) None of these options.
E)
Which one of the following scatterplots illustrates this data?
A)
B)
C)
D) None of these options.
E)
Unlock Deck
Unlock for access to all 81 flashcards in this deck.
Unlock Deck
k this deck
27
The number of gallons of water remaining in a pool t hours after it began to drain is illustrated in the table below.
What is the first difference of the number of gallons of water?
A) -2121
B) 2121
C) 424.2
D) -424.2
E) 5
What is the first difference of the number of gallons of water?
A) -2121
B) 2121
C) 424.2
D) -424.2
E) 5
Unlock Deck
Unlock for access to all 81 flashcards in this deck.
Unlock Deck
k this deck
28
The number of gallons of water remaining in a pool t hours after it began to drain is illustrated in the table below.
What is the initial number of gallons of water in the pool before it began to drain?
A) 19500
B) 22000
C) 14500
D) 17000
E) 12000
What is the initial number of gallons of water in the pool before it began to drain?
A) 19500
B) 22000
C) 14500
D) 17000
E) 12000
Unlock Deck
Unlock for access to all 81 flashcards in this deck.
Unlock Deck
k this deck
29
Which one of the following models the data graphed in the scatter plot.
A)
B)
C)
D)
E)
A)
B)
C)
D)
E)
Unlock Deck
Unlock for access to all 81 flashcards in this deck.
Unlock Deck
k this deck
30
Find the domain and range of the relation .
A) Domain: ; Range:
B) Domain: ; Range:
C) Domain: ; Range:
D) Domain: ; Range:
E) Domain: ; Range:
.A) Domain:
; Range: B) Domain:
; Range: C) Domain:
; Range: D) Domain:
; Range: E) Domain:
; Range: Unlock Deck
Unlock for access to all 81 flashcards in this deck.
Unlock Deck
k this deck
31
The table below describes the average temperatures for Portland, OR during a given year. What month had the lowest temperature?
A) January
B) November
C) March
D) February
E) December
A) January
B) November
C) March
D) February
E) December
Unlock Deck
Unlock for access to all 81 flashcards in this deck.
Unlock Deck
k this deck
32
The mass of bacteria (in micrograms) in a Petri dish for different times is shown in the table below. Approximately what time was the mass of the bacteria 45 mcg?
A) Between 9:00 am and 9:30 am
B) Between 9:30 am and 10:00 am
C) Not enough information
D) Between 8:30 am and 9:00 am
E) Between 8:00 am and 8:30 am
A) Between 9:00 am and 9:30 am
B) Between 9:30 am and 10:00 am
C) Not enough information
D) Between 8:30 am and 9:00 am
E) Between 8:00 am and 8:30 am
Unlock Deck
Unlock for access to all 81 flashcards in this deck.
Unlock Deck
k this deck
33
The value V of a historic vehicle can be modeled by V = 52500 + 2075 t where t represents the age of the vehicle above 35 years. What is the value of the vehicle when it is 50 years old?
A) $52500
B) $125125
C) $83625
D) $156250
E) $21375
A) $52500
B) $125125
C) $83625
D) $156250
E) $21375
Unlock Deck
Unlock for access to all 81 flashcards in this deck.
Unlock Deck
k this deck
34
The table below describes the average temperatures for Portland, OR during a given year. What was the average temperature for May?
A) 73
B) 81
C) 68
D) 42
E) 60
A) 73
B) 81
C) 68
D) 42
E) 60
Unlock Deck
Unlock for access to all 81 flashcards in this deck.
Unlock Deck
k this deck
35
The mass of bacteria (in micrograms) in a Petri dish for different times is shown in the table below. What is the mass of the bacteria (in mcg) at 9:30 am?
A) 61.89
B) 75.79
C) 50.60
D) 1.5
E) 31.08
A) 61.89
B) 75.79
C) 50.60
D) 1.5
E) 31.08
Unlock Deck
Unlock for access to all 81 flashcards in this deck.
Unlock Deck
k this deck
36
The mass of bacteria (in micrograms) in a Petri dish for different times is shown in the table below. By how much did the bacteria grow from 8:30 am to 10:30 am?
A) 73.18
B) 51.35
C) 38.80
D) 34.38
E) 2
A) 73.18
B) 51.35
C) 38.80
D) 34.38
E) 2
Unlock Deck
Unlock for access to all 81 flashcards in this deck.
Unlock Deck
k this deck
37
Given the data below, how can you determine if the set of data has a linear model?
A) By verifying that the salary values increases when the number of years increases.
B) Not enough information
C) By verifying that the first differences of the salary values are constant for successive increases in the number of years.
D) By verifying that the salary increases by the same amount.
E) By verifying that the number of years increases by the same amount.
A) By verifying that the salary values increases when the number of years increases.
B) Not enough information
C) By verifying that the first differences of the salary values are constant for successive increases in the number of years.
D) By verifying that the salary increases by the same amount.
E) By verifying that the number of years increases by the same amount.
Unlock Deck
Unlock for access to all 81 flashcards in this deck.
Unlock Deck
k this deck
38
The following table shows data for the cost of humidifiers based on the number of humidifiers produced. Find a linear model for the cost C of producing x humidifiers.
A) C = 1.05 + 87 x
B) C = 1.05 x
C) C = 87 + 1.05 x
D) C = 87 + 20 x
E) C = 87 x
A) C = 1.05 + 87 x
B) C = 1.05 x
C) C = 87 + 1.05 x
D) C = 87 + 20 x
E) C = 87 x
Unlock Deck
Unlock for access to all 81 flashcards in this deck.
Unlock Deck
k this deck
39
The number of gallons of water remaining in a pool t hours after it began to drain is illustrated in the table below.
Which one of the following models this data?
A) N = 1750 350 t
B) N = 22500 + 1750 t
C) N = 22500 + 350 t
D) N = 22500 350 t
E) N = 22500 1750 t
Which one of the following models this data?
A) N = 1750
350 tB) N = 22500 + 1750 t
C) N = 22500 + 350 t
D) N = 22500
350 tE) N = 22500
1750 t Unlock Deck
Unlock for access to all 81 flashcards in this deck.
Unlock Deck
k this deck
40
Using the table below, determine the value for the blank.
A) 24
B) 21
C) 28
D) 23
E) 27
A) 24
B) 21
C) 28
D) 23
E) 27
Unlock Deck
Unlock for access to all 81 flashcards in this deck.
Unlock Deck
k this deck
41
Which one of the following graphs represent the function:
A)
B)
C) None of these options.
D)
E)
A)
B)
C) None of these options.
D)
E)
Unlock Deck
Unlock for access to all 81 flashcards in this deck.
Unlock Deck
k this deck
42
A ball is thrown straight upward from a bridge and then falls all the way to the ground (past the bridge). The ball s height h (in feet) above the ground t seconds after the ball is thrown is given by h(t) = 16 t + 48 t + 111. What is the meaning of h (2)?
A) After 2 seconds, the height of the ball is 175 feet above ground.
B) After 2 seconds, the height of the ball is 143 feet above ground.
C) After 2 seconds, the height of the ball is 111 feet above ground.
D) After 2 seconds, the height of the ball is 32 feet above ground.
E) After 2 seconds, the height of the ball is 817 feet above ground.
16 t + 48 t + 111. What is the meaning of h (2)?A) After 2 seconds, the height of the ball is 175 feet above ground.
B) After 2 seconds, the height of the ball is 143 feet above ground.
C) After 2 seconds, the height of the ball is 111 feet above ground.
D) After 2 seconds, the height of the ball is 32 feet above ground.
E) After 2 seconds, the height of the ball is 817 feet above ground.
Unlock Deck
Unlock for access to all 81 flashcards in this deck.
Unlock Deck
k this deck
43
Given the table below, find the net change in the variable y as x changes from 2 to 4?
A) -9
B) 2
C) 9
D) 6
E) -3
A) -9
B) 2
C) 9
D) 6
E) -3
Unlock Deck
Unlock for access to all 81 flashcards in this deck.
Unlock Deck
k this deck
44
A population of rabbits was tracked over a 55-day period. The data is shown in the following graph. What was the maximum number of rabbits during this time period?
A) 61
B) 49
C) 38
D) 15
E) 83
A) 61
B) 49
C) 38
D) 15
E) 83
Unlock Deck
Unlock for access to all 81 flashcards in this deck.
Unlock Deck
k this deck
45
Consider the function f(x) = 4 x 7. What is the name of the function? What is the input? What is the output?
A) Name: f ; Input: x ; Output: 4 x 7
B) Name: f(x) ; Input: x ; Output: 4 x 7
C) Name: f(x) ; Input: 4 x 7; Output: x
D) Name: f(x) ; Input: x ; Output: f
E) Name: f ; Input: 4 x 7; Output: x
7. What is the name of the function? What is the input? What is the output?A) Name: f ; Input: x ; Output: 4 x
7B) Name: f(x) ; Input: x ; Output: 4 x
7C) Name: f(x) ; Input: 4 x
7; Output: xD) Name: f(x) ; Input: x ; Output: f
E) Name: f ; Input: 4 x
7; Output: x Unlock Deck
Unlock for access to all 81 flashcards in this deck.
Unlock Deck
k this deck
46
Find the domain of .
A)
B)
C)
D)
E)
.A)
B)
C)
D)
E)
Unlock Deck
Unlock for access to all 81 flashcards in this deck.
Unlock Deck
k this deck
47
A ball is thrown straight upward from a bridge and then falls all the way to the ground (past the bridge). The ball s height h (in feet) above the ground t seconds after the ball is thrown is given by h(t) = 16 t + 48 t + 111. Find the net change in the height of the ball from time t = 1 seconds to t = 4 seconds.
A) 96 feet
B) 47 feet
C) -143 feet
D) -96 feet
E) 3 feet
16 t + 48 t + 111. Find the net change in the height of the ball from time t = 1 seconds to t = 4 seconds.A) 96 feet
B) 47 feet
C) -143 feet
D) -96 feet
E) 3 feet
Unlock Deck
Unlock for access to all 81 flashcards in this deck.
Unlock Deck
k this deck
48
Determine the domain and range of the function represented by the graph.
A) Domain: ; Range:
B) Domain: ; Range:
C) Domain: ; Range:
D) Domain: ; Range:
E) Domain: ; Range:
A) Domain:
; Range: B) Domain:
; Range: C) Domain:
; Range: D) Domain:
; Range: E) Domain:
; Range: Unlock Deck
Unlock for access to all 81 flashcards in this deck.
Unlock Deck
k this deck
49
Let f(x) = 3 x + 4 x 4. Find f ( 4).
A) 48
B) -32
C) 32
D) 28
E) -68
+ 4 x 4. Find f ( 4).A) 48
B) -32
C) 32
D) 28
E) -68
Unlock Deck
Unlock for access to all 81 flashcards in this deck.
Unlock Deck
k this deck
50
The temperature (in ° F) of a town is taken at the beginning of each hour throughout one day starting at 5 a.m. Let T be the function defined by T(x) = temperature of the town at time x . Which one of the following graphs represents this scenario?
A)
B) Not enough information
C)
D)
E)
A)
B) Not enough information
C)
D)
E)
Unlock Deck
Unlock for access to all 81 flashcards in this deck.
Unlock Deck
k this deck
51
Use the following graph to create an algebra model for the function.
A)
B)
C)
D)
E)
A)
B)
C)
D)
E)
Unlock Deck
Unlock for access to all 81 flashcards in this deck.
Unlock Deck
k this deck
52
Which one of the following best describes the function ?
A) The rule h is "divide the input by 4 and subtract 1, then multiply by 6."
B) The rule h is "multiply the input by 6 and subtract 1, then divide by 4."
C) The rule h is "multiply the input by 6 and divide by 4, then subtract 1."
D) The rule h is "divide 6 by 4 and multiply by the input, then subtract 1."
E) The rule h is "subtract 1 from the input and multiply by 6, then divide by 4."
?A) The rule h is "divide the input by 4 and subtract 1, then multiply by 6."
B) The rule h is "multiply the input by 6 and subtract 1, then divide by 4."
C) The rule h is "multiply the input by 6 and divide by 4, then subtract 1."
D) The rule h is "divide 6 by 4 and multiply by the input, then subtract 1."
E) The rule h is "subtract 1 from the input and multiply by 6, then divide by 4."
Unlock Deck
Unlock for access to all 81 flashcards in this deck.
Unlock Deck
k this deck
53
A membership to a local fitness club costs $29 per month. The membership includes 10 hours of use of the club. If you want to use the club more than 10 hours per month, it will cost an additional $1.55 per hour. Which of the following functions model this situation?
A)
B)
C)
D)
E)
A)
B)
C)
D)
E)
Unlock Deck
Unlock for access to all 81 flashcards in this deck.
Unlock Deck
k this deck
54
A population of rabbits was tracked over a 55-day period. The data is shown in the following graph. How did the population of rabbits change between day 3 and day 20?
A) The population of rabbits increased from approximately 5 rabbits to 83 rabbits.
B) The population of rabbits decreased from approximately 83 rabbits to 5 rabbits.
C) The population of rabbits increased from approximately 5 rabbits to 61 rabbits.
D) The population of rabbits was constant during this time period.
E) The population of rabbits decreased from approximately 61 rabbits to 5 rabbits.
Unlock Deck
Unlock for access to all 81 flashcards in this deck.
Unlock Deck
k this deck
55
A membership to a local fitness club costs $49 per month. The membership includes 20 hours of use of the club. If you want to use the club more than 20 hours per month, it will cost an additional $1.80 per hour. Let C represent the cost of the membership and x represent the number of hours of use of the club. Find and interpret .
A) The cost of 33 hours of use of the club per month is $49.00.
B) The cost of 33 hours of use of the club per month is $50.80.
C) The cost of 33 hours of use of the club per month is $108.40.
D) The cost of 33 hours of use of the club per month is $23.40.
E) The cost of 33 hours of use of the club per month is $72.40.
.A) The cost of 33 hours of use of the club per month is $49.00.
B) The cost of 33 hours of use of the club per month is $50.80.
C) The cost of 33 hours of use of the club per month is $108.40.
D) The cost of 33 hours of use of the club per month is $23.40.
E) The cost of 33 hours of use of the club per month is $72.40.
Unlock Deck
Unlock for access to all 81 flashcards in this deck.
Unlock Deck
k this deck
56
The distance d (in miles) that a car travels based on the amount of time t (in seconds) is given by the equation d = 3 t 2 t . What is the net change in distance d when the time t changes from 0 to 2 seconds?
A) 8 miles
B) 12 miles
C) 0 miles
D) 2 miles
E) 36 miles
2 t . What is the net change in distance d when the time t changes from 0 to 2 seconds?A) 8 miles
B) 12 miles
C) 0 miles
D) 2 miles
E) 36 miles
Unlock Deck
Unlock for access to all 81 flashcards in this deck.
Unlock Deck
k this deck
57
The cost of college tuition for 12 credit hours at a local college during 2000 to 2008 is shown in the table below. Find the net change in the cost of college tuition from 2000 to 2005 and state if the net change was an increase or decrease.
A) -195, decrease
B) 312, increase
C) -312, decrease
D) 195, increase
E) 39, increase
A) -195, decrease
B) 312, increase
C) -312, decrease
D) 195, increase
E) 39, increase
Unlock Deck
Unlock for access to all 81 flashcards in this deck.
Unlock Deck
k this deck
58
The verbal description below can be represented algebraically by which one of the following equations?
"To find the sales tax, take 7.5% of the purchase price."
A) y = 7.5 x, where y represents the sales tax and x represents the purchase price.
B) x = 0.075 y, where x represents the sales tax and y represents the purchase price.
C) y = 0.075 + x , where y represents the sales tax and x represents the purchase price.
D) y = 0.075 x, where y represents the sales tax and x represents the purchase price.
E) y = 7.5 + x, where y represents the sales tax and x represents the purchase price.
Unlock Deck
Unlock for access to all 81 flashcards in this deck.
Unlock Deck
k this deck
59
Which one of the following represents the graph of ?
A)
B)
C)
D)
E) None of the above
?A)
B)
C)
D)
E) None of the above
Unlock Deck
Unlock for access to all 81 flashcards in this deck.
Unlock Deck
k this deck
60
Given the table below, find the net change in the variable y as x changes from 1 to 4?
A) 8
B) 7
C) 6
D) 9
E) 0
A) 8
B) 7
C) 6
D) 9
E) 0
Unlock Deck
Unlock for access to all 81 flashcards in this deck.
Unlock Deck
k this deck
61
Find a function that models the volume V of a box with height x , length 6 x and width x + 8.
A) V(x) = (6 x )( x + 8)
B) V(x) = ( x + 6 x ) ( x + 8)
C) V(x) = x (6 x + x + 8)
D) V(x) = x (6 x )( x + 8)
E) V(x) = x + (6 x ) + ( x + 8)
A) V(x) = (6 x )( x + 8)
B) V(x) = ( x + 6 x ) ( x + 8)
C) V(x) = x (6 x + x + 8)
D) V(x) = x (6 x )( x + 8)
E) V(x) = x + (6 x ) + ( x + 8)
Unlock Deck
Unlock for access to all 81 flashcards in this deck.
Unlock Deck
k this deck
62
Find a function that models the area A of a rectangle whose length is 9 ft more than twice its width x .
A) A(x) = x (9 + 2 x )
B) A(x) = x (9 x + 2)
C) A(x) = (9 + 2) x
D) A(x) = x (9 + x )
E) A(x) = 9 + 2 x
A) A(x) = x (9 + 2 x )
B) A(x) = x (9 x + 2)
C) A(x) = (9 + 2) x
D) A(x) = x (9 + x )
E) A(x) = 9 + 2 x
Unlock Deck
Unlock for access to all 81 flashcards in this deck.
Unlock Deck
k this deck
63
For the function , find the local maximum value of f .
A) 1.6
B) -0.6
C) 0
D) 1
E) 0.25
, find the local maximum value of f . A) 1.6
B) -0.6
C) 0
D) 1
E) 0.25
Unlock Deck
Unlock for access to all 81 flashcards in this deck.
Unlock Deck
k this deck
64
For the function , find the intervals on which is increasing.
A)
B)
C)
D)
E)
, find the intervals on which is increasing. A)
B)
C)
D)
E)
Unlock Deck
Unlock for access to all 81 flashcards in this deck.
Unlock Deck
k this deck
65
Which of the following formulas express the average score for 4 exams?
A)
B)
C)
D)
E)
A)
B)
C)
D)
E)
Unlock Deck
Unlock for access to all 81 flashcards in this deck.
Unlock Deck
k this deck
66
The table below shows the salary values for a job based on the number of years x worked. Find a linear model for the salary value S(x) as a function of the number of years x worked.
A) S(x) = 3000 x
B) S(x) = 36000 + 1000 x
C) S(x) = 1000 x
D) S(x) = 36000 + 3000 x
E) S(x) = 33000 + 1000 x
A) S(x) = 3000 x
B) S(x) = 36000 + 1000 x
C) S(x) = 1000 x
D) S(x) = 36000 + 3000 x
E) S(x) = 33000 + 1000 x
Unlock Deck
Unlock for access to all 81 flashcards in this deck.
Unlock Deck
k this deck
67
Does the equation 3 x - 5 y = 4 define the variable y as a function of the variable x ?
Unlock Deck
Unlock for access to all 81 flashcards in this deck.
Unlock Deck
k this deck
68
A population of rabbits was tracked over a 55-day period. The data is shown in the following graph. What was the approximate number of rabbits on day 30?
A) 40
B) 15
C) 10
D) 30
E) 83
A) 40
B) 15
C) 10
D) 30
E) 83
Unlock Deck
Unlock for access to all 81 flashcards in this deck.
Unlock Deck
k this deck
69
Solve the equation for .
A)
B)
C)
D)
E)
for .A)
B)
C)
D)
E)
Unlock Deck
Unlock for access to all 81 flashcards in this deck.
Unlock Deck
k this deck
70
The amount of an investment A after 36 months can be modeled by the formula where P is the initial investment amount and r % is the interest rate. If Marcus invests $2000 in this account with an interest rate of 3.7500%, how much money will be in the account at the end of 36 months? (Rounded to the nearest hundredths)
A) $7,526.65
B) $2,006.25
C) $2000
D) $72,225.00
E) $2,237.75
where P is the initial investment amount and r % is the interest rate. If Marcus invests $2000 in this account with an interest rate of 3.7500%, how much money will be in the account at the end of 36 months? (Rounded to the nearest hundredths)A) $7,526.65
B) $2,006.25
C) $2000
D) $72,225.00
E) $2,237.75
Unlock Deck
Unlock for access to all 81 flashcards in this deck.
Unlock Deck
k this deck
71
The graphs of and are shown below. Find the value(s) of x for which .
A) -2.4 and 0.8
B) 0.8
C) -2.4 and -11.7
D) -2.4
E) -11.7 and 1.3
and are shown below. Find the value(s) of x for which . A) -2.4 and 0.8
B) 0.8
C) -2.4 and -11.7
D) -2.4
E) -11.7 and 1.3
Unlock Deck
Unlock for access to all 81 flashcards in this deck.
Unlock Deck
k this deck
72
Does the equation x = ( y 6) + 3 define the variable y as a function of the variable x ?
6) + 3 define the variable y as a function of the variable x ? Unlock Deck
Unlock for access to all 81 flashcards in this deck.
Unlock Deck
k this deck
73
Given the table below, is the variable y a function of the variable x ?
Unlock Deck
Unlock for access to all 81 flashcards in this deck.
Unlock Deck
k this deck
74
A membership to a local fitness club costs $59 per month plus $1.15 for each hour spent in the club. Find a linear model for the monthly cost of membership C(x) as a function of the number of hours x spent in the club.
A) C(x) = 59 x + 1.15
B) C(x) = 1.15 x
C) C(x) = 59 x
D) C(x) = 59 + 1.15 x
E) C(x) = (59 + 1.15 )x
A) C(x) = 59 x + 1.15
B) C(x) = 1.15 x
C) C(x) = 59 x
D) C(x) = 59 + 1.15 x
E) C(x) = (59 + 1.15 )x
Unlock Deck
Unlock for access to all 81 flashcards in this deck.
Unlock Deck
k this deck
75
Given the table below, is the variable y a function of the variable x ?
Unlock Deck
Unlock for access to all 81 flashcards in this deck.
Unlock Deck
k this deck
76
The graphs of and are shown below. Find the value(s) of x for which .
A)
B)
C)
D)
E)
and are shown below. Find the value(s) of x for which . A)
B)
C)
D)
E)
Unlock Deck
Unlock for access to all 81 flashcards in this deck.
Unlock Deck
k this deck
77
For the function , find the local minimum value of f .
A) -0.6
B) -0.185
C) -1
D) 1
E) 1.6
, find the local minimum value of f . A) -0.6
B) -0.185
C) -1
D) 1
E) 1.6
Unlock Deck
Unlock for access to all 81 flashcards in this deck.
Unlock Deck
k this deck
78
A population of rabbits was tracked over a 55-day period. The data is shown in the following graph. What was the minimum number of rabbits during this time?
A) 20
B) 37
C) 83
D) 5
E) 15
A) 20
B) 37
C) 83
D) 5
E) 15
Unlock Deck
Unlock for access to all 81 flashcards in this deck.
Unlock Deck
k this deck
79
The resistance R of a wire (in ohms) is related to its length L (in meters) and its diameter d (in meters) by the formula . Find a formula for d .
A)
B)
C)
D)
E)
. Find a formula for d .A)
B)
C)
D)
E)
Unlock Deck
Unlock for access to all 81 flashcards in this deck.
Unlock Deck
k this deck
80
Find a formula that models the speed s of a car that travels d miles in t minutes.
A)
B)
C)
D)
E)
A)
B)
C)
D)
E)
Unlock Deck
Unlock for access to all 81 flashcards in this deck.
Unlock Deck
k this deck
Unlock Deck
Unlock for access to all 81 flashcards in this deck.


