Deck 9: Modeling Data
Full screen (f)
Question
During the years 1994 to 2007 seat belt use among front seat passengers ages 16 to 24 has increased. A linear model for the percentage of these passengers who use a seat belt is  where P is percentage with a seat belt and t is years since 2000. The years before 2000 have a negative value for t. Use the model to predict the percentage of these passengers who used a seat belt in 1998.
A) 59.9%
B) 69.3%
C) 47.2%
where P is percentage with a seat belt and t is years since 2000. The years before 2000 have a negative value for t. Use the model to predict the percentage of these passengers who used a seat belt in 1998.A) 59.9%
B) 69.3%
C) 47.2%
Question
Question
Question
During the years 1994 to 2007 seat belt use among front seat passengers ages 16 to 24 has increased. A linear model for the percentage of these passengers who use a seat belt is  where P is percentage with a seat belt and t is years since 2000. The years before 2000 have a negative value for t. If you use the model to predict the percentage of these passengers who used a seat belt in 2017 which are you doing?
A) interpolation
B) extrapolation
where P is percentage with a seat belt and t is years since 2000. The years before 2000 have a negative value for t. If you use the model to predict the percentage of these passengers who used a seat belt in 2017 which are you doing?A) interpolation
B) extrapolation
Question
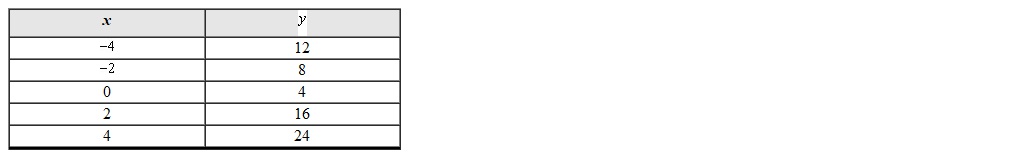
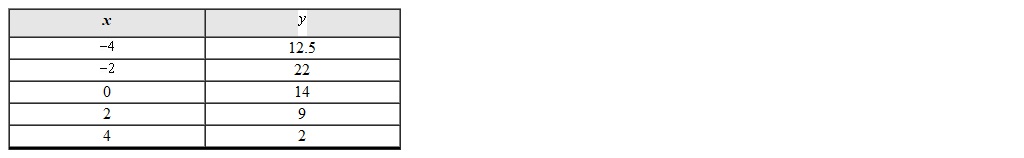
Given the data set choose its scatterplot. Are the data approximately linear? 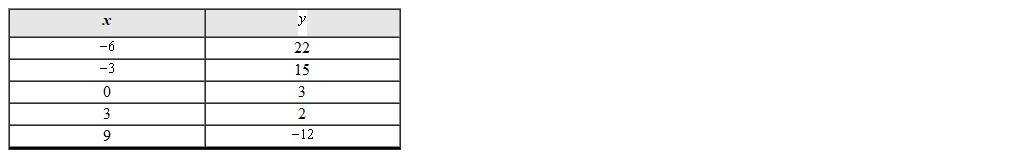
A) linear
B)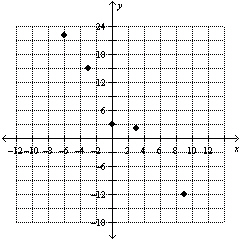 not linear
C)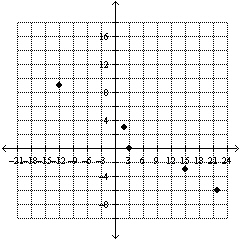 linear
D) not linear
A)
linearB)
not linearC)
linearD)
not linear Question
During the years 1994 to 2007 seat belt use among front seat passengers ages 16 to 24 has increased. A linear model for the percentage of these passengers who use a seat belt is 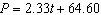 where P is percentage with a seat belt and t is years since 2000. The years before 2000 have a negative value for t. What is the slope of the model and what does it mean in terms of the problem?
A) 2.33. Every year seat belt use goes down 2.33.
B) 2.33. Every year seat belt use goes down 2.33%
C) 2.33. Every year seat belt use goes up 2.33%
D) 64.60. Seat belt use started at 64.60%
where P is percentage with a seat belt and t is years since 2000. The years before 2000 have a negative value for t. What is the slope of the model and what does it mean in terms of the problem?A) 2.33. Every year seat belt use goes down 2.33.
B) 2.33. Every year seat belt use goes down 2.33%
C) 2.33. Every year seat belt use goes up 2.33%
D) 64.60. Seat belt use started at 64.60%
Question
Decide which line fits the data best.
A)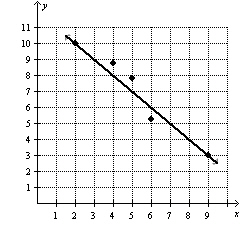
B)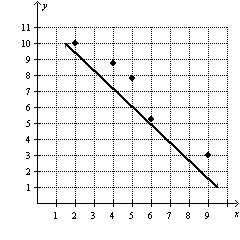
A)
B)
Question
Given the data set choose its scatterplot. Are the data approximately linear? 
A)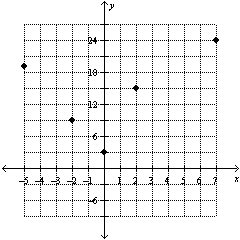 linear
B) not linear
C)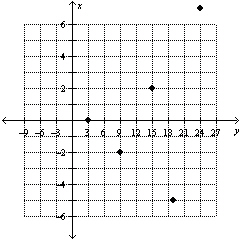 linear
D) not linear
A)
linearB)
not linearC)
linearD)
not linear Question
Question
During the years 1994 to 2007 seat belt use among front seat passengers ages 16 to 24 has increased. A linear model for the percentage of these passengers who use a seat belt is  where P is percentage with a seat belt and t is years since 2000. The years before 2000 have a negative value for t. If you use the model to predict the percentage of these passengers who used a seat belt in 2006 which are you doing?
A) interpolation
B) extrapolation
where P is percentage with a seat belt and t is years since 2000. The years before 2000 have a negative value for t. If you use the model to predict the percentage of these passengers who used a seat belt in 2006 which are you doing?A) interpolation
B) extrapolation
Question
Decide which line fits the data best.
A)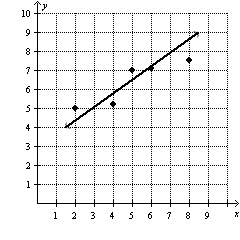
B)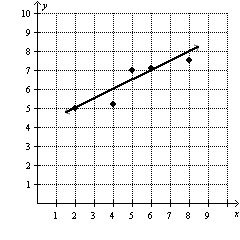
A)
B)
Question
Question
The percentage of eighth grade students P participating in school music or performing arts in the years from 1996 to 2006 may be modeled by  where t is years since 1996. Use the model to predict the percentage participation in 2020. Is this interpolation or extrapolation?
A) 74.69% interpolation
B) 74.69% extrapolation
C) 39.05% interpolation
D) 39.05% extrapolation
where t is years since 1996. Use the model to predict the percentage participation in 2020. Is this interpolation or extrapolation?A) 74.69% interpolation
B) 74.69% extrapolation
C) 39.05% interpolation
D) 39.05% extrapolation
Question
The percentage of eighth grade students P participating in school music or performing arts in the years from 1996 to 2006 may be modeled by  where t is years since 1996. Use the model to predict the percentage participation in 2000. Is this interpolation or extrapolation?
A) 52.65% interpolation
B) 52.65% extrapolation
C) 58.09% interpolation
D) 58.09% extrapolation
where t is years since 1996. Use the model to predict the percentage participation in 2000. Is this interpolation or extrapolation?A) 52.65% interpolation
B) 52.65% extrapolation
C) 58.09% interpolation
D) 58.09% extrapolation
Question
During the years 1994 to 2007 seat belt use among front seat passengers ages 16 to 24 has increased. A linear model for the percentage of these passengers who use a seat belt is  where P is percentage with a seat belt and t is years since 2000. The years before 2000 have a negative value for t. Use the model to predict the percentage of these passengers who used a seat belt in 2017.
A) 10.4%
B) 100%
C) 104.2%
where P is percentage with a seat belt and t is years since 2000. The years before 2000 have a negative value for t. Use the model to predict the percentage of these passengers who used a seat belt in 2017.A) 10.4%
B) 100%
C) 104.2%
Question
The percentage of eighth grade students P participating in school music or performing arts in the years from 1996 to 2006 may be modeled by  where t is years since 1996. What is the vertical intercept in the model? What does it mean?
A) participation started at 55.37% in 1996
B) participation goes up 55.37% each year since 1996
C) participation will be zero in 2081
D) participation will be zero in 2077
where t is years since 1996. What is the vertical intercept in the model? What does it mean?A)
participation started at 55.37% in 1996B)
participation goes up 55.37% each year since 1996C)
participation will be zero in 2081D)
participation will be zero in 2077 Question
The percentage of eighth grade students P participating in school music or performing arts in the years from 1996 to 2006 may be modeled by  where t is years since 1996. What is the horizontal intercept in the model? What does it mean? Is this extrapolation?
A) participation started at 55.37% in 1996. not extrapolation
B) participation goes up 55.37% each year since 1996. not extrapolation.
C) participation will be zero in 2081. extrapolation
D) participation will be zero in 2077. extrapolation
where t is years since 1996. What is the horizontal intercept in the model? What does it mean? Is this extrapolation?A)
participation started at 55.37% in 1996. not extrapolationB)
participation goes up 55.37% each year since 1996. not extrapolation.C)
participation will be zero in 2081. extrapolationD)
participation will be zero in 2077. extrapolation Question
During the years 1994 to 2007 seat belt use among front seat passengers ages 16 to 24 has increased. A linear model for the percentage of these passengers who use a seat belt is  where P is percentage with a seat belt and t is years since 2000. The years before 2000 have a negative value for t. Use the model to predict the percentage of these passengers who used a seat belt in 2005.
A) 75%
B) 76.3%
C) 47.4%
where P is percentage with a seat belt and t is years since 2000. The years before 2000 have a negative value for t. Use the model to predict the percentage of these passengers who used a seat belt in 2005.A) 75%
B) 76.3%
C) 47.4%
Question
The percentage of eighth grade students P participating in school music or performing arts in the years from 1996 to 2006 may be modeled by 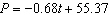 where t is years since 1996. What is the slope in the model? What does it mean?
A) participation started at 68% in 1996
B) participation goes up 68% each year since 1996
C) participation goes up 0.68% each year since 1996
D) participation goes down 0.68% each year since 1996
where t is years since 1996. What is the slope in the model? What does it mean?A)
participation started at 68% in 1996B)
participation goes up 68% each year since 1996C)
participation goes up 0.68% each year since 1996D)
participation goes down 0.68% each year since 1996 Question
During the years 1994 to 2007 seat belt use among front seat passengers ages 16 to 24 has increased. A linear model for the percentage of these passengers who use a seat belt is  where P is percentage with a seat belt and t is years since 2000. The years before 2000 have a negative value for t. What is the vertical intercept of the model and what does it mean in terms of the problem?
A) . In the year 1994 seat belt use was 64.60.
B) . In the year 2000 seat belt use was 64.60.
C) 2.33. Every year seat belt use goes up 2.33%
D) . In the year 2000 seat belt use was 64.60%.
where P is percentage with a seat belt and t is years since 2000. The years before 2000 have a negative value for t. What is the vertical intercept of the model and what does it mean in terms of the problem?A)
. In the year 1994 seat belt use was 64.60.B)
. In the year 2000 seat belt use was 64.60.C) 2.33. Every year seat belt use goes up 2.33%
D)
. In the year 2000 seat belt use was 64.60%. Question
The percentage P of 6 to 11 year old children in the U.S. who are overweight may be modeled by the equation  where t is years since 1980. What is the horizontal intercept of this model? Round to one decimal place. What does it mean for this application?
where t is years since 1980. What is the horizontal intercept of this model? Round to one decimal place. What does it mean for this application? Question
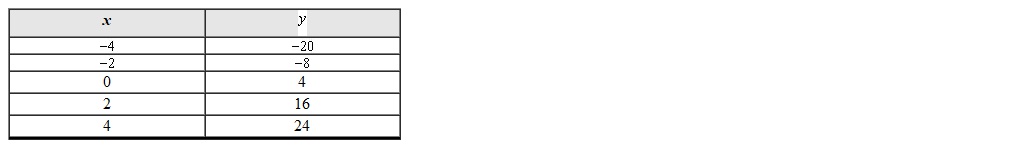
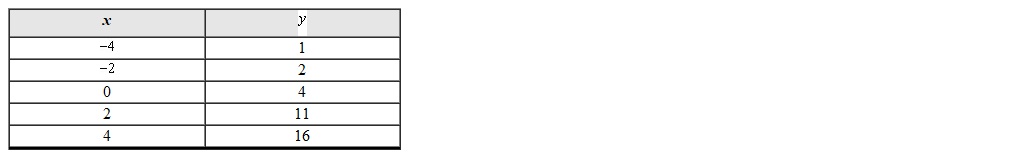
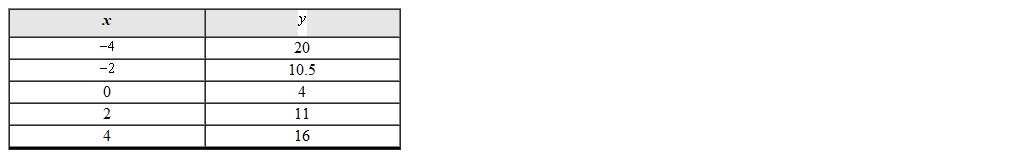
Given the data set draw a scatterplot. Clearly label and scale the axes. Does the data set follow a linear pattern a parabolic pattern or neither? 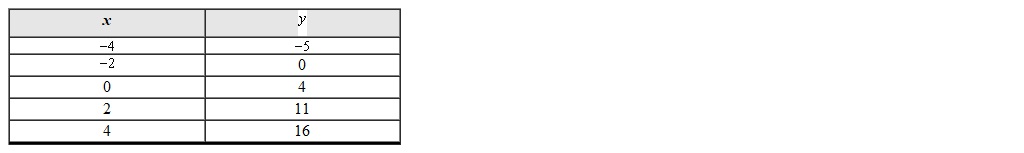
A) linear
B) parabolic
C)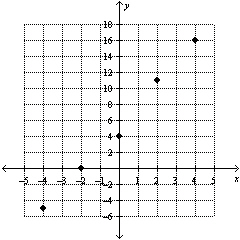 neither
D)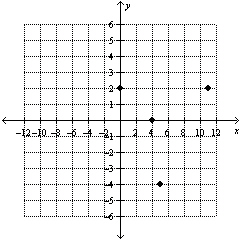 parabolic
A)
linearB)
parabolicC)
neitherD)
parabolic Question
Given the data set draw a scatterplot. Clearly label and scale the axes. Are the data approximately linear?
Question
The percentage P of 6 to 11 year old children in the U.S. who are overweight may be modeled by the equation  where t is years since 1980. Use the model to predict the percentage of 6 to 11 year old U.S. children who were overweight in 2000.
where t is years since 1980. Use the model to predict the percentage of 6 to 11 year old U.S. children who were overweight in 2000. Question
During the years 2002 to 2008 smoking among twelfth grade students was declining. A linear model for the percentage of twelfth grade students who smoke is  . P is the percentage of twelfth graders who smoke and t is years since 2002. Find the vertical intercept of the model and explain its value in terms of the problem.
. P is the percentage of twelfth graders who smoke and t is years since 2002. Find the vertical intercept of the model and explain its value in terms of the problem. Question
The Supplemental Nutrition Assistance Program (SNAP) to provide food assistance has increased the number of participants in millions in the years from 2000 to 2008. Let P be the number of participants in millions and t be years since 2000. The following linear model fits the data:  . What is the horizontal intercept? Explain its value in terms of the problem if any.
. What is the horizontal intercept? Explain its value in terms of the problem if any. Question
The Supplemental Nutrition Assistance Program (SNAP) to provide food assistance has increased the number of participants in millions in the years from 2000 to 2008. Let P be the number of participants in millions and t be years since 2000. The following linear model fits the data: 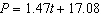 . Use the model to estimate the number of participants in SNAP in 2015. Is this interpolation or extrapolation?
. Use the model to estimate the number of participants in SNAP in 2015. Is this interpolation or extrapolation? Question
The Supplemental Nutrition Assistance Program (SNAP) to provide food assistance has increased the number of participants in millions in the years from 2000 to 2008. Let P be the number of participants in millions and t be years since 2000. The following linear model fits the data:  . What is the vertical intercept? Explain its value in terms of the problem.
. What is the vertical intercept? Explain its value in terms of the problem. Question
The Supplemental Nutrition Assistance Program (SNAP) to provide food assistance has increased the number of participants in millions in the years from 2000 to 2008. Let P be the number of participants in millions and t be years since 2000. The following linear model fits the data:  . Use the model to estimate the number of participants in SNAP in 2003. Is this interpolation or extrapolation?
. Use the model to estimate the number of participants in SNAP in 2003. Is this interpolation or extrapolation? Question
The Supplemental Nutrition Assistance Program (SNAP) to provide food assistance has increased the number of participants in millions in the years from 2000 to 2008. Let P be the number of participants in millions and t be years since 2000. The following linear model fits the data:  . What is the slope? Explain its value in terms of the problem.
. What is the slope? Explain its value in terms of the problem. Question
Given the data set draw a scatterplot. Clearly label and scale the axes. Are the data approximately linear?
Question
During the years 2002 to 2008 smoking among twelfth grade students was declining. A linear model for the percentage of twelfth grade students who smoke is  . P is the percentage of twelfth graders who smoke and t is years since 2002. Find the horizontal intercept of the model and explain its value in terms of the problem. Is this reasonable?
. P is the percentage of twelfth graders who smoke and t is years since 2002. Find the horizontal intercept of the model and explain its value in terms of the problem. Is this reasonable? Question
During the years 2002 to 2008 smoking among twelfth grade students was declining. A linear model for the percentage of twelfth grade students who smoke is  . P is the percentage of twelfth graders who smoke and t is years since 2002. Use the model to predict the percentage of twelfth grade students who smoke in 2020. Is this answer reasonable?
. P is the percentage of twelfth graders who smoke and t is years since 2002. Use the model to predict the percentage of twelfth grade students who smoke in 2020. Is this answer reasonable? Question
The population of the District of Columbia is given in the following table.
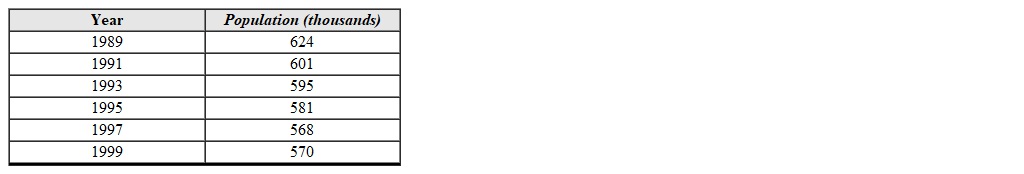 Draw a scatterplot and draw an eyeball best-fit line on the scatterplot.
Draw a scatterplot and draw an eyeball best-fit line on the scatterplot. Question
The percentage P of 6 to 11 year old children in the U.S. who are overweight may be modeled by the equation  where t is years since 1980. What is the vertical intercept of this model? What does it mean for this application?
where t is years since 1980. What is the vertical intercept of this model? What does it mean for this application? Question
The percentage P of 6 to 11 year old children in the U.S. who are overweight may be modeled by the equation  where t is years since 1980. Use the model to predict the percentage of 6 to 11 year old U.S. children who will be overweight in 2020. Is this estimate reasonable?
where t is years since 1980. Use the model to predict the percentage of 6 to 11 year old U.S. children who will be overweight in 2020. Is this estimate reasonable? Question
During the years 2002 to 2008 smoking among twelfth grade students was declining. A linear model for the percentage of twelfth grade students who smoke is  . P is the percentage of twelfth graders who smoke and t is years since 2002. Use the model to predict the percentage of twelfth grade students who smoke in 2010. Is this answer reasonable?
. P is the percentage of twelfth graders who smoke and t is years since 2002. Use the model to predict the percentage of twelfth grade students who smoke in 2010. Is this answer reasonable? Question
The population of Florida is given in the following table.
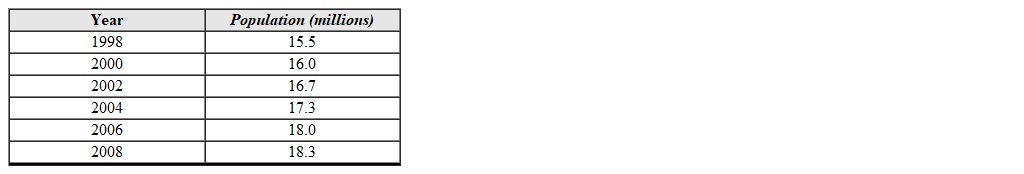 Draw a scatterplot and draw an eyeball best-fit line on the scatterplot.
Draw a scatterplot and draw an eyeball best-fit line on the scatterplot. Question
Given the data set draw a scatterplot. Clearly label and scale the axes. Are the data approximately linear?

Question
During the years 2002 to 2008 smoking among twelfth grade students was declining. A linear model for the percentage of twelfth grade students who smoke is 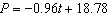 . P is the percentage of twelfth graders who smoke and t is years since 2002. Find the slope of the model and explain the value of the slope in terms of the problem. Is percentage of twelfth graders who smoke going up or down over time?
. P is the percentage of twelfth graders who smoke and t is years since 2002. Find the slope of the model and explain the value of the slope in terms of the problem. Is percentage of twelfth graders who smoke going up or down over time? Question
The average profit in dollars A that your baking business makes when baking n cakes is given by  . Find and explain the vertex.
A) If you make 44 cakes you maximize your profit at $484.
B) If you make 44 cakes you minimize your profit at $484.
C) If you make 88 cakes you make no profit.
. Find and explain the vertex.A)
If you make 44 cakes you maximize your profit at $484.B)
If you make 44 cakes you minimize your profit at $484.C)
If you make 88 cakes you make no profit. Question
Given a quadratic model  where t is time the formula for the time of the vertex is
  __________.
where t is time the formula for the time of the vertex is __________. Question
A quadratic model for the median price of a condo is given by 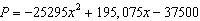 . The variable x is the years since 2000. Use the model to predict the median price of a condo in 2005.
A) $300000
B) $195075
C) $305500
. The variable x is the years since 2000. Use the model to predict the median price of a condo in 2005.A) $300000
B) $195075
C) $305500
Question
The graph shows the average monthly high temperature in Newark NJ for months from November to April. If a quadratic model  is fit to the graphed data set will a be positive or negative?
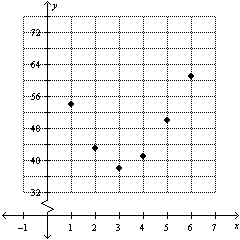
A) positive
B) negative
is fit to the graphed data set will a be positive or negative? A) positive
B) negative
Question
The graph shows the average monthly high temperature in Newark NJ for months from April to September. If a quadratic model  is fit to the graphed data set will a be positive or negative?
A) positive
B) negative
is fit to the graphed data set will a be positive or negative? A) positive
B) negative
Question
The average profit in dollars A that your baking business makes when baking n cakes is given by  . How many cakes rounded to whole numbers should you bake in order to have a profit of $300?
A) 71 cakes
B) 17 cakes
C) 17 or 71 cakes
. How many cakes rounded to whole numbers should you bake in order to have a profit of $300?A) 71 cakes
B) 17 cakes
C) 17 or 71 cakes
Question
Given the data set draw a scatterplot. Clearly label and scale the axes. Does the data set follow a linear pattern a parabolic pattern or neither?
Question
The graph shows the average monthly high temperature in Newark NJ for months from November to April. If a quadratic model  is fit to the graphed data set estimate the coordinates of the vertex.
A)
B)
C)
D)
is fit to the graphed data set estimate the coordinates of the vertex. A)
B)
C)
D)
Question
The graph shows the average monthly high temperature in Newark NJ for months from April to September. If a quadratic model  is fit to the graphed data set estimate the coordinates of the vertex.
A)
B)
C)
D)
is fit to the graphed data set estimate the coordinates of the vertex. A)
B)
C)
D)
Question
Given the data set draw a scatterplot. Clearly label and scale the axes. Does the data set follow a linear pattern a parabolic pattern or neither? 
A) linear
B)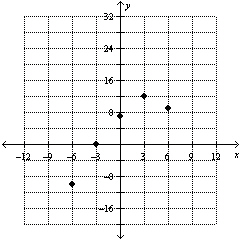 parabolic
C) neither
D)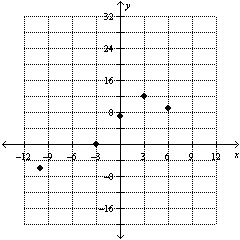 parabolic
A)
linearB)
parabolicC)
neitherD)
parabolic Question
The graph shows the average monthly high temperature in Newark NJ for months from April to September. Does the graph follow a linear pattern quadratic pattern or neither? 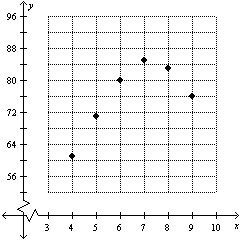
A) linear
B) quadratic
C) neither
A) linear
B) quadratic
C) neither
Question
You are given a quadratic model  where t is time. If a is __________ the vertex identifies the minimum point.
where t is time. If a is __________ the vertex identifies the minimum point. Question
You are given a quadratic model  where t is time. If a is negative the vertex identifies the __________ point.
where t is time. If a is negative the vertex identifies the __________ point. Question
The average profit in dollars A that your baking business makes when baking n cakes is given by  . Find and explain the vertical intercept.
A) If you make 88 cakes you make no profit.
B) If you make 88 cakes you maximize your profit.
C) If you make no cakes you make no profit.
. Find and explain the vertical intercept.A)
If you make 88 cakes you make no profit.B)
If you make 88 cakes you maximize your profit.C)
If you make no cakes you make no profit. Question
A quadratic model for the median price of a condo is given by  . The variable x is the years since 2000. Find the vertex of the model. Explain it in this problem.
A) At the end of 2000 the median price is $338604.
B) At the end of 2003 the median price is $338604.
C) At the end of 2004 the median price is $338604.
. The variable x is the years since 2000. Find the vertex of the model. Explain it in this problem.A)
At the end of 2000 the median price is $338604.B)
At the end of 2003 the median price is $338604.C)
At the end of 2004 the median price is $338604. Question
Given the data set draw a scatterplot. Clearly label and scale the axes. Does the data set follow a linear pattern a parabolic pattern or neither?
Question
The graph shows the average monthly high temperature in Newark NJ for months from November to April. Does the data graphed follow a linear pattern a parabolic pattern or neither? 
A) linear
B) parabolic
C) neither
A) linear
B) parabolic
C) neither
Question
Question
Given the data set draw a scatterplot. Clearly label and scale the axes. Does the data set follow a linear pattern a parabolic pattern or neither?
Question
The average profit in dollars A that your baking business makes when baking n cakes is given by  . Find and explain the horizontal intercept(s).
A) If you make no cakes you make no profit.
B) If you make 44 cakes you minimize your profit at $484.
C) and
and  If you make either 0 or 88 cakes you make no profit.
. Find and explain the horizontal intercept(s).A)
If you make no cakes you make no profit.B)
If you make 44 cakes you minimize your profit at $484.C)
and If you make either 0 or 88 cakes you make no profit. Question
If a quadratic model  is fit to the graphed data set will a be positive or negative?
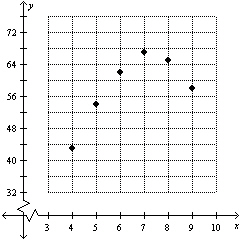
is fit to the graphed data set will a be positive or negative? Question
You have moved to Chicago in the fall. The graph shows the average monthly high temperature for months since you moved to Chicago. If a quadratic model  is fit to the graphed data set will a be positive or negative?
is fit to the graphed data set will a be positive or negative? Question
The average profit in dollars A that your baking business makes when baking n pies is given by  . Find and explain the vertical intercept.
. Find and explain the vertical intercept. Question
A quadratic model for the median home price in Tampa Florida is given by  . The variable x is the years since 2000. Find the vertex of the model. Explain it in this problem.
. The variable x is the years since 2000. Find the vertex of the model. Explain it in this problem. Question
The profit in dollars A that your baking business makes when baking n pies is given by  . Find the number of pies you must sell to have a profit of $300. Round to whole number(s).
. Find the number of pies you must sell to have a profit of $300. Round to whole number(s). Question
Does the data graphed follow a linear pattern a parabolic pattern or neither? 
Question
The profit in dollars A that your baking business makes when baking n pies is given by  . Find and explain the vertex.
. Find and explain the vertex. Question
You have moved to Chicago in the fall. The graph shows the average monthly high temperature for months since you moved to Chicago. A quadratic model for this data is  where y is the average monthly high temperature and x is months after you moved to Chicago. Use the model to predict the lowest average monthly high temperature. Round to the nearest month to make this estimate. Round to one decimal place.
where y is the average monthly high temperature and x is months after you moved to Chicago. Use the model to predict the lowest average monthly high temperature. Round to the nearest month to make this estimate. Round to one decimal place. Question
If a quadratic model  is fit to the graphed data set estimate the coordinates of the vertex.
is fit to the graphed data set estimate the coordinates of the vertex. Question
You have moved to Chicago in the fall. The graph shows the average monthly high temperature for months since you moved to Chicago. A quadratic model for this data is  where y is the average monthly high temperature and x is months after you moved to Chicago. Use the model to predict the average monthly high temperature 2 months after you moved to Chicago.
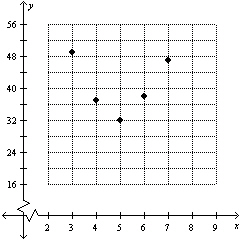
where y is the average monthly high temperature and x is months after you moved to Chicago. Use the model to predict the average monthly high temperature 2 months after you moved to Chicago. Question
You have moved to Chicago in the fall. The graph shows the average monthly high temperature for months since you moved to Chicago. A quadratic model for this data is  where y is the average monthly high temperature and x is months after you moved to Chicago. Use the model to predict the average monthly high temperature 8 months after you moved to Chicago. Round to one decimal place.
where y is the average monthly high temperature and x is months after you moved to Chicago. Use the model to predict the average monthly high temperature 8 months after you moved to Chicago. Round to one decimal place. Question
You have moved to Chicago in the fall. The graph shows the average monthly high temperature for months since you moved to Chicago. Does the graph show a linear pattern a quadratic pattern or neither? 
Question
A quadratic model for the median home price in Tampa Florida is given by  . The variable x is the years since 2000. Use the model to predict the median home price in the year 2008.
. The variable x is the years since 2000. Use the model to predict the median home price in the year 2008. Question
You have moved to Chicago in the fall. The graph shows the average monthly high temperature for months since you moved to Chicago. If a quadratic model  is fit to the graphed data set estimate the coordinates of the vertex.
is fit to the graphed data set estimate the coordinates of the vertex. 
Unlock Deck
Sign up to unlock the cards in this deck!
Unlock Deck
Unlock Deck
1/74
Play
Full screen (f)
Deck 9: Modeling Data
1
During the years 1994 to 2007 seat belt use among front seat passengers ages 16 to 24 has increased. A linear model for the percentage of these passengers who use a seat belt is where P is percentage with a seat belt and t is years since 2000. The years before 2000 have a negative value for t. Use the model to predict the percentage of these passengers who used a seat belt in 1998.
A) 59.9%
B) 69.3%
C) 47.2%
where P is percentage with a seat belt and t is years since 2000. The years before 2000 have a negative value for t. Use the model to predict the percentage of these passengers who used a seat belt in 1998.A) 59.9%
B) 69.3%
C) 47.2%
59.9%
2
If the prediction of the output value that you make based on the model is not possible or not reasonable __________ __________ occurred.
model breakdown
3
When you estimate an output value for an input value that is within the data input values by using the model you are doing __________.
interpolation
4
During the years 1994 to 2007 seat belt use among front seat passengers ages 16 to 24 has increased. A linear model for the percentage of these passengers who use a seat belt is where P is percentage with a seat belt and t is years since 2000. The years before 2000 have a negative value for t. If you use the model to predict the percentage of these passengers who used a seat belt in 2017 which are you doing?
A) interpolation
B) extrapolation
where P is percentage with a seat belt and t is years since 2000. The years before 2000 have a negative value for t. If you use the model to predict the percentage of these passengers who used a seat belt in 2017 which are you doing?A) interpolation
B) extrapolation
Unlock Deck
Unlock for access to all 74 flashcards in this deck.
Unlock Deck
k this deck
5
Given the data set choose its scatterplot. Are the data approximately linear?
A) linear
B) not linear
C) linear
D) not linear
A)
linearB)
not linearC)
linearD)
not linear Unlock Deck
Unlock for access to all 74 flashcards in this deck.
Unlock Deck
k this deck
6
During the years 1994 to 2007 seat belt use among front seat passengers ages 16 to 24 has increased. A linear model for the percentage of these passengers who use a seat belt is where P is percentage with a seat belt and t is years since 2000. The years before 2000 have a negative value for t. What is the slope of the model and what does it mean in terms of the problem?
A) 2.33. Every year seat belt use goes down 2.33.
B) 2.33. Every year seat belt use goes down 2.33%
C) 2.33. Every year seat belt use goes up 2.33%
D) 64.60. Seat belt use started at 64.60%
where P is percentage with a seat belt and t is years since 2000. The years before 2000 have a negative value for t. What is the slope of the model and what does it mean in terms of the problem?A) 2.33. Every year seat belt use goes down 2.33.
B) 2.33. Every year seat belt use goes down 2.33%
C) 2.33. Every year seat belt use goes up 2.33%
D) 64.60. Seat belt use started at 64.60%
Unlock Deck
Unlock for access to all 74 flashcards in this deck.
Unlock Deck
k this deck
7
Decide which line fits the data best.
A)
B)
A)
B)
Unlock Deck
Unlock for access to all 74 flashcards in this deck.
Unlock Deck
k this deck
8
Given the data set choose its scatterplot. Are the data approximately linear?
A) linear
B) not linear
C) linear
D) not linear
A)
linearB)
not linearC)
linearD)
not linear Unlock Deck
Unlock for access to all 74 flashcards in this deck.
Unlock Deck
k this deck
9
The __________ for a linear data set is the equation of the line which is the best fit for the data.
Unlock Deck
Unlock for access to all 74 flashcards in this deck.
Unlock Deck
k this deck
10
During the years 1994 to 2007 seat belt use among front seat passengers ages 16 to 24 has increased. A linear model for the percentage of these passengers who use a seat belt is where P is percentage with a seat belt and t is years since 2000. The years before 2000 have a negative value for t. If you use the model to predict the percentage of these passengers who used a seat belt in 2006 which are you doing?
A) interpolation
B) extrapolation
where P is percentage with a seat belt and t is years since 2000. The years before 2000 have a negative value for t. If you use the model to predict the percentage of these passengers who used a seat belt in 2006 which are you doing?A) interpolation
B) extrapolation
Unlock Deck
Unlock for access to all 74 flashcards in this deck.
Unlock Deck
k this deck
11
Decide which line fits the data best.
A)
B)
A)
B)
Unlock Deck
Unlock for access to all 74 flashcards in this deck.
Unlock Deck
k this deck
12
When you estimate an output value for an input value that is outside the data input values by using the model you are doing __________.
Unlock Deck
Unlock for access to all 74 flashcards in this deck.
Unlock Deck
k this deck
13
The percentage of eighth grade students P participating in school music or performing arts in the years from 1996 to 2006 may be modeled by where t is years since 1996. Use the model to predict the percentage participation in 2020. Is this interpolation or extrapolation?
A) 74.69% interpolation
B) 74.69% extrapolation
C) 39.05% interpolation
D) 39.05% extrapolation
where t is years since 1996. Use the model to predict the percentage participation in 2020. Is this interpolation or extrapolation?A) 74.69% interpolation
B) 74.69% extrapolation
C) 39.05% interpolation
D) 39.05% extrapolation
Unlock Deck
Unlock for access to all 74 flashcards in this deck.
Unlock Deck
k this deck
14
The percentage of eighth grade students P participating in school music or performing arts in the years from 1996 to 2006 may be modeled by where t is years since 1996. Use the model to predict the percentage participation in 2000. Is this interpolation or extrapolation?
A) 52.65% interpolation
B) 52.65% extrapolation
C) 58.09% interpolation
D) 58.09% extrapolation
where t is years since 1996. Use the model to predict the percentage participation in 2000. Is this interpolation or extrapolation?A) 52.65% interpolation
B) 52.65% extrapolation
C) 58.09% interpolation
D) 58.09% extrapolation
Unlock Deck
Unlock for access to all 74 flashcards in this deck.
Unlock Deck
k this deck
15
During the years 1994 to 2007 seat belt use among front seat passengers ages 16 to 24 has increased. A linear model for the percentage of these passengers who use a seat belt is where P is percentage with a seat belt and t is years since 2000. The years before 2000 have a negative value for t. Use the model to predict the percentage of these passengers who used a seat belt in 2017.
A) 10.4%
B) 100%
C) 104.2%
where P is percentage with a seat belt and t is years since 2000. The years before 2000 have a negative value for t. Use the model to predict the percentage of these passengers who used a seat belt in 2017.A) 10.4%
B) 100%
C) 104.2%
Unlock Deck
Unlock for access to all 74 flashcards in this deck.
Unlock Deck
k this deck
16
The percentage of eighth grade students P participating in school music or performing arts in the years from 1996 to 2006 may be modeled by where t is years since 1996. What is the vertical intercept in the model? What does it mean?
A) participation started at 55.37% in 1996
B) participation goes up 55.37% each year since 1996
C) participation will be zero in 2081
D) participation will be zero in 2077
where t is years since 1996. What is the vertical intercept in the model? What does it mean?A)
participation started at 55.37% in 1996B)
participation goes up 55.37% each year since 1996C)
participation will be zero in 2081D)
participation will be zero in 2077 Unlock Deck
Unlock for access to all 74 flashcards in this deck.
Unlock Deck
k this deck
17
The percentage of eighth grade students P participating in school music or performing arts in the years from 1996 to 2006 may be modeled by where t is years since 1996. What is the horizontal intercept in the model? What does it mean? Is this extrapolation?
A) participation started at 55.37% in 1996. not extrapolation
B) participation goes up 55.37% each year since 1996. not extrapolation.
C) participation will be zero in 2081. extrapolation
D) participation will be zero in 2077. extrapolation
where t is years since 1996. What is the horizontal intercept in the model? What does it mean? Is this extrapolation?A)
participation started at 55.37% in 1996. not extrapolationB)
participation goes up 55.37% each year since 1996. not extrapolation.C)
participation will be zero in 2081. extrapolationD)
participation will be zero in 2077. extrapolation Unlock Deck
Unlock for access to all 74 flashcards in this deck.
Unlock Deck
k this deck
18
During the years 1994 to 2007 seat belt use among front seat passengers ages 16 to 24 has increased. A linear model for the percentage of these passengers who use a seat belt is where P is percentage with a seat belt and t is years since 2000. The years before 2000 have a negative value for t. Use the model to predict the percentage of these passengers who used a seat belt in 2005.
A) 75%
B) 76.3%
C) 47.4%
where P is percentage with a seat belt and t is years since 2000. The years before 2000 have a negative value for t. Use the model to predict the percentage of these passengers who used a seat belt in 2005.A) 75%
B) 76.3%
C) 47.4%
Unlock Deck
Unlock for access to all 74 flashcards in this deck.
Unlock Deck
k this deck
19
The percentage of eighth grade students P participating in school music or performing arts in the years from 1996 to 2006 may be modeled by where t is years since 1996. What is the slope in the model? What does it mean?
A) participation started at 68% in 1996
B) participation goes up 68% each year since 1996
C) participation goes up 0.68% each year since 1996
D) participation goes down 0.68% each year since 1996
where t is years since 1996. What is the slope in the model? What does it mean?A)
participation started at 68% in 1996B)
participation goes up 68% each year since 1996C)
participation goes up 0.68% each year since 1996D)
participation goes down 0.68% each year since 1996 Unlock Deck
Unlock for access to all 74 flashcards in this deck.
Unlock Deck
k this deck
20
During the years 1994 to 2007 seat belt use among front seat passengers ages 16 to 24 has increased. A linear model for the percentage of these passengers who use a seat belt is where P is percentage with a seat belt and t is years since 2000. The years before 2000 have a negative value for t. What is the vertical intercept of the model and what does it mean in terms of the problem?
A) . In the year 1994 seat belt use was 64.60.
B) . In the year 2000 seat belt use was 64.60.
C) 2.33. Every year seat belt use goes up 2.33%
D) . In the year 2000 seat belt use was 64.60%.
where P is percentage with a seat belt and t is years since 2000. The years before 2000 have a negative value for t. What is the vertical intercept of the model and what does it mean in terms of the problem?A)
. In the year 1994 seat belt use was 64.60.B)
. In the year 2000 seat belt use was 64.60.C) 2.33. Every year seat belt use goes up 2.33%
D)
. In the year 2000 seat belt use was 64.60%. Unlock Deck
Unlock for access to all 74 flashcards in this deck.
Unlock Deck
k this deck
21
The percentage P of 6 to 11 year old children in the U.S. who are overweight may be modeled by the equation where t is years since 1980. What is the horizontal intercept of this model? Round to one decimal place. What does it mean for this application?
where t is years since 1980. What is the horizontal intercept of this model? Round to one decimal place. What does it mean for this application? Unlock Deck
Unlock for access to all 74 flashcards in this deck.
Unlock Deck
k this deck
22
Given the data set draw a scatterplot. Clearly label and scale the axes. Does the data set follow a linear pattern a parabolic pattern or neither?
A) linear
B) parabolic
C) neither
D) parabolic
A)
linearB)
parabolicC)
neitherD)
parabolic Unlock Deck
Unlock for access to all 74 flashcards in this deck.
Unlock Deck
k this deck
23
Given the data set draw a scatterplot. Clearly label and scale the axes. Are the data approximately linear?
Unlock Deck
Unlock for access to all 74 flashcards in this deck.
Unlock Deck
k this deck
24
The percentage P of 6 to 11 year old children in the U.S. who are overweight may be modeled by the equation where t is years since 1980. Use the model to predict the percentage of 6 to 11 year old U.S. children who were overweight in 2000.
where t is years since 1980. Use the model to predict the percentage of 6 to 11 year old U.S. children who were overweight in 2000. Unlock Deck
Unlock for access to all 74 flashcards in this deck.
Unlock Deck
k this deck
25
During the years 2002 to 2008 smoking among twelfth grade students was declining. A linear model for the percentage of twelfth grade students who smoke is . P is the percentage of twelfth graders who smoke and t is years since 2002. Find the vertical intercept of the model and explain its value in terms of the problem.
. P is the percentage of twelfth graders who smoke and t is years since 2002. Find the vertical intercept of the model and explain its value in terms of the problem. Unlock Deck
Unlock for access to all 74 flashcards in this deck.
Unlock Deck
k this deck
26
The Supplemental Nutrition Assistance Program (SNAP) to provide food assistance has increased the number of participants in millions in the years from 2000 to 2008. Let P be the number of participants in millions and t be years since 2000. The following linear model fits the data: . What is the horizontal intercept? Explain its value in terms of the problem if any.
. What is the horizontal intercept? Explain its value in terms of the problem if any. Unlock Deck
Unlock for access to all 74 flashcards in this deck.
Unlock Deck
k this deck
27
The Supplemental Nutrition Assistance Program (SNAP) to provide food assistance has increased the number of participants in millions in the years from 2000 to 2008. Let P be the number of participants in millions and t be years since 2000. The following linear model fits the data: . Use the model to estimate the number of participants in SNAP in 2015. Is this interpolation or extrapolation?
. Use the model to estimate the number of participants in SNAP in 2015. Is this interpolation or extrapolation? Unlock Deck
Unlock for access to all 74 flashcards in this deck.
Unlock Deck
k this deck
28
The Supplemental Nutrition Assistance Program (SNAP) to provide food assistance has increased the number of participants in millions in the years from 2000 to 2008. Let P be the number of participants in millions and t be years since 2000. The following linear model fits the data: . What is the vertical intercept? Explain its value in terms of the problem.
. What is the vertical intercept? Explain its value in terms of the problem. Unlock Deck
Unlock for access to all 74 flashcards in this deck.
Unlock Deck
k this deck
29
The Supplemental Nutrition Assistance Program (SNAP) to provide food assistance has increased the number of participants in millions in the years from 2000 to 2008. Let P be the number of participants in millions and t be years since 2000. The following linear model fits the data: . Use the model to estimate the number of participants in SNAP in 2003. Is this interpolation or extrapolation?
. Use the model to estimate the number of participants in SNAP in 2003. Is this interpolation or extrapolation? Unlock Deck
Unlock for access to all 74 flashcards in this deck.
Unlock Deck
k this deck
30
The Supplemental Nutrition Assistance Program (SNAP) to provide food assistance has increased the number of participants in millions in the years from 2000 to 2008. Let P be the number of participants in millions and t be years since 2000. The following linear model fits the data: . What is the slope? Explain its value in terms of the problem.
. What is the slope? Explain its value in terms of the problem. Unlock Deck
Unlock for access to all 74 flashcards in this deck.
Unlock Deck
k this deck
31
Given the data set draw a scatterplot. Clearly label and scale the axes. Are the data approximately linear?
Unlock Deck
Unlock for access to all 74 flashcards in this deck.
Unlock Deck
k this deck
32
During the years 2002 to 2008 smoking among twelfth grade students was declining. A linear model for the percentage of twelfth grade students who smoke is . P is the percentage of twelfth graders who smoke and t is years since 2002. Find the horizontal intercept of the model and explain its value in terms of the problem. Is this reasonable?
. P is the percentage of twelfth graders who smoke and t is years since 2002. Find the horizontal intercept of the model and explain its value in terms of the problem. Is this reasonable? Unlock Deck
Unlock for access to all 74 flashcards in this deck.
Unlock Deck
k this deck
33
During the years 2002 to 2008 smoking among twelfth grade students was declining. A linear model for the percentage of twelfth grade students who smoke is . P is the percentage of twelfth graders who smoke and t is years since 2002. Use the model to predict the percentage of twelfth grade students who smoke in 2020. Is this answer reasonable?
. P is the percentage of twelfth graders who smoke and t is years since 2002. Use the model to predict the percentage of twelfth grade students who smoke in 2020. Is this answer reasonable? Unlock Deck
Unlock for access to all 74 flashcards in this deck.
Unlock Deck
k this deck
34
The population of the District of Columbia is given in the following table.
Draw a scatterplot and draw an eyeball best-fit line on the scatterplot.
Draw a scatterplot and draw an eyeball best-fit line on the scatterplot. Unlock Deck
Unlock for access to all 74 flashcards in this deck.
Unlock Deck
k this deck
35
The percentage P of 6 to 11 year old children in the U.S. who are overweight may be modeled by the equation where t is years since 1980. What is the vertical intercept of this model? What does it mean for this application?
where t is years since 1980. What is the vertical intercept of this model? What does it mean for this application? Unlock Deck
Unlock for access to all 74 flashcards in this deck.
Unlock Deck
k this deck
36
The percentage P of 6 to 11 year old children in the U.S. who are overweight may be modeled by the equation where t is years since 1980. Use the model to predict the percentage of 6 to 11 year old U.S. children who will be overweight in 2020. Is this estimate reasonable?
where t is years since 1980. Use the model to predict the percentage of 6 to 11 year old U.S. children who will be overweight in 2020. Is this estimate reasonable? Unlock Deck
Unlock for access to all 74 flashcards in this deck.
Unlock Deck
k this deck
37
During the years 2002 to 2008 smoking among twelfth grade students was declining. A linear model for the percentage of twelfth grade students who smoke is . P is the percentage of twelfth graders who smoke and t is years since 2002. Use the model to predict the percentage of twelfth grade students who smoke in 2010. Is this answer reasonable?
. P is the percentage of twelfth graders who smoke and t is years since 2002. Use the model to predict the percentage of twelfth grade students who smoke in 2010. Is this answer reasonable? Unlock Deck
Unlock for access to all 74 flashcards in this deck.
Unlock Deck
k this deck
38
The population of Florida is given in the following table.
Draw a scatterplot and draw an eyeball best-fit line on the scatterplot.
Draw a scatterplot and draw an eyeball best-fit line on the scatterplot. Unlock Deck
Unlock for access to all 74 flashcards in this deck.
Unlock Deck
k this deck
39
Given the data set draw a scatterplot. Clearly label and scale the axes. Are the data approximately linear?
Unlock Deck
Unlock for access to all 74 flashcards in this deck.
Unlock Deck
k this deck
40
During the years 2002 to 2008 smoking among twelfth grade students was declining. A linear model for the percentage of twelfth grade students who smoke is . P is the percentage of twelfth graders who smoke and t is years since 2002. Find the slope of the model and explain the value of the slope in terms of the problem. Is percentage of twelfth graders who smoke going up or down over time?
. P is the percentage of twelfth graders who smoke and t is years since 2002. Find the slope of the model and explain the value of the slope in terms of the problem. Is percentage of twelfth graders who smoke going up or down over time? Unlock Deck
Unlock for access to all 74 flashcards in this deck.
Unlock Deck
k this deck
41
The average profit in dollars A that your baking business makes when baking n cakes is given by . Find and explain the vertex.
A) If you make 44 cakes you maximize your profit at $484.
B) If you make 44 cakes you minimize your profit at $484.
C) If you make 88 cakes you make no profit.
. Find and explain the vertex.A)
If you make 44 cakes you maximize your profit at $484.B)
If you make 44 cakes you minimize your profit at $484.C)
If you make 88 cakes you make no profit. Unlock Deck
Unlock for access to all 74 flashcards in this deck.
Unlock Deck
k this deck
42
Given a quadratic model where t is time the formula for the time of the vertex is __________.
where t is time the formula for the time of the vertex is __________. Unlock Deck
Unlock for access to all 74 flashcards in this deck.
Unlock Deck
k this deck
43
A quadratic model for the median price of a condo is given by . The variable x is the years since 2000. Use the model to predict the median price of a condo in 2005.
A) $300000
B) $195075
C) $305500
. The variable x is the years since 2000. Use the model to predict the median price of a condo in 2005.A) $300000
B) $195075
C) $305500
Unlock Deck
Unlock for access to all 74 flashcards in this deck.
Unlock Deck
k this deck
44
The graph shows the average monthly high temperature in Newark NJ for months from November to April. If a quadratic model is fit to the graphed data set will a be positive or negative?
A) positive
B) negative
is fit to the graphed data set will a be positive or negative? A) positive
B) negative
Unlock Deck
Unlock for access to all 74 flashcards in this deck.
Unlock Deck
k this deck
45
The graph shows the average monthly high temperature in Newark NJ for months from April to September. If a quadratic model is fit to the graphed data set will a be positive or negative?
A) positive
B) negative
is fit to the graphed data set will a be positive or negative? A) positive
B) negative
Unlock Deck
Unlock for access to all 74 flashcards in this deck.
Unlock Deck
k this deck
46
The average profit in dollars A that your baking business makes when baking n cakes is given by . How many cakes rounded to whole numbers should you bake in order to have a profit of $300?
A) 71 cakes
B) 17 cakes
C) 17 or 71 cakes
. How many cakes rounded to whole numbers should you bake in order to have a profit of $300?A) 71 cakes
B) 17 cakes
C) 17 or 71 cakes
Unlock Deck
Unlock for access to all 74 flashcards in this deck.
Unlock Deck
k this deck
47
Given the data set draw a scatterplot. Clearly label and scale the axes. Does the data set follow a linear pattern a parabolic pattern or neither?
Unlock Deck
Unlock for access to all 74 flashcards in this deck.
Unlock Deck
k this deck
48
The graph shows the average monthly high temperature in Newark NJ for months from November to April. If a quadratic model is fit to the graphed data set estimate the coordinates of the vertex.
A)
B)
C)
D)
is fit to the graphed data set estimate the coordinates of the vertex. A)
B)
C)
D)
Unlock Deck
Unlock for access to all 74 flashcards in this deck.
Unlock Deck
k this deck
49
The graph shows the average monthly high temperature in Newark NJ for months from April to September. If a quadratic model is fit to the graphed data set estimate the coordinates of the vertex.
A)
B)
C)
D)
is fit to the graphed data set estimate the coordinates of the vertex. A)
B)
C)
D)
Unlock Deck
Unlock for access to all 74 flashcards in this deck.
Unlock Deck
k this deck
50
Given the data set draw a scatterplot. Clearly label and scale the axes. Does the data set follow a linear pattern a parabolic pattern or neither?
A) linear
B) parabolic
C) neither
D) parabolic
A)
linearB)
parabolicC)
neitherD)
parabolic Unlock Deck
Unlock for access to all 74 flashcards in this deck.
Unlock Deck
k this deck
51
The graph shows the average monthly high temperature in Newark NJ for months from April to September. Does the graph follow a linear pattern quadratic pattern or neither?
A) linear
B) quadratic
C) neither
A) linear
B) quadratic
C) neither
Unlock Deck
Unlock for access to all 74 flashcards in this deck.
Unlock Deck
k this deck
52
You are given a quadratic model where t is time. If a is __________ the vertex identifies the minimum point.
where t is time. If a is __________ the vertex identifies the minimum point. Unlock Deck
Unlock for access to all 74 flashcards in this deck.
Unlock Deck
k this deck
53
You are given a quadratic model where t is time. If a is negative the vertex identifies the __________ point.
where t is time. If a is negative the vertex identifies the __________ point. Unlock Deck
Unlock for access to all 74 flashcards in this deck.
Unlock Deck
k this deck
54
The average profit in dollars A that your baking business makes when baking n cakes is given by . Find and explain the vertical intercept.
A) If you make 88 cakes you make no profit.
B) If you make 88 cakes you maximize your profit.
C) If you make no cakes you make no profit.
. Find and explain the vertical intercept.A)
If you make 88 cakes you make no profit.B)
If you make 88 cakes you maximize your profit.C)
If you make no cakes you make no profit. Unlock Deck
Unlock for access to all 74 flashcards in this deck.
Unlock Deck
k this deck
55
A quadratic model for the median price of a condo is given by . The variable x is the years since 2000. Find the vertex of the model. Explain it in this problem.
A) At the end of 2000 the median price is $338604.
B) At the end of 2003 the median price is $338604.
C) At the end of 2004 the median price is $338604.
. The variable x is the years since 2000. Find the vertex of the model. Explain it in this problem.A)
At the end of 2000 the median price is $338604.B)
At the end of 2003 the median price is $338604.C)
At the end of 2004 the median price is $338604. Unlock Deck
Unlock for access to all 74 flashcards in this deck.
Unlock Deck
k this deck
56
Given the data set draw a scatterplot. Clearly label and scale the axes. Does the data set follow a linear pattern a parabolic pattern or neither?
Unlock Deck
Unlock for access to all 74 flashcards in this deck.
Unlock Deck
k this deck
57
The graph shows the average monthly high temperature in Newark NJ for months from November to April. Does the data graphed follow a linear pattern a parabolic pattern or neither?
A) linear
B) parabolic
C) neither
A) linear
B) parabolic
C) neither
Unlock Deck
Unlock for access to all 74 flashcards in this deck.
Unlock Deck
k this deck
58
A __________ model fits data points that follow a parabolic pattern.
Unlock Deck
Unlock for access to all 74 flashcards in this deck.
Unlock Deck
k this deck
59
Given the data set draw a scatterplot. Clearly label and scale the axes. Does the data set follow a linear pattern a parabolic pattern or neither?
Unlock Deck
Unlock for access to all 74 flashcards in this deck.
Unlock Deck
k this deck
60
The average profit in dollars A that your baking business makes when baking n cakes is given by . Find and explain the horizontal intercept(s).
A) If you make no cakes you make no profit.
B) If you make 44 cakes you minimize your profit at $484.
C) and If you make either 0 or 88 cakes you make no profit.
. Find and explain the horizontal intercept(s).A)
If you make no cakes you make no profit.B)
If you make 44 cakes you minimize your profit at $484.C)
and If you make either 0 or 88 cakes you make no profit. Unlock Deck
Unlock for access to all 74 flashcards in this deck.
Unlock Deck
k this deck
61
If a quadratic model is fit to the graphed data set will a be positive or negative?
is fit to the graphed data set will a be positive or negative? Unlock Deck
Unlock for access to all 74 flashcards in this deck.
Unlock Deck
k this deck
62
You have moved to Chicago in the fall. The graph shows the average monthly high temperature for months since you moved to Chicago. If a quadratic model is fit to the graphed data set will a be positive or negative?
is fit to the graphed data set will a be positive or negative? Unlock Deck
Unlock for access to all 74 flashcards in this deck.
Unlock Deck
k this deck
63
The average profit in dollars A that your baking business makes when baking n pies is given by . Find and explain the vertical intercept.
. Find and explain the vertical intercept. Unlock Deck
Unlock for access to all 74 flashcards in this deck.
Unlock Deck
k this deck
64
A quadratic model for the median home price in Tampa Florida is given by . The variable x is the years since 2000. Find the vertex of the model. Explain it in this problem.
. The variable x is the years since 2000. Find the vertex of the model. Explain it in this problem. Unlock Deck
Unlock for access to all 74 flashcards in this deck.
Unlock Deck
k this deck
65
The profit in dollars A that your baking business makes when baking n pies is given by . Find the number of pies you must sell to have a profit of $300. Round to whole number(s).
. Find the number of pies you must sell to have a profit of $300. Round to whole number(s). Unlock Deck
Unlock for access to all 74 flashcards in this deck.
Unlock Deck
k this deck
66
Does the data graphed follow a linear pattern a parabolic pattern or neither?
Unlock Deck
Unlock for access to all 74 flashcards in this deck.
Unlock Deck
k this deck
67
The profit in dollars A that your baking business makes when baking n pies is given by . Find and explain the vertex.
. Find and explain the vertex. Unlock Deck
Unlock for access to all 74 flashcards in this deck.
Unlock Deck
k this deck
68
You have moved to Chicago in the fall. The graph shows the average monthly high temperature for months since you moved to Chicago. A quadratic model for this data is where y is the average monthly high temperature and x is months after you moved to Chicago. Use the model to predict the lowest average monthly high temperature. Round to the nearest month to make this estimate. Round to one decimal place.
where y is the average monthly high temperature and x is months after you moved to Chicago. Use the model to predict the lowest average monthly high temperature. Round to the nearest month to make this estimate. Round to one decimal place. Unlock Deck
Unlock for access to all 74 flashcards in this deck.
Unlock Deck
k this deck
69
If a quadratic model is fit to the graphed data set estimate the coordinates of the vertex.
is fit to the graphed data set estimate the coordinates of the vertex. Unlock Deck
Unlock for access to all 74 flashcards in this deck.
Unlock Deck
k this deck
70
You have moved to Chicago in the fall. The graph shows the average monthly high temperature for months since you moved to Chicago. A quadratic model for this data is where y is the average monthly high temperature and x is months after you moved to Chicago. Use the model to predict the average monthly high temperature 2 months after you moved to Chicago.
where y is the average monthly high temperature and x is months after you moved to Chicago. Use the model to predict the average monthly high temperature 2 months after you moved to Chicago. Unlock Deck
Unlock for access to all 74 flashcards in this deck.
Unlock Deck
k this deck
71
You have moved to Chicago in the fall. The graph shows the average monthly high temperature for months since you moved to Chicago. A quadratic model for this data is where y is the average monthly high temperature and x is months after you moved to Chicago. Use the model to predict the average monthly high temperature 8 months after you moved to Chicago. Round to one decimal place.
where y is the average monthly high temperature and x is months after you moved to Chicago. Use the model to predict the average monthly high temperature 8 months after you moved to Chicago. Round to one decimal place. Unlock Deck
Unlock for access to all 74 flashcards in this deck.
Unlock Deck
k this deck
72
You have moved to Chicago in the fall. The graph shows the average monthly high temperature for months since you moved to Chicago. Does the graph show a linear pattern a quadratic pattern or neither?
Unlock Deck
Unlock for access to all 74 flashcards in this deck.
Unlock Deck
k this deck
73
A quadratic model for the median home price in Tampa Florida is given by . The variable x is the years since 2000. Use the model to predict the median home price in the year 2008.
. The variable x is the years since 2000. Use the model to predict the median home price in the year 2008. Unlock Deck
Unlock for access to all 74 flashcards in this deck.
Unlock Deck
k this deck
74
You have moved to Chicago in the fall. The graph shows the average monthly high temperature for months since you moved to Chicago. If a quadratic model is fit to the graphed data set estimate the coordinates of the vertex.
is fit to the graphed data set estimate the coordinates of the vertex. Unlock Deck
Unlock for access to all 74 flashcards in this deck.
Unlock Deck
k this deck
Unlock Deck
Unlock for access to all 74 flashcards in this deck.


