Deck 3: Visualizing and Exploring Data
Full screen (f)
Question
Question
Use the data given below to answer the following question(s).
Following is an extract from the Employee Payroll Database of HFR Informatics Inc.
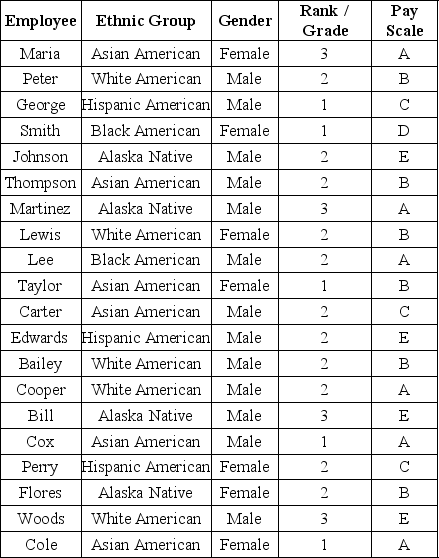
What is the cumulative relative frequency of employees on a 'A to D' pay scale?
A)1)00
B)0)80
C)0)30
D)0)60
Following is an extract from the Employee Payroll Database of HFR Informatics Inc.
What is the cumulative relative frequency of employees on a 'A to D' pay scale?
A)1)00
B)0)80
C)0)30
D)0)60
Question
Question
Use the data given below to answer the following question(s).
Following is an extract from the Employee Payroll Database of HFR Informatics Inc.
What is the cumulative relative frequency of Ranks 1 and 2?
A)0)80
B)0)15
C)0)30
D)0)25
Following is an extract from the Employee Payroll Database of HFR Informatics Inc.
What is the cumulative relative frequency of Ranks 1 and 2?
A)0)80
B)0)15
C)0)30
D)0)25
Question
Use the data given below to answer the following question(s).
Following is the Sales database of Pointler's Inc., a manufacturer of clothing material.
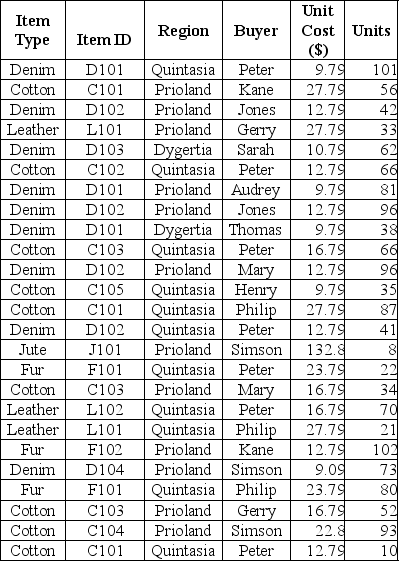
Use Excel to calculate the total $ amount earned from sales of all denim items to Prioland
A)$4449.42
B)$22213
C)$388
D)$57.25
Following is the Sales database of Pointler's Inc., a manufacturer of clothing material.
Use Excel to calculate the total $ amount earned from sales of all denim items to Prioland
A)$4449.42
B)$22213
C)$388
D)$57.25
Question
Use the data given below to answer the following question(s).
Following is an extract from the Employee Payroll Database of HFR Informatics Inc.
What is the relative frequency of Grade 3 employees?
A)4
B)0)55
C)0)20
D)5
Following is an extract from the Employee Payroll Database of HFR Informatics Inc.
What is the relative frequency of Grade 3 employees?
A)4
B)0)55
C)0)20
D)5
Question
Question
Question
Use the data given below to answer the following question(s).
Following is an extract from the Employee Payroll Database of HFR Informatics Inc.
What is the relative frequency of Female employees?
A)0)65
B)0)75
C)0)25
D)0)35
Following is an extract from the Employee Payroll Database of HFR Informatics Inc.
What is the relative frequency of Female employees?
A)0)65
B)0)75
C)0)25
D)0)35
Question
Use the data given below to answer the following question(s).
Following is the Sales database of Pointler's Inc., a manufacturer of clothing material.
Use Excel to calculate the total $ amount of sales made to Quintasia.Include the sale of fur, jute, and leather.
A)$193
B)$4185.47
C)$25250.19
D)$130.83
Following is the Sales database of Pointler's Inc., a manufacturer of clothing material.
Use Excel to calculate the total $ amount of sales made to Quintasia.Include the sale of fur, jute, and leather.
A)$193
B)$4185.47
C)$25250.19
D)$130.83
Question
Question
Question
Use the data given below to answer the following question(s).
Following is the Sales database of Pointler's Inc., a manufacturer of clothing material.
If a data set has 'c' number of observations, the relative frequency of category 'l' is computed as ________.
A) (frequency of category 'l')/ 'c'
B)'c' × (number of observations in category 'l')
C) (sum of all observations in category 'l')/ 'c'
D)sum of ('c' + each observation in category 'l')
Question
Use the data given below to answer the following question(s).
Following is the Sales database of Pointler's Inc., a manufacturer of clothing material.
To construct a frequency distribution for categorical data, the
A)observations that appear in each category must be summed up.
B)number of observations that appear in each category must be counted.
C)observations in each category must be multiplied by observations in the corresponding category.
D)number of observations in each category must be divided by the total number of observations in all categories.
Question
Question
Question
Question
Question
Use the data given below to answer the following question(s).
Following is the Sales database of Pointler's Inc., a manufacturer of clothing material.
Use Excel to identify the buyer who made the highest single purchase of cotton (in terms of sales revenue for Pointler's Inc.)in Quintasia.
A)Peter
B)Henry
C)Philip
D)Simson
Following is the Sales database of Pointler's Inc., a manufacturer of clothing material.
Use Excel to identify the buyer who made the highest single purchase of cotton (in terms of sales revenue for Pointler's Inc.)in Quintasia.
A)Peter
B)Henry
C)Philip
D)Simson
Question
Question
Use the data given below to answer the following question(s).
Following is the purchase order database of 'The Chef Says So', a restaurant in New York, over the last quarter (April-June).
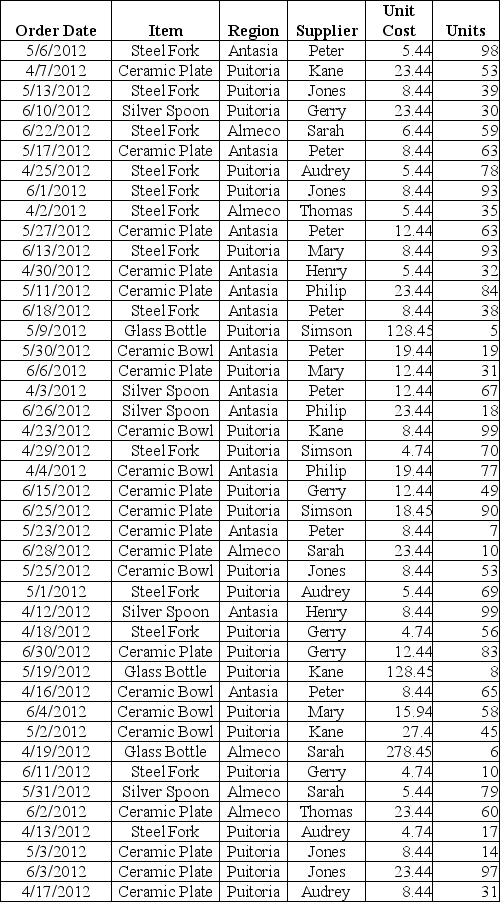
Construct a relative frequency distribution for items in the purchase order database and show the proportions of the frequencies visually using a pie chart.
Following is the purchase order database of 'The Chef Says So', a restaurant in New York, over the last quarter (April-June).
Construct a relative frequency distribution for items in the purchase order database and show the proportions of the frequencies visually using a pie chart.
Question
Use the data given below to answer the following question(s).
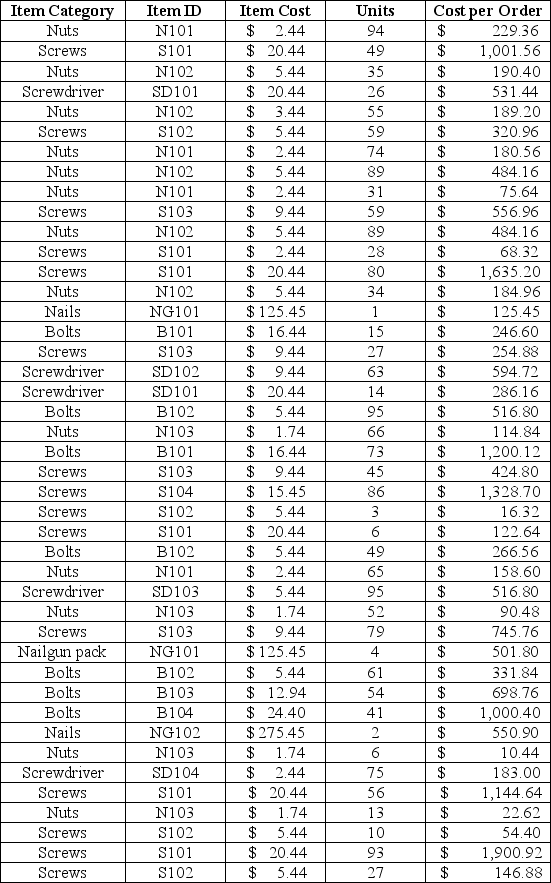
Following is an extract from the Cost per Order Database of Grogtes LLC.
Which of the following can be used to quickly create cross-tabulations?
A)Frequency distribution
B)COUNTIF function
C)PivotTable
D)Sort & Filter
Following is an extract from the Cost per Order Database of Grogtes LLC.
Which of the following can be used to quickly create cross-tabulations?
A)Frequency distribution
B)COUNTIF function
C)PivotTable
D)Sort & Filter
Question
Use the data given below to answer the following question(s).
Following is an extract from the Cost per Order Database of Grogtes LLC.
Which of the following observations is closest to the 87th percentile of costs per order?
A)75 SD104 screwdrivers for $183.00
B)66 N103 nuts for $114.84
C)73 B101 bolts for $1,200.12
D)49 S101 screws for $1,001.56
Following is an extract from the Cost per Order Database of Grogtes LLC.
Which of the following observations is closest to the 87th percentile of costs per order?
A)75 SD104 screwdrivers for $183.00
B)66 N103 nuts for $114.84
C)73 B101 bolts for $1,200.12
D)49 S101 screws for $1,001.56
Question
Use the data given below to answer the following question(s).
Following is the purchase order database of 'The Chef Says So', a restaurant in New York, over the last quarter (April-June).
Describe and construct a cross-tabulation showing the region-wise percentage breakdown of purchase of glass bottles and silver spoons and visually represent the data in a 3-D cylindrical chart.
Counts:
Percentages by Region:
Question
Use the data given below to answer the following question(s).
Following is the purchase order database of 'The Chef Says So', a restaurant in New York, over the last quarter (April-June).
Describe how to and construct a line chart exhibiting the purchase order of ceramic plates over the three months.
Following is the purchase order database of 'The Chef Says So', a restaurant in New York, over the last quarter (April-June).
Describe how to and construct a line chart exhibiting the purchase order of ceramic plates over the three months.
Question
Use the data given below to answer the following question(s).
Following is an extract from the Cost per Order Database of Grogtes LLC.
Which of the following observations is closest to the third quartile?
A)35 N102 nuts for $190.40
B)59 S103 screws for $556.96
C)13 N103 nuts for $22.62
D)2 NG102 nailgun packs for $550.90
Following is an extract from the Cost per Order Database of Grogtes LLC.
Which of the following observations is closest to the third quartile?
A)35 N102 nuts for $190.40
B)59 S103 screws for $556.96
C)13 N103 nuts for $22.62
D)2 NG102 nailgun packs for $550.90
Question
Use the data given below to answer the following question(s).
Following is an extract from the Employee Payroll Database of HFR Informatics Inc.
A graphical depiction of a frequency distribution for numerical data in the form of a column chart is called a ________.
A)cartogram
B)correlogram
C)histogram
D)dendogram
Following is an extract from the Employee Payroll Database of HFR Informatics Inc.
A graphical depiction of a frequency distribution for numerical data in the form of a column chart is called a ________.
A)cartogram
B)correlogram
C)histogram
D)dendogram
Question
Use the data given below to answer the following question(s).
Following is the purchase order database of 'The Chef Says So', a restaurant in New York, over the last quarter (April-June).
Construct a PivotChart to visualize the purchase order total units for steel forks and ceramic bowls within each region.
Following is the purchase order database of 'The Chef Says So', a restaurant in New York, over the last quarter (April-June).
Construct a PivotChart to visualize the purchase order total units for steel forks and ceramic bowls within each region.
Question
Use the data given below to answer the following question(s).
Following is the purchase order database of 'The Chef Says So', a restaurant in New York, over the last quarter (April-June).
Describe how to sort the data by inventory value to compute cumulative percentage of total inventory value to help the restaurateur conduct a Pareto analysis.(Assume that no damages were caused to the inventory purchased over the three months)
Question
Use the data given below to answer the following question(s).
Following is an extract from the Cost per Order Database of Grogtes LLC.
Which of the following does the second quartile of the costs per order indicate?
A)2% of the costs per order are less than or equal to $114.84.
B)20% of the costs per order are less than or equal to $1,200.12.
C)5% of the costs per order are less than or equal to $229.36.
D)50% of the costs per order are less than or equal to $286.16.
Question
Use the data given below to answer the following question(s).
Following is an extract from the Employee Payroll Database of HFR Informatics Inc.
The Excel 2010 function ________ computes the kᵗʰ percentile of data in the range specified in the array field, where k is in the range 0 to 1, inclusive.
A)PERCENTILE.INC(array, k)
B)PERCENTILE(array + k)
C)PERCENTILE.IF(array, k)
D)PERCENTILE(SUM(array), k)
Question
Use the data given below to answer the following question(s).
Following is an extract from the Cost per Order Database of Grogtes LLC.
After choosing the PivotTable, the PivotChart can be found on the ________ tab.
A)Design
B)View
C)Options
D)Layout
Following is an extract from the Cost per Order Database of Grogtes LLC.
After choosing the PivotTable, the PivotChart can be found on the ________ tab.
A)Design
B)View
C)Options
D)Layout
Question
Use the data given below to answer the following question(s).
Following is an extract from the Cost per Order Database of Grogtes LLC.
Which of the following is true about constructing PivotTables?
A)It is not possible to construct the PivotTable in the same worksheet.
B)Dragging a field into the Report Filter area allows addition of a third dimension to the analysis.
C)Placing a field each in the row and column labels will automatically sum the variable values in the table.
D)PivotTables cannot be duplicated by copying and pasting an existing table.
Question
Use the data given below to answer the following question(s).
Following is an extract from the Cost per Order Database of Grogtes LLC.
Which of the following does the 38th percentile of the costs per order indicate?
A)17% of the costs per order are less than or equal to $190.40.
B)38% of the costs per order are less than or equal to $183.00.
C)83% of the costs per order are less than or equal to $10.44.
D)62% of the costs per order are less than or equal to $1,001.56.
Question
Use the data given below to answer the following question(s).
Following is an extract from the Cost per Order Database of Grogtes LLC.
Which of the following will give the value for the third quartile?
A)PERCENTILE.INC(array, 0.75)
B)QUARTILE.INC(array, 0.75)
C)DECILE.INC(array, 0.30)
D)QUARTILE.INC(array, 0.25)
Following is an extract from the Cost per Order Database of Grogtes LLC.
Which of the following will give the value for the third quartile?
A)PERCENTILE.INC(array, 0.75)
B)QUARTILE.INC(array, 0.75)
C)DECILE.INC(array, 0.30)
D)QUARTILE.INC(array, 0.25)
Question
Use the data given below to answer the following question(s).
Following is an extract from the Cost per Order Database of Grogtes LLC.
What is the rank of the 42ⁿᵈ percentile of the costs per order ?
A)17
B)13.35
C)19
D)33.75
Following is an extract from the Cost per Order Database of Grogtes LLC.
What is the rank of the 42ⁿᵈ percentile of the costs per order ?
A)17
B)13.35
C)19
D)33.75
Question
Use the data given below to answer the following question(s).
Following is an extract from the Employee Payroll Database of HFR Informatics Inc.
While constructing a histogram, how is group width calculated?
A)number of groups × (lower limit of the last group + upper limit of the first group)
B) (upper limit of the last group - lower limit of the first group)/ number of groups
C) (upper limit of the first group + number of groups)× lower limit of the last group + number of groups)
D) (lower limit of the first group - number of groups)× upper limit of the last group
Question
Use the data given below to answer the following question(s).
Following is an extract from the Cost per Order Database of Grogtes LLC.
Which of the following is true about quartiles?
A)The 25ᵗʰ percentile is called the fourth quartile.
B)One-fourth of the data fall below the fourth quartile.
C)Three-fourths of the data are below the third quartile.
D)The 50ᵗʰ quartile is the third percentile.
Question
Use the data given below to answer the following question(s).
Following is an extract from the Cost per Order Database of Grogtes LLC.
Which of the following is true about cross-tabulation?
A)All subcategories together must constitute the complete data set.
B)A cross-tabulation table is often called a latent class model.
C)Each observation can be classified into many subcategories.
D)The table displays the number of categorical variables between two observations.
Question
Use the data given below to answer the following question(s).
Following is an extract from the Employee Payroll Database of HFR Informatics Inc.
Which of the following represents the proportion of the total number of observations that fall at or below the upper limit of each group?
A)Percentile
B)Pareto chart
C)Frequency distribution
D)Cumulative relative frequency
Question
Use the data given below to answer the following question(s).
Following is the purchase order database of 'The Chef Says So', a restaurant in New York, over the last quarter (April-June).
How does Excel distinguish between vertical and horizontal bar charts?
Following is the purchase order database of 'The Chef Says So', a restaurant in New York, over the last quarter (April-June).
How does Excel distinguish between vertical and horizontal bar charts?
Question
Use the data given below to answer the following question(s).
Following is the purchase order database of 'The Chef Says So', a restaurant in New York, over the last quarter (April-June).
How is a frequency distribution calculated for categorical and numerical data?
Following is the purchase order database of 'The Chef Says So', a restaurant in New York, over the last quarter (April-June).
How is a frequency distribution calculated for categorical and numerical data?
Question
Use the data given below to answer the following question(s).
Following is the purchase order database of 'The Chef Says So', a restaurant in New York, over the last quarter (April-June).
While constructing frequency distributions for numerical data, SUMIF is used to count the frequencies of each discrete value.
Following is the purchase order database of 'The Chef Says So', a restaurant in New York, over the last quarter (April-June).
While constructing frequency distributions for numerical data, SUMIF is used to count the frequencies of each discrete value.
Question
Use the data given below to answer the following question(s).
Following is the purchase order database of 'The Chef Says So', a restaurant in New York, over the last quarter (April-June).
Elaborate on the use of geographic data mapping in business analytics.
Following is the purchase order database of 'The Chef Says So', a restaurant in New York, over the last quarter (April-June).
Elaborate on the use of geographic data mapping in business analytics.
Question
Use the data given below to answer the following question(s).
Following is the purchase order database of 'The Chef Says So', a restaurant in New York, over the last quarter (April-June).
Explain statistics as defined by David Hand.What are the two ways in which Microsoft Excel supports statistical analysis?
Following is the purchase order database of 'The Chef Says So', a restaurant in New York, over the last quarter (April-June).
Explain statistics as defined by David Hand.What are the two ways in which Microsoft Excel supports statistical analysis?
Question
Use the data given below to answer the following question(s).
Following is the purchase order database of 'The Chef Says So', a restaurant in New York, over the last quarter (April-June).
AutoFilter creates filtering criteria based on the type of data being filtered.
Following is the purchase order database of 'The Chef Says So', a restaurant in New York, over the last quarter (April-June).
AutoFilter creates filtering criteria based on the type of data being filtered.
Question
Use the data given below to answer the following question(s).
Following is the purchase order database of 'The Chef Says So', a restaurant in New York, over the last quarter (April-June).
Specifying a Bin Range will allow Excel to automatically determine bin values for the frequency distribution and histogram.
Following is the purchase order database of 'The Chef Says So', a restaurant in New York, over the last quarter (April-June).
Specifying a Bin Range will allow Excel to automatically determine bin values for the frequency distribution and histogram.
Question
Use the data given below to answer the following question(s).
Following is the purchase order database of 'The Chef Says So', a restaurant in New York, over the last quarter (April-June).
Explain with an example the filtering tool provided by Excel for simple criteria.
Following is the purchase order database of 'The Chef Says So', a restaurant in New York, over the last quarter (April-June).
Explain with an example the filtering tool provided by Excel for simple criteria.
Question
Use the data given below to answer the following question(s).
Following is the purchase order database of 'The Chef Says So', a restaurant in New York, over the last quarter (April-June).
Fewer groups provide a "coarse" histogram.
Following is the purchase order database of 'The Chef Says So', a restaurant in New York, over the last quarter (April-June).
Fewer groups provide a "coarse" histogram.
Question
Use the data given below to answer the following question(s).
Following is the purchase order database of 'The Chef Says So', a restaurant in New York, over the last quarter (April-June).
Changes to the type of chart, data included in the chart, and chart layout and styles can be made from the Layout tab.
Following is the purchase order database of 'The Chef Says So', a restaurant in New York, over the last quarter (April-June).
Changes to the type of chart, data included in the chart, and chart layout and styles can be made from the Layout tab.

Unlock Deck
Sign up to unlock the cards in this deck!
Unlock Deck
Unlock Deck
1/50
Play
Full screen (f)
Deck 3: Visualizing and Exploring Data
1
To select a chart type in Excel from the Charts group, which tab has to be accessed?
A)Design tab
B)Layout tab
C)Insert tab
D)Format tab
A)Design tab
B)Layout tab
C)Insert tab
D)Format tab
C
2
Use the data given below to answer the following question(s).
Following is an extract from the Employee Payroll Database of HFR Informatics Inc.
What is the cumulative relative frequency of employees on a 'A to D' pay scale?
A)1)00
B)0)80
C)0)30
D)0)60
Following is an extract from the Employee Payroll Database of HFR Informatics Inc.
What is the cumulative relative frequency of employees on a 'A to D' pay scale?
A)1)00
B)0)80
C)0)30
D)0)60
B
3
Roger wants to compare values across categories using vertical rectangles.Which of the following charts must Roger use?
A)Line chart
B)Clustered column chart
C)Pie chart
D)Stacked column chart
A)Line chart
B)Clustered column chart
C)Pie chart
D)Stacked column chart
B
4
Use the data given below to answer the following question(s).
Following is an extract from the Employee Payroll Database of HFR Informatics Inc.
What is the cumulative relative frequency of Ranks 1 and 2?
A)0)80
B)0)15
C)0)30
D)0)25
Following is an extract from the Employee Payroll Database of HFR Informatics Inc.
What is the cumulative relative frequency of Ranks 1 and 2?
A)0)80
B)0)15
C)0)30
D)0)25
Unlock Deck
Unlock for access to all 50 flashcards in this deck.
Unlock Deck
k this deck
5
Use the data given below to answer the following question(s).
Following is the Sales database of Pointler's Inc., a manufacturer of clothing material.
Use Excel to calculate the total $ amount earned from sales of all denim items to Prioland
A)$4449.42
B)$22213
C)$388
D)$57.25
Following is the Sales database of Pointler's Inc., a manufacturer of clothing material.
Use Excel to calculate the total $ amount earned from sales of all denim items to Prioland
A)$4449.42
B)$22213
C)$388
D)$57.25
Unlock Deck
Unlock for access to all 50 flashcards in this deck.
Unlock Deck
k this deck
6
Use the data given below to answer the following question(s).
Following is an extract from the Employee Payroll Database of HFR Informatics Inc.
What is the relative frequency of Grade 3 employees?
A)4
B)0)55
C)0)20
D)5
Following is an extract from the Employee Payroll Database of HFR Informatics Inc.
What is the relative frequency of Grade 3 employees?
A)4
B)0)55
C)0)20
D)5
Unlock Deck
Unlock for access to all 50 flashcards in this deck.
Unlock Deck
k this deck
7
Philip wishes to understand the relative proportion of each data source to the total.Which of the following charts must Philip use?
A)Pie chart
B)Bar chart
C)Scatter chart
D)Column chart
A)Pie chart
B)Bar chart
C)Scatter chart
D)Column chart
Unlock Deck
Unlock for access to all 50 flashcards in this deck.
Unlock Deck
k this deck
8
Which of the following relies on sorting data and calculating the cumulative percentage of the characteristic of interest?
A)Randolph diagram
B)Anscombe's quartet
C)Bland-Altman plot
D)Pareto analysis
A)Randolph diagram
B)Anscombe's quartet
C)Bland-Altman plot
D)Pareto analysis
Unlock Deck
Unlock for access to all 50 flashcards in this deck.
Unlock Deck
k this deck
9
Use the data given below to answer the following question(s).
Following is an extract from the Employee Payroll Database of HFR Informatics Inc.
What is the relative frequency of Female employees?
A)0)65
B)0)75
C)0)25
D)0)35
Following is an extract from the Employee Payroll Database of HFR Informatics Inc.
What is the relative frequency of Female employees?
A)0)65
B)0)75
C)0)25
D)0)35
Unlock Deck
Unlock for access to all 50 flashcards in this deck.
Unlock Deck
k this deck
10
Use the data given below to answer the following question(s).
Following is the Sales database of Pointler's Inc., a manufacturer of clothing material.
Use Excel to calculate the total $ amount of sales made to Quintasia.Include the sale of fur, jute, and leather.
A)$193
B)$4185.47
C)$25250.19
D)$130.83
Following is the Sales database of Pointler's Inc., a manufacturer of clothing material.
Use Excel to calculate the total $ amount of sales made to Quintasia.Include the sale of fur, jute, and leather.
A)$193
B)$4185.47
C)$25250.19
D)$130.83
Unlock Deck
Unlock for access to all 50 flashcards in this deck.
Unlock Deck
k this deck
11
Which of the following charts provides a useful means for displaying data over time?
A)Scatter chart
B)A doughnut chart
C)Pie chart
D)Line chart
A)Scatter chart
B)A doughnut chart
C)Pie chart
D)Line chart
Unlock Deck
Unlock for access to all 50 flashcards in this deck.
Unlock Deck
k this deck
12
Which of the following charts shows three-dimensional data?
A)Surface chart
B)Column chart
C)Stock chart
D)Doughnut chart
A)Surface chart
B)Column chart
C)Stock chart
D)Doughnut chart
Unlock Deck
Unlock for access to all 50 flashcards in this deck.
Unlock Deck
k this deck
13
Use the data given below to answer the following question(s).
Following is the Sales database of Pointler's Inc., a manufacturer of clothing material.
If a data set has 'c' number of observations, the relative frequency of category 'l' is computed as ________.
A) (frequency of category 'l')/ 'c'
B)'c' × (number of observations in category 'l')
C) (sum of all observations in category 'l')/ 'c'
D)sum of ('c' + each observation in category 'l')
Unlock Deck
Unlock for access to all 50 flashcards in this deck.
Unlock Deck
k this deck
14
Use the data given below to answer the following question(s).
Following is the Sales database of Pointler's Inc., a manufacturer of clothing material.
To construct a frequency distribution for categorical data, the
A)observations that appear in each category must be summed up.
B)number of observations that appear in each category must be counted.
C)observations in each category must be multiplied by observations in the corresponding category.
D)number of observations in each category must be divided by the total number of observations in all categories.
Unlock Deck
Unlock for access to all 50 flashcards in this deck.
Unlock Deck
k this deck
15
Which of the following charts allows plotting of multiple dimensions of several data series?
A)Doughnut chart
B)Bubble chart
C)Radar chart
D)Area chart
A)Doughnut chart
B)Bubble chart
C)Radar chart
D)Area chart
Unlock Deck
Unlock for access to all 50 flashcards in this deck.
Unlock Deck
k this deck
16
The sort buttons in Excel can be found under:
A)the Data tab in the Sort & Filter group.
B)the Home tab in the Styles group.
C)the Insert tab in the Sort group.
D)the Sort tab in the Filter group.
A)the Data tab in the Sort & Filter group.
B)the Home tab in the Styles group.
C)the Insert tab in the Sort group.
D)the Sort tab in the Filter group.
Unlock Deck
Unlock for access to all 50 flashcards in this deck.
Unlock Deck
k this deck
17
Howard has screened some employee details out of the employee database for tax computation purposes.In order to restore the original data file, Howard must:
A)click Sort Newest to Oldest.
B)click Clear filter from Item Description.
C)click Unmerge cells.
D)click Clear outline from Ungroup.
A)click Sort Newest to Oldest.
B)click Clear filter from Item Description.
C)click Unmerge cells.
D)click Clear outline from Ungroup.
Unlock Deck
Unlock for access to all 50 flashcards in this deck.
Unlock Deck
k this deck
18
Observations consisting of pairs of variable data are required to construct a ________ chart.
A)doughnut
B)scatter
C)radar
D)line
A)doughnut
B)scatter
C)radar
D)line
Unlock Deck
Unlock for access to all 50 flashcards in this deck.
Unlock Deck
k this deck
19
Use the data given below to answer the following question(s).
Following is the Sales database of Pointler's Inc., a manufacturer of clothing material.
Use Excel to identify the buyer who made the highest single purchase of cotton (in terms of sales revenue for Pointler's Inc.)in Quintasia.
A)Peter
B)Henry
C)Philip
D)Simson
Following is the Sales database of Pointler's Inc., a manufacturer of clothing material.
Use Excel to identify the buyer who made the highest single purchase of cotton (in terms of sales revenue for Pointler's Inc.)in Quintasia.
A)Peter
B)Henry
C)Philip
D)Simson
Unlock Deck
Unlock for access to all 50 flashcards in this deck.
Unlock Deck
k this deck
20
Peige, a stock broker, has data consisting of price, price/earnings ratio, and market capitalization for seven different stocks on one particular day.She wishes to plot these three variables in two dimensions.Which of the following charts must Peige use?
A)Stock chart
B)Surface chart
C)Bubble chart
D)Line chart
A)Stock chart
B)Surface chart
C)Bubble chart
D)Line chart
Unlock Deck
Unlock for access to all 50 flashcards in this deck.
Unlock Deck
k this deck
21
Use the data given below to answer the following question(s).
Following is the purchase order database of 'The Chef Says So', a restaurant in New York, over the last quarter (April-June).
Construct a relative frequency distribution for items in the purchase order database and show the proportions of the frequencies visually using a pie chart.
Following is the purchase order database of 'The Chef Says So', a restaurant in New York, over the last quarter (April-June).
Construct a relative frequency distribution for items in the purchase order database and show the proportions of the frequencies visually using a pie chart.
Unlock Deck
Unlock for access to all 50 flashcards in this deck.
Unlock Deck
k this deck
22
Use the data given below to answer the following question(s).
Following is an extract from the Cost per Order Database of Grogtes LLC.
Which of the following can be used to quickly create cross-tabulations?
A)Frequency distribution
B)COUNTIF function
C)PivotTable
D)Sort & Filter
Following is an extract from the Cost per Order Database of Grogtes LLC.
Which of the following can be used to quickly create cross-tabulations?
A)Frequency distribution
B)COUNTIF function
C)PivotTable
D)Sort & Filter
Unlock Deck
Unlock for access to all 50 flashcards in this deck.
Unlock Deck
k this deck
23
Use the data given below to answer the following question(s).
Following is an extract from the Cost per Order Database of Grogtes LLC.
Which of the following observations is closest to the 87th percentile of costs per order?
A)75 SD104 screwdrivers for $183.00
B)66 N103 nuts for $114.84
C)73 B101 bolts for $1,200.12
D)49 S101 screws for $1,001.56
Following is an extract from the Cost per Order Database of Grogtes LLC.
Which of the following observations is closest to the 87th percentile of costs per order?
A)75 SD104 screwdrivers for $183.00
B)66 N103 nuts for $114.84
C)73 B101 bolts for $1,200.12
D)49 S101 screws for $1,001.56
Unlock Deck
Unlock for access to all 50 flashcards in this deck.
Unlock Deck
k this deck
24
Use the data given below to answer the following question(s).
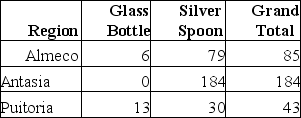
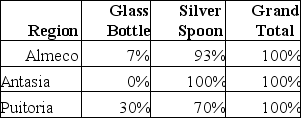
Following is the purchase order database of 'The Chef Says So', a restaurant in New York, over the last quarter (April-June).
Describe and construct a cross-tabulation showing the region-wise percentage breakdown of purchase of glass bottles and silver spoons and visually represent the data in a 3-D cylindrical chart.
Counts:
Percentages by Region:
Unlock Deck
Unlock for access to all 50 flashcards in this deck.
Unlock Deck
k this deck
25
Use the data given below to answer the following question(s).
Following is the purchase order database of 'The Chef Says So', a restaurant in New York, over the last quarter (April-June).
Describe how to and construct a line chart exhibiting the purchase order of ceramic plates over the three months.
Following is the purchase order database of 'The Chef Says So', a restaurant in New York, over the last quarter (April-June).
Describe how to and construct a line chart exhibiting the purchase order of ceramic plates over the three months.
Unlock Deck
Unlock for access to all 50 flashcards in this deck.
Unlock Deck
k this deck
26
Use the data given below to answer the following question(s).
Following is an extract from the Cost per Order Database of Grogtes LLC.
Which of the following observations is closest to the third quartile?
A)35 N102 nuts for $190.40
B)59 S103 screws for $556.96
C)13 N103 nuts for $22.62
D)2 NG102 nailgun packs for $550.90
Following is an extract from the Cost per Order Database of Grogtes LLC.
Which of the following observations is closest to the third quartile?
A)35 N102 nuts for $190.40
B)59 S103 screws for $556.96
C)13 N103 nuts for $22.62
D)2 NG102 nailgun packs for $550.90
Unlock Deck
Unlock for access to all 50 flashcards in this deck.
Unlock Deck
k this deck
27
Use the data given below to answer the following question(s).
Following is an extract from the Employee Payroll Database of HFR Informatics Inc.
A graphical depiction of a frequency distribution for numerical data in the form of a column chart is called a ________.
A)cartogram
B)correlogram
C)histogram
D)dendogram
Following is an extract from the Employee Payroll Database of HFR Informatics Inc.
A graphical depiction of a frequency distribution for numerical data in the form of a column chart is called a ________.
A)cartogram
B)correlogram
C)histogram
D)dendogram
Unlock Deck
Unlock for access to all 50 flashcards in this deck.
Unlock Deck
k this deck
28
Use the data given below to answer the following question(s).
Following is the purchase order database of 'The Chef Says So', a restaurant in New York, over the last quarter (April-June).
Construct a PivotChart to visualize the purchase order total units for steel forks and ceramic bowls within each region.
Following is the purchase order database of 'The Chef Says So', a restaurant in New York, over the last quarter (April-June).
Construct a PivotChart to visualize the purchase order total units for steel forks and ceramic bowls within each region.
Unlock Deck
Unlock for access to all 50 flashcards in this deck.
Unlock Deck
k this deck
29
Use the data given below to answer the following question(s).
Following is the purchase order database of 'The Chef Says So', a restaurant in New York, over the last quarter (April-June).
Describe how to sort the data by inventory value to compute cumulative percentage of total inventory value to help the restaurateur conduct a Pareto analysis.(Assume that no damages were caused to the inventory purchased over the three months)
Unlock Deck
Unlock for access to all 50 flashcards in this deck.
Unlock Deck
k this deck
30
Use the data given below to answer the following question(s).
Following is an extract from the Cost per Order Database of Grogtes LLC.
Which of the following does the second quartile of the costs per order indicate?
A)2% of the costs per order are less than or equal to $114.84.
B)20% of the costs per order are less than or equal to $1,200.12.
C)5% of the costs per order are less than or equal to $229.36.
D)50% of the costs per order are less than or equal to $286.16.
Unlock Deck
Unlock for access to all 50 flashcards in this deck.
Unlock Deck
k this deck
31
Use the data given below to answer the following question(s).
Following is an extract from the Employee Payroll Database of HFR Informatics Inc.
The Excel 2010 function ________ computes the kᵗʰ percentile of data in the range specified in the array field, where k is in the range 0 to 1, inclusive.
A)PERCENTILE.INC(array, k)
B)PERCENTILE(array + k)
C)PERCENTILE.IF(array, k)
D)PERCENTILE(SUM(array), k)
Unlock Deck
Unlock for access to all 50 flashcards in this deck.
Unlock Deck
k this deck
32
Use the data given below to answer the following question(s).
Following is an extract from the Cost per Order Database of Grogtes LLC.
After choosing the PivotTable, the PivotChart can be found on the ________ tab.
A)Design
B)View
C)Options
D)Layout
Following is an extract from the Cost per Order Database of Grogtes LLC.
After choosing the PivotTable, the PivotChart can be found on the ________ tab.
A)Design
B)View
C)Options
D)Layout
Unlock Deck
Unlock for access to all 50 flashcards in this deck.
Unlock Deck
k this deck
33
Use the data given below to answer the following question(s).
Following is an extract from the Cost per Order Database of Grogtes LLC.
Which of the following is true about constructing PivotTables?
A)It is not possible to construct the PivotTable in the same worksheet.
B)Dragging a field into the Report Filter area allows addition of a third dimension to the analysis.
C)Placing a field each in the row and column labels will automatically sum the variable values in the table.
D)PivotTables cannot be duplicated by copying and pasting an existing table.
Unlock Deck
Unlock for access to all 50 flashcards in this deck.
Unlock Deck
k this deck
34
Use the data given below to answer the following question(s).
Following is an extract from the Cost per Order Database of Grogtes LLC.
Which of the following does the 38th percentile of the costs per order indicate?
A)17% of the costs per order are less than or equal to $190.40.
B)38% of the costs per order are less than or equal to $183.00.
C)83% of the costs per order are less than or equal to $10.44.
D)62% of the costs per order are less than or equal to $1,001.56.
Unlock Deck
Unlock for access to all 50 flashcards in this deck.
Unlock Deck
k this deck
35
Use the data given below to answer the following question(s).
Following is an extract from the Cost per Order Database of Grogtes LLC.
Which of the following will give the value for the third quartile?
A)PERCENTILE.INC(array, 0.75)
B)QUARTILE.INC(array, 0.75)
C)DECILE.INC(array, 0.30)
D)QUARTILE.INC(array, 0.25)
Following is an extract from the Cost per Order Database of Grogtes LLC.
Which of the following will give the value for the third quartile?
A)PERCENTILE.INC(array, 0.75)
B)QUARTILE.INC(array, 0.75)
C)DECILE.INC(array, 0.30)
D)QUARTILE.INC(array, 0.25)
Unlock Deck
Unlock for access to all 50 flashcards in this deck.
Unlock Deck
k this deck
36
Use the data given below to answer the following question(s).
Following is an extract from the Cost per Order Database of Grogtes LLC.
What is the rank of the 42ⁿᵈ percentile of the costs per order ?
A)17
B)13.35
C)19
D)33.75
Following is an extract from the Cost per Order Database of Grogtes LLC.
What is the rank of the 42ⁿᵈ percentile of the costs per order ?
A)17
B)13.35
C)19
D)33.75
Unlock Deck
Unlock for access to all 50 flashcards in this deck.
Unlock Deck
k this deck
37
Use the data given below to answer the following question(s).
Following is an extract from the Employee Payroll Database of HFR Informatics Inc.
While constructing a histogram, how is group width calculated?
A)number of groups × (lower limit of the last group + upper limit of the first group)
B) (upper limit of the last group - lower limit of the first group)/ number of groups
C) (upper limit of the first group + number of groups)× lower limit of the last group + number of groups)
D) (lower limit of the first group - number of groups)× upper limit of the last group
Unlock Deck
Unlock for access to all 50 flashcards in this deck.
Unlock Deck
k this deck
38
Use the data given below to answer the following question(s).
Following is an extract from the Cost per Order Database of Grogtes LLC.
Which of the following is true about quartiles?
A)The 25ᵗʰ percentile is called the fourth quartile.
B)One-fourth of the data fall below the fourth quartile.
C)Three-fourths of the data are below the third quartile.
D)The 50ᵗʰ quartile is the third percentile.
Unlock Deck
Unlock for access to all 50 flashcards in this deck.
Unlock Deck
k this deck
39
Use the data given below to answer the following question(s).
Following is an extract from the Cost per Order Database of Grogtes LLC.
Which of the following is true about cross-tabulation?
A)All subcategories together must constitute the complete data set.
B)A cross-tabulation table is often called a latent class model.
C)Each observation can be classified into many subcategories.
D)The table displays the number of categorical variables between two observations.
Unlock Deck
Unlock for access to all 50 flashcards in this deck.
Unlock Deck
k this deck
40
Use the data given below to answer the following question(s).
Following is an extract from the Employee Payroll Database of HFR Informatics Inc.
Which of the following represents the proportion of the total number of observations that fall at or below the upper limit of each group?
A)Percentile
B)Pareto chart
C)Frequency distribution
D)Cumulative relative frequency
Unlock Deck
Unlock for access to all 50 flashcards in this deck.
Unlock Deck
k this deck
41
Use the data given below to answer the following question(s).
Following is the purchase order database of 'The Chef Says So', a restaurant in New York, over the last quarter (April-June).
How does Excel distinguish between vertical and horizontal bar charts?
Following is the purchase order database of 'The Chef Says So', a restaurant in New York, over the last quarter (April-June).
How does Excel distinguish between vertical and horizontal bar charts?
Unlock Deck
Unlock for access to all 50 flashcards in this deck.
Unlock Deck
k this deck
42
Use the data given below to answer the following question(s).
Following is the purchase order database of 'The Chef Says So', a restaurant in New York, over the last quarter (April-June).
How is a frequency distribution calculated for categorical and numerical data?
Following is the purchase order database of 'The Chef Says So', a restaurant in New York, over the last quarter (April-June).
How is a frequency distribution calculated for categorical and numerical data?
Unlock Deck
Unlock for access to all 50 flashcards in this deck.
Unlock Deck
k this deck
43
Use the data given below to answer the following question(s).
Following is the purchase order database of 'The Chef Says So', a restaurant in New York, over the last quarter (April-June).
While constructing frequency distributions for numerical data, SUMIF is used to count the frequencies of each discrete value.
Following is the purchase order database of 'The Chef Says So', a restaurant in New York, over the last quarter (April-June).
While constructing frequency distributions for numerical data, SUMIF is used to count the frequencies of each discrete value.
Unlock Deck
Unlock for access to all 50 flashcards in this deck.
Unlock Deck
k this deck
44
Use the data given below to answer the following question(s).
Following is the purchase order database of 'The Chef Says So', a restaurant in New York, over the last quarter (April-June).
Elaborate on the use of geographic data mapping in business analytics.
Following is the purchase order database of 'The Chef Says So', a restaurant in New York, over the last quarter (April-June).
Elaborate on the use of geographic data mapping in business analytics.
Unlock Deck
Unlock for access to all 50 flashcards in this deck.
Unlock Deck
k this deck
45
Use the data given below to answer the following question(s).
Following is the purchase order database of 'The Chef Says So', a restaurant in New York, over the last quarter (April-June).
Explain statistics as defined by David Hand.What are the two ways in which Microsoft Excel supports statistical analysis?
Following is the purchase order database of 'The Chef Says So', a restaurant in New York, over the last quarter (April-June).
Explain statistics as defined by David Hand.What are the two ways in which Microsoft Excel supports statistical analysis?
Unlock Deck
Unlock for access to all 50 flashcards in this deck.
Unlock Deck
k this deck
46
Use the data given below to answer the following question(s).
Following is the purchase order database of 'The Chef Says So', a restaurant in New York, over the last quarter (April-June).
AutoFilter creates filtering criteria based on the type of data being filtered.
Following is the purchase order database of 'The Chef Says So', a restaurant in New York, over the last quarter (April-June).
AutoFilter creates filtering criteria based on the type of data being filtered.
Unlock Deck
Unlock for access to all 50 flashcards in this deck.
Unlock Deck
k this deck
47
Use the data given below to answer the following question(s).
Following is the purchase order database of 'The Chef Says So', a restaurant in New York, over the last quarter (April-June).
Specifying a Bin Range will allow Excel to automatically determine bin values for the frequency distribution and histogram.
Following is the purchase order database of 'The Chef Says So', a restaurant in New York, over the last quarter (April-June).
Specifying a Bin Range will allow Excel to automatically determine bin values for the frequency distribution and histogram.
Unlock Deck
Unlock for access to all 50 flashcards in this deck.
Unlock Deck
k this deck
48
Use the data given below to answer the following question(s).
Following is the purchase order database of 'The Chef Says So', a restaurant in New York, over the last quarter (April-June).
Explain with an example the filtering tool provided by Excel for simple criteria.
Following is the purchase order database of 'The Chef Says So', a restaurant in New York, over the last quarter (April-June).
Explain with an example the filtering tool provided by Excel for simple criteria.
Unlock Deck
Unlock for access to all 50 flashcards in this deck.
Unlock Deck
k this deck
49
Use the data given below to answer the following question(s).
Following is the purchase order database of 'The Chef Says So', a restaurant in New York, over the last quarter (April-June).
Fewer groups provide a "coarse" histogram.
Following is the purchase order database of 'The Chef Says So', a restaurant in New York, over the last quarter (April-June).
Fewer groups provide a "coarse" histogram.
Unlock Deck
Unlock for access to all 50 flashcards in this deck.
Unlock Deck
k this deck
50
Use the data given below to answer the following question(s).
Following is the purchase order database of 'The Chef Says So', a restaurant in New York, over the last quarter (April-June).
Changes to the type of chart, data included in the chart, and chart layout and styles can be made from the Layout tab.
Following is the purchase order database of 'The Chef Says So', a restaurant in New York, over the last quarter (April-June).
Changes to the type of chart, data included in the chart, and chart layout and styles can be made from the Layout tab.
Unlock Deck
Unlock for access to all 50 flashcards in this deck.
Unlock Deck
k this deck
Unlock Deck
Unlock for access to all 50 flashcards in this deck.


