Deck 7: Graphs, Statistics, and Probability
Full screen (f)
Question
Which of the following illustrations is a histogram?
A)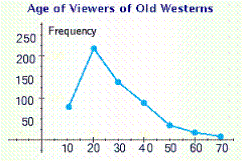
B)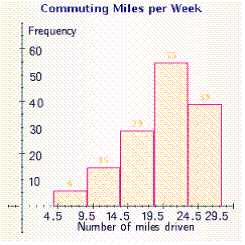
C)
D)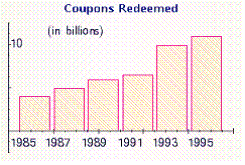
E)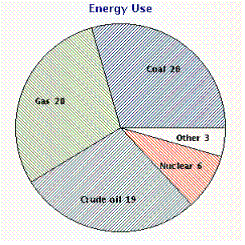
A)
B)
C)
D)
E)
Question
Question
If the symbol  = 1,800 cars, estimate what the symbol
  represents.
A) about 900 cars
B) about 1,800 cars
C) about 600 cars
D) about 500 cars
= 1,800 cars, estimate what the symbol represents.A) about 900 cars
B) about 1,800 cars
C) about 600 cars
D) about 500 cars
Question
Which of the following illustrations is a frequency polygon?
A)
B)
C)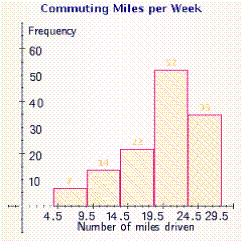
D)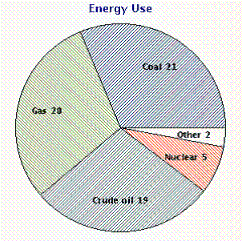
E)
A)
B)
C)
D)
E)
Question
Question
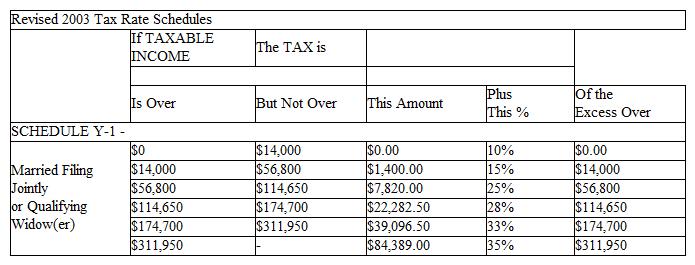
Raul has an adjusted income of $153,850, is married, and files jointly. Compute his tax.
A) $32,082.50
B) $10,976.00
C) $33,258.50
D) $22,282.50
E) $22,377.50
A) $32,082.50
B) $10,976.00
C) $33,258.50
D) $22,282.50
E) $22,377.50
Question
Which of the following illustrations is a pictograph?
A)
B)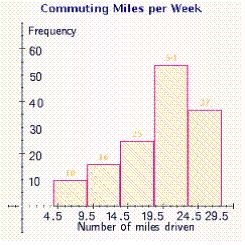
C)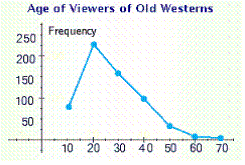
D)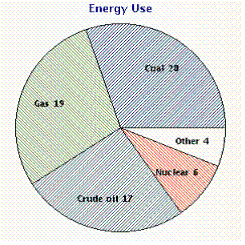
E)
A)
B)
C)
D)
E)
Question
Refer to the line graph.
At what times (A, B, C or D) do you find the following conditions: runner 1 running and runner 2 stopped?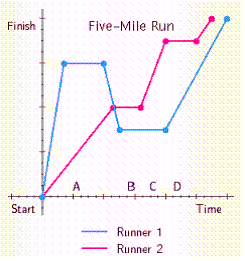
A) B only
B) D only
C) C and D
D) B and D
E) A and B
At what times (A, B, C or D) do you find the following conditions: runner 1 running and runner 2 stopped?
A) B only
B) D only
C) C and D
D) B and D
E) A and B
Question
Match between columns
Question
Refer to the pie graph that shows the world's languages and the percentages of the population that speak them.
What percentage of the world's population does not speak either Chinese or German?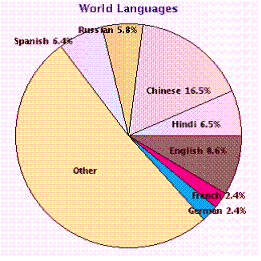
A) 97.6%
B) 81.1%
C) 90.2%
D) 4.8%
E) 91.6%
What percentage of the world's population does not speak either Chinese or German?
A) 97.6%
B) 81.1%
C) 90.2%
D) 4.8%
E) 91.6%
Question
Refer to the pictograph.
How much more money did parents spend than children?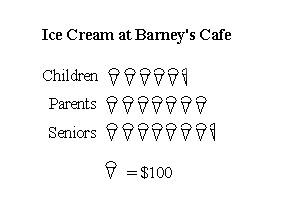
A) $150
B) $105
C) $175
D) $180
E) $145
How much more money did parents spend than children?
A) $150
B) $105
C) $175
D) $180
E) $145
Question
Refer to the line graph.
In approximately what year did miners begin to earn more than construction workers?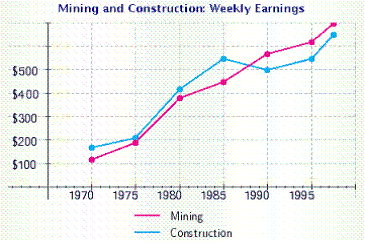
A) in 1992
B) in 1994
C) in 1988
D) in 1991
E) in 1986
In approximately what year did miners begin to earn more than construction workers?
A) in 1992
B) in 1994
C) in 1988
D) in 1991
E) in 1986
Question
Which of the following illustrations represents a circle graph?
A)
B)
C)
D)
E)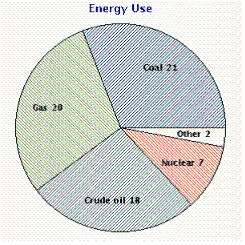
A)
B)
C)
D)
E)
Question
Use the data in the table to make a line graph showing the average acreage (in acres) of U.S. farms for the years 1950 through 1990.
A)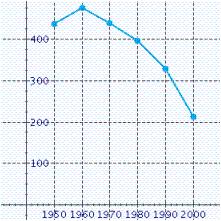
B)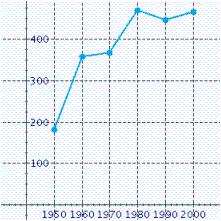
C)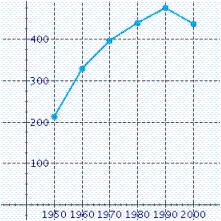
D)
E)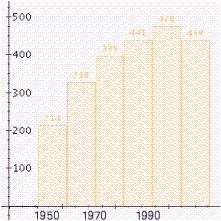
A)
B)
C)
D)
E)
Question
Use the data in the table to make a line graph showing the average acreage (in acres) of U.S. farms for the years 1950 through 1990.
A)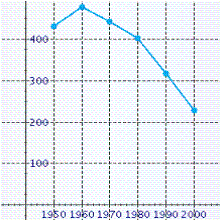
B)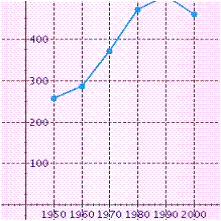
C)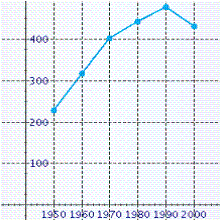
D)
E)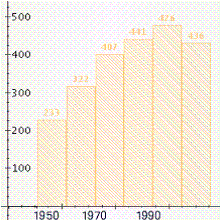
A)
B)
C)
D)
E)
Question
Which of the following illustrations best represents a bar graph?
A)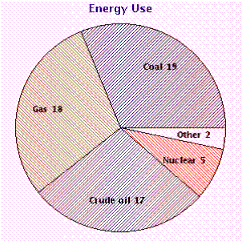
B)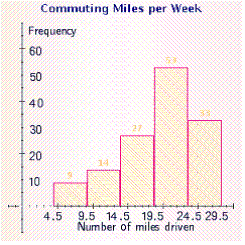
C)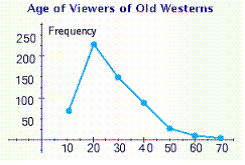
D)
E)
A)
B)
C)
D)
E)
Question
Question
Which of the following illustrations is a line graph?
A)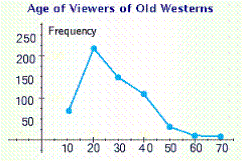
B)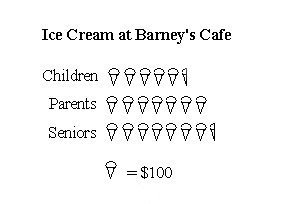
C)
D)
E)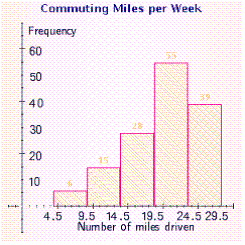
A)
B)
C)
D)
E)
Question
Question
Question
Question
Assume that the probability that an airplane engine will fail a test is  and that the aircraft in question has 4 engines. What is the sample space for the problem? Use N for not fail and F for fail.
and that the aircraft in question has 4 engines. What is the sample space for the problem? Use N for not fail and F for fail. Question
Question
Question
Question
Question
Question
Question
Question
Question
Question
Question
Use the following bar graph to find the average number of therms of natural gas used per month. 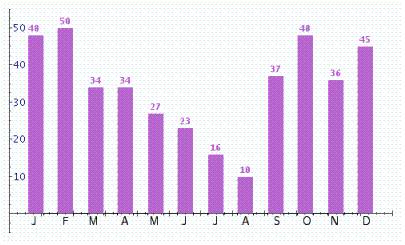
Question
Question
Question
Question
Question
Question
Question
Question
Question
Question
Refer to the following spinner. If the spinner is spun, what is the probability that the arrow will stop on green? Assume that the spinner never stops on a line. 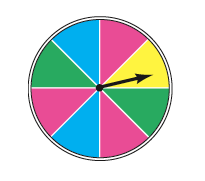
A)
B)
C)
D)
A)
B)
C)
D)
Question
Question

Unlock Deck
Sign up to unlock the cards in this deck!
Unlock Deck
Unlock Deck
1/45
Play
Full screen (f)
Deck 7: Graphs, Statistics, and Probability
1
Which of the following illustrations is a histogram?
A)
B)
C)
D)
E)
A)
B)
C)
D)
E)
2
To the nearest two million, how many people in the world speak French?
Is it possible to use circle graphs in this case?
A) True
B) False
Is it possible to use circle graphs in this case?
A) True
B) False
True
3
If the symbol = 1,800 cars, estimate what the symbol represents.
A) about 900 cars
B) about 1,800 cars
C) about 600 cars
D) about 500 cars
= 1,800 cars, estimate what the symbol represents.A) about 900 cars
B) about 1,800 cars
C) about 600 cars
D) about 500 cars
about 900 cars
4
Which of the following illustrations is a frequency polygon?
A)
B)
C)
D)
E)
A)
B)
C)
D)
E)
Unlock Deck
Unlock for access to all 45 flashcards in this deck.
Unlock Deck
k this deck
5
Find the mean of the list of data.
11, 13, 15, 15, 13, 11
A) 14
B) 12
C) 15
D) 11
E) 13
11, 13, 15, 15, 13, 11
A) 14
B) 12
C) 15
D) 11
E) 13
Unlock Deck
Unlock for access to all 45 flashcards in this deck.
Unlock Deck
k this deck
6
Raul has an adjusted income of $153,850, is married, and files jointly. Compute his tax.
A) $32,082.50
B) $10,976.00
C) $33,258.50
D) $22,282.50
E) $22,377.50
A) $32,082.50
B) $10,976.00
C) $33,258.50
D) $22,282.50
E) $22,377.50
Unlock Deck
Unlock for access to all 45 flashcards in this deck.
Unlock Deck
k this deck
7
Which of the following illustrations is a pictograph?
A)
B)
C)
D)
E)
A)
B)
C)
D)
E)
Unlock Deck
Unlock for access to all 45 flashcards in this deck.
Unlock Deck
k this deck
8
Refer to the line graph.
At what times (A, B, C or D) do you find the following conditions: runner 1 running and runner 2 stopped?
A) B only
B) D only
C) C and D
D) B and D
E) A and B
At what times (A, B, C or D) do you find the following conditions: runner 1 running and runner 2 stopped?
A) B only
B) D only
C) C and D
D) B and D
E) A and B
Unlock Deck
Unlock for access to all 45 flashcards in this deck.
Unlock Deck
k this deck
9
Match between columns
Unlock Deck
Unlock for access to all 45 flashcards in this deck.
Unlock Deck
k this deck
10
Refer to the pie graph that shows the world's languages and the percentages of the population that speak them.
What percentage of the world's population does not speak either Chinese or German?
A) 97.6%
B) 81.1%
C) 90.2%
D) 4.8%
E) 91.6%
What percentage of the world's population does not speak either Chinese or German?
A) 97.6%
B) 81.1%
C) 90.2%
D) 4.8%
E) 91.6%
Unlock Deck
Unlock for access to all 45 flashcards in this deck.
Unlock Deck
k this deck
11
Refer to the pictograph.
How much more money did parents spend than children?
A) $150
B) $105
C) $175
D) $180
E) $145
How much more money did parents spend than children?
A) $150
B) $105
C) $175
D) $180
E) $145
Unlock Deck
Unlock for access to all 45 flashcards in this deck.
Unlock Deck
k this deck
12
Refer to the line graph.
In approximately what year did miners begin to earn more than construction workers?
A) in 1992
B) in 1994
C) in 1988
D) in 1991
E) in 1986
In approximately what year did miners begin to earn more than construction workers?
A) in 1992
B) in 1994
C) in 1988
D) in 1991
E) in 1986
Unlock Deck
Unlock for access to all 45 flashcards in this deck.
Unlock Deck
k this deck
13
Which of the following illustrations represents a circle graph?
A)
B)
C)
D)
E)
A)
B)
C)
D)
E)
Unlock Deck
Unlock for access to all 45 flashcards in this deck.
Unlock Deck
k this deck
14
Use the data in the table to make a line graph showing the average acreage (in acres) of U.S. farms for the years 1950 through 1990.
A)
B)
C)
D)
E)
A)
B)
C)
D)
E)
Unlock Deck
Unlock for access to all 45 flashcards in this deck.
Unlock Deck
k this deck
15
Use the data in the table to make a line graph showing the average acreage (in acres) of U.S. farms for the years 1950 through 1990.
A)
B)
C)
D)
E)
A)
B)
C)
D)
E)
Unlock Deck
Unlock for access to all 45 flashcards in this deck.
Unlock Deck
k this deck
16
Which of the following illustrations best represents a bar graph?
A)
B)
C)
D)
E)
A)
B)
C)
D)
E)
Unlock Deck
Unlock for access to all 45 flashcards in this deck.
Unlock Deck
k this deck
17
Balls numbered from 1 to 38 are placed in a container and stirred. If one is drawn at random, what is the probability that the number is a prime number?
A)
B)
C)
D)
A)
B)
C)
D)
Unlock Deck
Unlock for access to all 45 flashcards in this deck.
Unlock Deck
k this deck
18
Which of the following illustrations is a line graph?
A)
B)
C)
D)
E)
A)
B)
C)
D)
E)
Unlock Deck
Unlock for access to all 45 flashcards in this deck.
Unlock Deck
k this deck
19
To study the effect of fluoride in preventing tooth decay, researchers counted the number of fillings in the teeth of 28 patients and recorded these results:
5, 7, 16, 21, 16, 23, 17, 8, 12, 3, 9, 2, 8, 17, 12, 19, 14, 10, 13, 8, 14, 15, 14, 14, 6, 10, 12, 11
Create a table to tally the results.
A) Number of fillings Frequency 1-5 3
6-10 9
11-15 12
16-20 7
21-25 2
B) Number of fillings Frequency 1-5 2
6-10 8
11-15 12
16-20 5
21-25 2
C) Number of fillings Frequency 1-5 3
6-10 8
11-15 12
16-20 5
21-25 1
D) Number of fillings Frequency 1-5 12
6-10 9
11-15 12
16-20 7
21-25 3
E) Number of fillings Frequency 1-5 3
6-10 8
11-15 10
16-20 5
21-25 2
Unlock Deck
Unlock for access to all 45 flashcards in this deck.
Unlock Deck
k this deck
20
How many more pet cats are there than pet dogs?
Is it possible to use bar graphs in this case?
A) True
B) False
Is it possible to use bar graphs in this case?
A) True
B) False
Unlock Deck
Unlock for access to all 45 flashcards in this deck.
Unlock Deck
k this deck
21
Find the mean of the list of data.
46, 62, 42, 32, 85, 57, 96, 104
A) 64.5
B) 68.5
C) 66.5
D) 65.5
E) 67.5
46, 62, 42, 32, 85, 57, 96, 104
A) 64.5
B) 68.5
C) 66.5
D) 65.5
E) 67.5
Unlock Deck
Unlock for access to all 45 flashcards in this deck.
Unlock Deck
k this deck
22
Assume that the probability that an airplane engine will fail a test is and that the aircraft in question has 4 engines. What is the sample space for the problem? Use N for not fail and F for fail.
and that the aircraft in question has 4 engines. What is the sample space for the problem? Use N for not fail and F for fail. Unlock Deck
Unlock for access to all 45 flashcards in this deck.
Unlock Deck
k this deck
23
Find the mode (if any) of the list of data.
16, 16, 18, 18, 16, 17, 18, 16
A) 16
B) 17
C) 16.5
D) 18
E) 15
16, 16, 18, 18, 16, 17, 18, 16
A) 16
B) 17
C) 16.5
D) 18
E) 15
Unlock Deck
Unlock for access to all 45 flashcards in this deck.
Unlock Deck
k this deck
24
Which of the following is the sample set for an experiment which involves tossing three coins?
A) HHH, TTT
B) HHH, HHT, HTT, TTT
C) HHH, HHT, HTH, THH, TTT
D) HHH, HHT, HTH, THH, TTH, THT, HTT, TTT
A) HHH, TTT
B) HHH, HHT, HTT, TTT
C) HHH, HHT, HTH, THH, TTT
D) HHH, HHT, HTH, THH, TTH, THT, HTT, TTT
Unlock Deck
Unlock for access to all 45 flashcards in this deck.
Unlock Deck
k this deck
25
List the sample set for an experiment which involves picking a one-digit number.
A) 1, 2, 3, 4, 5, 6, 7, 8, 9
B) 0, 1, 2, 3, 4, 5, 6, 7, 8, 9
C) 10
D)
A) 1, 2, 3, 4, 5, 6, 7, 8, 9
B) 0, 1, 2, 3, 4, 5, 6, 7, 8, 9
C) 10
D)
Unlock Deck
Unlock for access to all 45 flashcards in this deck.
Unlock Deck
k this deck
26
Find the semester grade point average for a student that received the following grades. Round to the nearest hundredth.
A) 2
B) 2.4
C) 1.92
D) 0.4
A) 2
B) 2.4
C) 1.92
D) 0.4
Unlock Deck
Unlock for access to all 45 flashcards in this deck.
Unlock Deck
k this deck
27
Find the mean of the list of data.
12, 14, 16, 16, 14, 12
A) 15
B) 13
C) 16
D) 17
E) 14
12, 14, 16, 16, 14, 12
A) 15
B) 13
C) 16
D) 17
E) 14
Unlock Deck
Unlock for access to all 45 flashcards in this deck.
Unlock Deck
k this deck
28
Several groceries reported differing prices for a bread. The prices are as follows: 2.3, 2.6, 3.2, 2.8, 3.1, 3, 2.2, 2, 2.8. Find the mean, median, and mode of the prices for a bread. Then find the range of the prices.
A) mean: $3.67, median: $3.8, mode: $1.8, range: $2.2
B) mean: $2.67, median: $2.8, mode: $2.8, range: $1.2
C) mean: $1.67, median: $4.8, mode: $3.8, range: $3.2
D) mean: $4.67, median: $1.8, mode: $4.8, range: $0.5
E) mean: $0.67, median: $5.8, mode: $0.8, range: $4.2
A) mean: $3.67, median: $3.8, mode: $1.8, range: $2.2
B) mean: $2.67, median: $2.8, mode: $2.8, range: $1.2
C) mean: $1.67, median: $4.8, mode: $3.8, range: $3.2
D) mean: $4.67, median: $1.8, mode: $4.8, range: $0.5
E) mean: $0.67, median: $5.8, mode: $0.8, range: $4.2
Unlock Deck
Unlock for access to all 45 flashcards in this deck.
Unlock Deck
k this deck
29
Several computer stores reported differing prices for a toner cartridge for a laser printer. The prices are as follows: 59, 50, 77, 70, 71, 73, 54, 56, 70. Find the mode of the prices for a toner cartridge.
A) $69
B) $70
C) $71
D) $72
E) $68
A) $69
B) $70
C) $71
D) $72
E) $68
Unlock Deck
Unlock for access to all 45 flashcards in this deck.
Unlock Deck
k this deck
30
Find the mode of these values:
4, 4, 8, 8, 4, 7, 8, 4
A) 4
B) 7
C) 5.5
D) 8
E) 3
4, 4, 8, 8, 4, 7, 8, 4
A) 4
B) 7
C) 5.5
D) 8
E) 3
Unlock Deck
Unlock for access to all 45 flashcards in this deck.
Unlock Deck
k this deck
31
The scores on the first exam of the students in a history class were 52, 57, 63, 62, 62, 62, 84, 82, 98, 91, and 100. Kia got a score of 85 and claims that "85 is better than average." Which of the three measures of central tendency is she better than: the mean, the median, or the mode?
A) better than the mean
B) worse than the mean
C) better than the mode
D) worse than the median
E) better than the median
F) worse than the mode
A) better than the mean
B) worse than the mean
C) better than the mode
D) worse than the median
E) better than the median
F) worse than the mode
Unlock Deck
Unlock for access to all 45 flashcards in this deck.
Unlock Deck
k this deck
32
Find the weighted mean of a set of values. Round to the nearest tenth.
A) 2.2
B) 38.8
C) 15.5
D) 2.5
A) 2.2
B) 38.8
C) 15.5
D) 2.5
Unlock Deck
Unlock for access to all 45 flashcards in this deck.
Unlock Deck
k this deck
33
Use the following bar graph to find the average number of therms of natural gas used per month.
Unlock Deck
Unlock for access to all 45 flashcards in this deck.
Unlock Deck
k this deck
34
Frank's algebra grade is based on the average of four exams, which will count equally. His grades are 85, 70, 70 and 85. Find his average.
A) 72.5
B) 77.5
C) 82.5
D) 92.5
E) 87.5
A) 72.5
B) 77.5
C) 82.5
D) 92.5
E) 87.5
Unlock Deck
Unlock for access to all 45 flashcards in this deck.
Unlock Deck
k this deck
35
Find the median of the list of data.
15, 18, 20, 29, 34, 44
A) 22.5
B) 29
C) 20
D) 24.5
E) 26.7
15, 18, 20, 29, 34, 44
A) 22.5
B) 29
C) 20
D) 24.5
E) 26.7
Unlock Deck
Unlock for access to all 45 flashcards in this deck.
Unlock Deck
k this deck
36
Roberto received the same score on each of five exams, and his mean score is 84. Find his median score and his modal score.
A) median 79, mode 74
B) median 89, mode 89
C) median 84, mode 84
D) median 74, mode 74
E) median 89, mode 79
A) median 79, mode 74
B) median 89, mode 89
C) median 84, mode 84
D) median 74, mode 74
E) median 89, mode 79
Unlock Deck
Unlock for access to all 45 flashcards in this deck.
Unlock Deck
k this deck
37
Find the mean of the list of data.
48, 67, 44, 37, 80, 52, 92, 108
A) 65
B) 64
C) 67
D) 66
E) 68
48, 67, 44, 37, 80, 52, 92, 108
A) 65
B) 64
C) 67
D) 66
E) 68
Unlock Deck
Unlock for access to all 45 flashcards in this deck.
Unlock Deck
k this deck
38
The class results on a mathematical quiz are shown in the table below. Find the average number of incorrect answers on the quiz.
A) 2
B) 5.4
C) 9
D) 1.8
A) 2
B) 5.4
C) 9
D) 1.8
Unlock Deck
Unlock for access to all 45 flashcards in this deck.
Unlock Deck
k this deck
39
Find the median of the list of data.
0, 0, 4, 7, 0 , 0, 4, 7, 9
A) 0
B) 7
C) 3
D) 4
E) 9
0, 0, 4, 7, 0 , 0, 4, 7, 9
A) 0
B) 7
C) 3
D) 4
E) 9
Unlock Deck
Unlock for access to all 45 flashcards in this deck.
Unlock Deck
k this deck
40
The magnitudes of the major earthquakes in 1999 are listed below.
Find the mean, median, and mode of the magnitudes. Round to the nearest tenth.
A) mean 7.2; mode 7; median 7.3
B) mean 7.3; mode 7.2; median 7.2
C) mean 7.4; mode 7.2; median 7.2
D) mean 7.3; mode 7.1; median 7.2
E) mean 7.2; mode 7.1; median 7.2
Find the mean, median, and mode of the magnitudes. Round to the nearest tenth.
A) mean 7.2; mode 7; median 7.3
B) mean 7.3; mode 7.2; median 7.2
C) mean 7.4; mode 7.2; median 7.2
D) mean 7.3; mode 7.1; median 7.2
E) mean 7.2; mode 7.1; median 7.2
Unlock Deck
Unlock for access to all 45 flashcards in this deck.
Unlock Deck
k this deck
41
What is the event " getting an odd number and a tails " for the experiment of rolling a die and then tossing a coin?
A) E = { (1, H), (3, H), (5, H) }
B) E = { (2, T), (4, T), (6, T) }
C) E = { (2, H), (4, H), (6, H) }
D) E = { (1, T), (3, T), (5, T) }
A) E = { (1, H), (3, H), (5, H) }
B) E = { (2, T), (4, T), (6, T) }
C) E = { (2, H), (4, H), (6, H) }
D) E = { (1, T), (3, T), (5, T) }
Unlock Deck
Unlock for access to all 45 flashcards in this deck.
Unlock Deck
k this deck
42
What is the event " getting at least one tails " for the experiment of tossing a coin twice?
A) E = { (T, T), (H, T), (T, H) }
B) E = { (H, H), (H, T), (T, H), (T, T) }
C) E = { (H, H), (H, T), (T, H) }
D) E = { (H, T), (T, H) }
A) E = { (T, T), (H, T), (T, H) }
B) E = { (H, H), (H, T), (T, H), (T, T) }
C) E = { (H, H), (H, T), (T, H) }
D) E = { (H, T), (T, H) }
Unlock Deck
Unlock for access to all 45 flashcards in this deck.
Unlock Deck
k this deck
43
Refer to the following spinner. If the spinner is spun, what is the probability that the arrow will stop on green? Assume that the spinner never stops on a line.
A)
B)
C)
D)
A)
B)
C)
D)
Unlock Deck
Unlock for access to all 45 flashcards in this deck.
Unlock Deck
k this deck
44
What is the event " getting numbers, whose sum is more then 6 " for the experiment of rolling a die twice?
A) E = { (1, 1),(1, 2), (1, 3), (1, 4), (2, 1), (2, 2), (2, 3), (3, 1), (3, 2), (4, 1) }
B) E = { (1, 1), (2, 2), (3, 3), (4, 4), (5, 5), (6, 6) }
C) E = { (1, 6), (2, 5), (2, 6), (3, 4), (3, 5), (3, 6), (4, 3), (4, 4), (4, 5), (4, 6), (5, 2), (5, 3), (5, 4), (5, 5), (5, 6), (6, 1), (6, 2), (6, 3), (6, 4), (6, 5), (6, 6) }
D) An event cannot happen
Unlock Deck
Unlock for access to all 45 flashcards in this deck.
Unlock Deck
k this deck
45
An ordinary die is rolled once. What is the probability of rolling an even number?
A)
B)
C)
D)
A)
B)
C)
D)
Unlock Deck
Unlock for access to all 45 flashcards in this deck.
Unlock Deck
k this deck
Unlock Deck
Unlock for access to all 45 flashcards in this deck.


