Deck 2: Basic Descriptive Statistics Tables Percentages Rates and Ratios and Graphs
Full screen (f)
Question
Question
Question
Question
Question
Question
Question
Question
Question
Question
Question
Question
Question
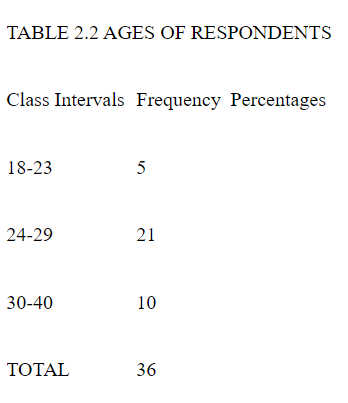
If we added a cumulative percentage column to Table 2.2 and began our calculations with the 18-23 interval, the entry in the 30-40 interval would be________.
A) 10%
B) 33.3%
C) 37%
D) 100%
Question
Question
Question
Question
Question
A possible problem with Table 2.2 is that________.
A) class intervals overlap
B) class intervals are too large
C) class intervals are unequal in size
D) class intervals are exhaustive
Question
Question
Question
Question
Question
Question
Question
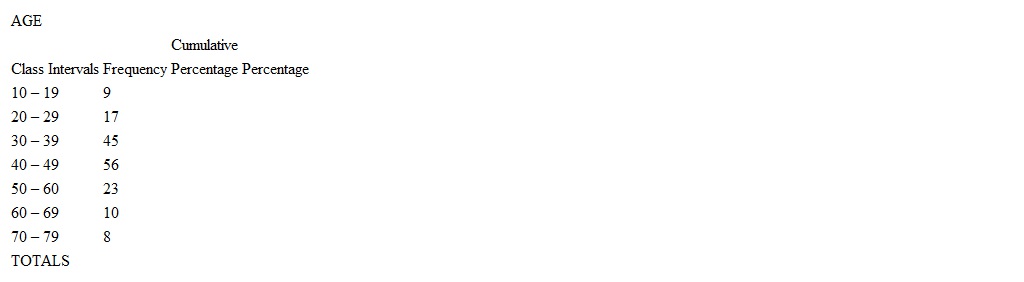
The frequency distribution below displays the distribution of age for a sample drawn from a community. Finish the table by completing the columns for percentages, and cumulative percentages.
Question
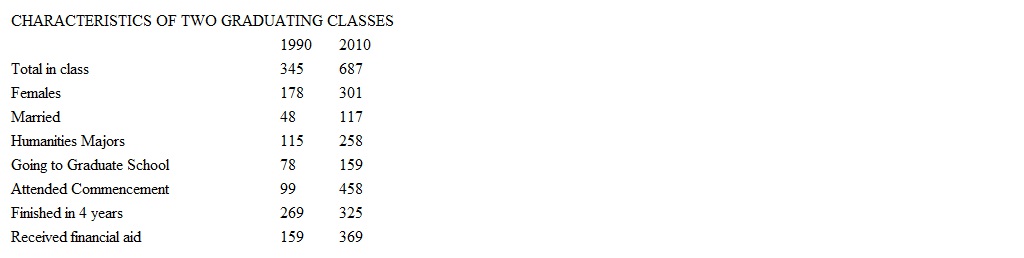
You are the Dean of students at a college and the President has asked for some information about how the student body has changed over the years. You have collected the following information regarding the number of students in various categories for two different graduating classes:
 What will you say to the president when she asks:
a. What percentage of the graduating class was female in 1990?________ 2010?
b. What percentage of the glass was going to graduate school in 2010? ______ Has this percentage gone up or down since 1990 and by how much? (Hint: Compute the percentage change to measure the amount of change between the two times)
c. What proportion of the graduating class attended the commencement ceremony in 2010?______ Has this proportion gone up or down since 1990 and by how much?
d. What proportion of the class majored in the humanities in 1990? ________ 2010?
e. What percent of students received financial aid in 1990? ________ 2010?
f. Relatively speaking, how many students finished in just four years in 1990? _______ 2010? How has this percentage changed between the two years?
g. What proportion of students were married in 1990? ________ 2010?
h. Write a paragraph describing the changes in the graduating classes of 1990 and 2010.
What changes seem especially important? Why?
What will you say to the president when she asks: a. What percentage of the graduating class was female in 1990?________ 2010?
b. What percentage of the glass was going to graduate school in 2010? ______ Has this percentage gone up or down since 1990 and by how much? (Hint: Compute the percentage change to measure the amount of change between the two times)
c. What proportion of the graduating class attended the commencement ceremony in 2010?______ Has this proportion gone up or down since 1990 and by how much?
d. What proportion of the class majored in the humanities in 1990? ________ 2010?
e. What percent of students received financial aid in 1990? ________ 2010?
f. Relatively speaking, how many students finished in just four years in 1990? _______ 2010? How has this percentage changed between the two years?
g. What proportion of students were married in 1990? ________ 2010?
h. Write a paragraph describing the changes in the graduating classes of 1990 and 2010.
What changes seem especially important? Why?
Question
Question
Question

Unlock Deck
Sign up to unlock the cards in this deck!
Unlock Deck
Unlock Deck
1/29
Play
Full screen (f)
Deck 2: Basic Descriptive Statistics Tables Percentages Rates and Ratios and Graphs
1
A city of 1567 people had 34 auto thefts last year. The auto theft rate for this city________.
A) cannot be determined from the information given.
B) is falling.
C) is (34/1567) x 100,000.
D) is (100,000 x 1567)/34.
A) cannot be determined from the information given.
B) is falling.
C) is (34/1567) x 100,000.
D) is (100,000 x 1567)/34.
C
2
When examining a single categorical variable with emphasis on the differences between two or more categories, it is best to use a________.
A) bar chart.
B) histogram.
C) line chart.
D) None of these choices are correct.
A) bar chart.
B) histogram.
C) line chart.
D) None of these choices are correct.
A
3
On January 1, 2013, a police department implemented tougher patrols for drunk driving. The number of drunk driving fatalities in the jurisdiction was 32 in 2012, and 23 in 2013. By what percentage did the new patrols reduce fatalities?
A) 25%
B) 28%
C) 39%
D) 42%
A) 25%
B) 28%
C) 39%
D) 42%
B
4
If class intervals overlap with one another, there will be issues of________.
A) categories not being exhaustive.
B) categories not being mutually exclusive.
C) categories being of unequal size.
D) All of these choices are correct.
A) categories not being exhaustive.
B) categories not being mutually exclusive.
C) categories being of unequal size.
D) All of these choices are correct.
Unlock Deck
Unlock for access to all 29 flashcards in this deck.
Unlock Deck
k this deck
5
The class intervals below represent ages of respondents. Which set of intervals is both exhaustive and mutually exclusive?
A) 18-19, 19-20, 20-21
B) 18-19, 20-21, 22-23
C) 18-20, 22-24, 26-28
D) 18-19, 21-22, 24-25
A) 18-19, 19-20, 20-21
B) 18-19, 20-21, 22-23
C) 18-20, 22-24, 26-28
D) 18-19, 21-22, 24-25
Unlock Deck
Unlock for access to all 29 flashcards in this deck.
Unlock Deck
k this deck
6
The purpose of univariate descriptive statistics is to________.
A) summarize relationships between many variables.
B) display the essential meaning of variables measured at the interval-ratio level.
C) combine nominal and discrete variables.
D) summarize a single variable.
A) summarize relationships between many variables.
B) display the essential meaning of variables measured at the interval-ratio level.
C) combine nominal and discrete variables.
D) summarize a single variable.
Unlock Deck
Unlock for access to all 29 flashcards in this deck.
Unlock Deck
k this deck
7
Frequency distributions may be compiled for variables measured at which level?
A) Nominal
B) Ordinal
C) Interval-ratio
D) All of the answer choices.
A) Nominal
B) Ordinal
C) Interval-ratio
D) All of the answer choices.
Unlock Deck
Unlock for access to all 29 flashcards in this deck.
Unlock Deck
k this deck
8
A small town of 1,709 residents had one homicide in the past year. The homicide rate for this town________.
A) cannot be determined from the information given.
B) is (1/1709) x 100,000.
C) is rising.
D) is (1709:1) x 1,000.
A) cannot be determined from the information given.
B) is (1/1709) x 100,000.
C) is rising.
D) is (1709:1) x 1,000.
Unlock Deck
Unlock for access to all 29 flashcards in this deck.
Unlock Deck
k this deck
9
To calculate a proportion, the number of cases in any category (f) is divided by________.
A) the total number of categories (k).
B) the number of cases in all categories (N).
C) the cases in that category (f).
D) the number of cases in adjacent categories (k-1).
A) the total number of categories (k).
B) the number of cases in all categories (N).
C) the cases in that category (f).
D) the number of cases in adjacent categories (k-1).
Unlock Deck
Unlock for access to all 29 flashcards in this deck.
Unlock Deck
k this deck
10
Cumulative frequencies and cumulative percentages allow a researcher to________.
A) be sure the column totals are correct.
B) tell at a glance how many cases fall above or below a given category.
C) show the accuracy of his or her findings.
D) All of the answer choices.
A) be sure the column totals are correct.
B) tell at a glance how many cases fall above or below a given category.
C) show the accuracy of his or her findings.
D) All of the answer choices.
Unlock Deck
Unlock for access to all 29 flashcards in this deck.
Unlock Deck
k this deck
11
When constructing a frequency distribution, the number of class intervals, in general, should be________.
A) more than 20.
B) about 10.
C) only 2.
D) the same as the number of cases.
A) more than 20.
B) about 10.
C) only 2.
D) the same as the number of cases.
Unlock Deck
Unlock for access to all 29 flashcards in this deck.
Unlock Deck
k this deck
12
For the following stated limits:________.________.23-30, 31-38, 39-46 what are the real limits?
A) 22-31, 31-38, 38-45
B) 23-29, 29-38, 38-46
C) 23.0-29.9, 30.0-37.9, 38.0-46.9
D) 22.5-30.5, 30.5-38.5, 38.5-46.5
A) 22-31, 31-38, 38-45
B) 23-29, 29-38, 38-46
C) 23.0-29.9, 30.0-37.9, 38.0-46.9
D) 22.5-30.5, 30.5-38.5, 38.5-46.5
Unlock Deck
Unlock for access to all 29 flashcards in this deck.
Unlock Deck
k this deck
13
If we added a cumulative percentage column to Table 2.2 and began our calculations with the 18-23 interval, the entry in the 30-40 interval would be________.
A) 10%
B) 33.3%
C) 37%
D) 100%
Unlock Deck
Unlock for access to all 29 flashcards in this deck.
Unlock Deck
k this deck
14
The crude birth rate of a city that has 250 births in a year and a population of 7500 would be found by using which of the following?
A) crude birth rate = (250/7500) x 1000
B) crude birth rate = 7500/250
C) crude birth rate = (1000/7500) x 250
D) crude birth rate = (250/1000) x 7500
A) crude birth rate = (250/7500) x 1000
B) crude birth rate = 7500/250
C) crude birth rate = (1000/7500) x 250
D) crude birth rate = (250/1000) x 7500
Unlock Deck
Unlock for access to all 29 flashcards in this deck.
Unlock Deck
k this deck
15
Which of the following is an impossible value for a percentage?
A) 0.0%
B) 47.458923%
C) 110.00%
D) 0.05%
A) 0.0%
B) 47.458923%
C) 110.00%
D) 0.05%
Unlock Deck
Unlock for access to all 29 flashcards in this deck.
Unlock Deck
k this deck
16
Proportions and percentages, ratios and rates are all ways of expressing________.
A) concise distributions of a variable.
B) data without leaving out any details.
C) relative frequencies.
D) raw frequencies.
A) concise distributions of a variable.
B) data without leaving out any details.
C) relative frequencies.
D) raw frequencies.
Unlock Deck
Unlock for access to all 29 flashcards in this deck.
Unlock Deck
k this deck
17
A _____ is the number of times a phenomenon occurs divided by the total possible occurrences.
A) rate
B) frequency distribution
C) ratio
D) histogram
A) rate
B) frequency distribution
C) ratio
D) histogram
Unlock Deck
Unlock for access to all 29 flashcards in this deck.
Unlock Deck
k this deck
18
A possible problem with Table 2.2 is that________.
A) class intervals overlap
B) class intervals are too large
C) class intervals are unequal in size
D) class intervals are exhaustive
Unlock Deck
Unlock for access to all 29 flashcards in this deck.
Unlock Deck
k this deck
19
If 60 cases range in score from 4 to 84 and you want 10 intervals in a frequency distribution, approximately what will be the width of each interval?
A) 4
B) 8
C) 12
D) 60
A) 4
B) 8
C) 12
D) 60
Unlock Deck
Unlock for access to all 29 flashcards in this deck.
Unlock Deck
k this deck
20
When constructing frequency distributions for variables measured at the interval-ratio level, approximate interval size (or interval width) can be found by________.
A) dividing sample size (N) by 10.
B) multiplying the number of categories by the lowest score.
C) dividing the range by the sample size (N).
D) dividing the range (R) by the number of categories (k).
A) dividing sample size (N) by 10.
B) multiplying the number of categories by the lowest score.
C) dividing the range by the sample size (N).
D) dividing the range (R) by the number of categories (k).
Unlock Deck
Unlock for access to all 29 flashcards in this deck.
Unlock Deck
k this deck
21
For a single variable measured at the nominal level, an appropriate graph would be a________.
A) pie chart.
B) histogram.
C) frequency polygon.
D) bivariate table.
A) pie chart.
B) histogram.
C) frequency polygon.
D) bivariate table.
Unlock Deck
Unlock for access to all 29 flashcards in this deck.
Unlock Deck
k this deck
22
The graphical presentation method that uses midpoints rather than real limits is a________.
A) pie chart.
B) line chart.
C) histogram.
D) bar chart.
A) pie chart.
B) line chart.
C) histogram.
D) bar chart.
Unlock Deck
Unlock for access to all 29 flashcards in this deck.
Unlock Deck
k this deck
23
Forty of every two hundred students attend all of their classes. What percentage of the student body is this?
A) 5%
B) 50%
C) 2%
D) 20%
A) 5%
B) 50%
C) 2%
D) 20%
Unlock Deck
Unlock for access to all 29 flashcards in this deck.
Unlock Deck
k this deck
24
Histograms and line charts or frequency polygons are used with data measured at the________.
A) nominal level.
B) ordinal level.
C) interval-ratio level.
D) any level.
A) nominal level.
B) ordinal level.
C) interval-ratio level.
D) any level.
Unlock Deck
Unlock for access to all 29 flashcards in this deck.
Unlock Deck
k this deck
25
The frequency distribution below displays the distribution of age for a sample drawn from a community. Finish the table by completing the columns for percentages, and cumulative percentages.
Unlock Deck
Unlock for access to all 29 flashcards in this deck.
Unlock Deck
k this deck
26
You are the Dean of students at a college and the President has asked for some information about how the student body has changed over the years. You have collected the following information regarding the number of students in various categories for two different graduating classes:
What will you say to the president when she asks:
a. What percentage of the graduating class was female in 1990?________ 2010?
b. What percentage of the glass was going to graduate school in 2010? ______ Has this percentage gone up or down since 1990 and by how much? (Hint: Compute the percentage change to measure the amount of change between the two times)
c. What proportion of the graduating class attended the commencement ceremony in 2010?______ Has this proportion gone up or down since 1990 and by how much?
d. What proportion of the class majored in the humanities in 1990? ________ 2010?
e. What percent of students received financial aid in 1990? ________ 2010?
f. Relatively speaking, how many students finished in just four years in 1990? _______ 2010? How has this percentage changed between the two years?
g. What proportion of students were married in 1990? ________ 2010?
h. Write a paragraph describing the changes in the graduating classes of 1990 and 2010.
What changes seem especially important? Why?
What will you say to the president when she asks: a. What percentage of the graduating class was female in 1990?________ 2010?
b. What percentage of the glass was going to graduate school in 2010? ______ Has this percentage gone up or down since 1990 and by how much? (Hint: Compute the percentage change to measure the amount of change between the two times)
c. What proportion of the graduating class attended the commencement ceremony in 2010?______ Has this proportion gone up or down since 1990 and by how much?
d. What proportion of the class majored in the humanities in 1990? ________ 2010?
e. What percent of students received financial aid in 1990? ________ 2010?
f. Relatively speaking, how many students finished in just four years in 1990? _______ 2010? How has this percentage changed between the two years?
g. What proportion of students were married in 1990? ________ 2010?
h. Write a paragraph describing the changes in the graduating classes of 1990 and 2010.
What changes seem especially important? Why?
Unlock Deck
Unlock for access to all 29 flashcards in this deck.
Unlock Deck
k this deck
27
A researcher wants to visually display the U.S. divorce rate (a continuous, interval-ratio level variable) for the last 50 years. An appropriate format would be________.
A) a line chart or histogram.
B) only a histogram.
C) a pie chart.
D) None of the answer choices. Data in the form of rate should never be displayed in a chart or graph.
A) a line chart or histogram.
B) only a histogram.
C) a pie chart.
D) None of the answer choices. Data in the form of rate should never be displayed in a chart or graph.
Unlock Deck
Unlock for access to all 29 flashcards in this deck.
Unlock Deck
k this deck
28
For a single variable at the interval-ratio level, an appropriate graph would be________.
A) a pie chart.
B) a histogram.
C) a bivariate table.
D) None of the answer choices. Graphs are never used for interval-ratio level variables.
A) a pie chart.
B) a histogram.
C) a bivariate table.
D) None of the answer choices. Graphs are never used for interval-ratio level variables.
Unlock Deck
Unlock for access to all 29 flashcards in this deck.
Unlock Deck
k this deck
29
Twenty-three of the 50 states rejected a proposed constitutional amendment to make the house fly the National Insect. What percentage is this?
A) 23%
B) 25%
C) 46%
D) 54%
A) 23%
B) 25%
C) 46%
D) 54%
Unlock Deck
Unlock for access to all 29 flashcards in this deck.
Unlock Deck
k this deck
Unlock Deck
Unlock for access to all 29 flashcards in this deck.


