Deck 4: Measures of Variation
Full screen (f)
Question
Question
The expression  instructs us to ________.
A) square the sum of the scores.
B) sum the squared scores.
C) sum the squared deviations.
D) square the summed deviations.
instructs us to ________.A) square the sum of the scores.
B) sum the squared scores.
C) sum the squared deviations.
D) square the summed deviations.
Question
Question
Question
Question
The expression  instructs us to _______.
A) sum the scores.
B) sum the scores and then subtract the mean.
C) subtract every "ith" score from the mean.
D) subtract the mean from each score and add up the deviations.
instructs us to _______.A) sum the scores.
B) sum the scores and then subtract the mean.
C) subtract every "ith" score from the mean.
D) subtract the mean from each score and add up the deviations.
Question
Question
Question
Question
Question
Question
Question
Question
Question
Question
Question
Question
Question
The information below compares the final exam grades for 2 biology classes: 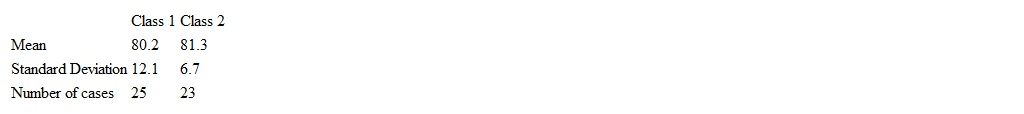 What may we conclude? Class 1 _______.
A) is more homogeneous.
B) is more heterogeneous.
C) was a better class.
D) had no grade higher than a 90.
What may we conclude? Class 1 _______.A) is more homogeneous.
B) is more heterogeneous.
C) was a better class.
D) had no grade higher than a 90.
Question
Question
Question
Question
Question
Question
Question
Question
Question
Question
Question
Question
Question
Question
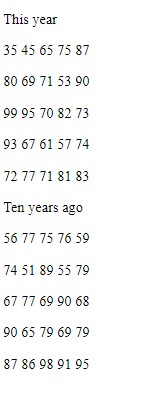
The scores below are from the same final exam given in a math class in two different years. Compute the mean and median (if necessary) and the range and standard deviation of these scores. Using these statistics, describe the differences in the two sets of scores.
Question
Question
Question
Some information about auto theft rates (number of auto thefts per 100,000 population) for a sample of 178 cities in two different years is summarized below.
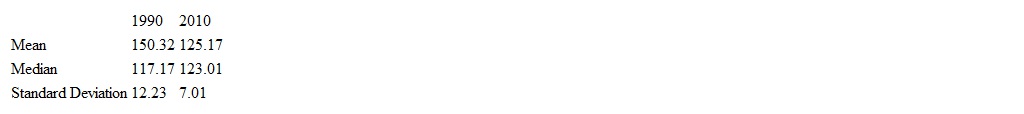 Express this statistical information in words. What changes were there in the overall shape of the variation of this variable? In central tendency? In dispersion?
Express this statistical information in words. What changes were there in the overall shape of the variation of this variable? In central tendency? In dispersion? Question

Unlock Deck
Sign up to unlock the cards in this deck!
Unlock Deck
Unlock Deck
1/37
Play
Full screen (f)
Deck 4: Measures of Variation
1
Four students have applied to a special program and only one can be accepted. They have taken a battery of 12 tests and all have exactly the same average score. The standard deviation of their test scores are: Student A = 3.12, Student B = 0.27, Student C = 13.45, Student D = 6.45. If consistency of performance is a criterion for acceptance, which of the four students should be selected?
A) A
B) B
C) C
D) D
A) A
B) B
C) C
D) D
B
2
The expression instructs us to ________.
A) square the sum of the scores.
B) sum the squared scores.
C) sum the squared deviations.
D) square the summed deviations.
instructs us to ________.A) square the sum of the scores.
B) sum the squared scores.
C) sum the squared deviations.
D) square the summed deviations.
C
3
As a distribution of scores becomes more variable, the value of the standard deviation________.
A) decreases.
B) stays the same.
C) increases.
D) becomes unpredictable.
A) decreases.
B) stays the same.
C) increases.
D) becomes unpredictable.
increases.
4
If distribution A and distribution B have the same mean but A has a larger standard deviation, we may conclude that________.
A) the medians of both distributions would be the same.
B) distribution B has a range of 0.
C) A has a greater degree of variation.
D) distribution B displays more variety.
A) the medians of both distributions would be the same.
B) distribution B has a range of 0.
C) A has a greater degree of variation.
D) distribution B displays more variety.
Unlock Deck
Unlock for access to all 37 flashcards in this deck.
Unlock Deck
k this deck
5
Which measure of variation is most important and most commonly used in social science research?
A) The range
B) The average deviation
C) The median
D) The standard deviation
A) The range
B) The average deviation
C) The median
D) The standard deviation
Unlock Deck
Unlock for access to all 37 flashcards in this deck.
Unlock Deck
k this deck
6
The expression instructs us to _______.
A) sum the scores.
B) sum the scores and then subtract the mean.
C) subtract every "ith" score from the mean.
D) subtract the mean from each score and add up the deviations.
instructs us to _______.A) sum the scores.
B) sum the scores and then subtract the mean.
C) subtract every "ith" score from the mean.
D) subtract the mean from each score and add up the deviations.
Unlock Deck
Unlock for access to all 37 flashcards in this deck.
Unlock Deck
k this deck
7
The greater the skew of a distribution of scores, ________.
A) the lower the value of the standard deviation.
B) the higher the value of the standard deviation.
C) the lower the value of the range.
D) None of the answer choices: measures of variation are not affected by skew.
A) the lower the value of the standard deviation.
B) the higher the value of the standard deviation.
C) the lower the value of the range.
D) None of the answer choices: measures of variation are not affected by skew.
Unlock Deck
Unlock for access to all 37 flashcards in this deck.
Unlock Deck
k this deck
8
According to the data presented in the text, incomes in the US are________.
A) falling for the average family.
B) rising for everyone except the very rich.
C) decreasing in variation (income inequality is decreasing).
D) increasing in variation (income inequality is increasing).
A) falling for the average family.
B) rising for everyone except the very rich.
C) decreasing in variation (income inequality is decreasing).
D) increasing in variation (income inequality is increasing).
Unlock Deck
Unlock for access to all 37 flashcards in this deck.
Unlock Deck
k this deck
9
Measures of variation provide information about the________.
A) typical or most common score.
B) variety within the distribution of scores.
C) size of the sample.
D) adequacy of the selection criteria for the sample.
A) typical or most common score.
B) variety within the distribution of scores.
C) size of the sample.
D) adequacy of the selection criteria for the sample.
Unlock Deck
Unlock for access to all 37 flashcards in this deck.
Unlock Deck
k this deck
10
The lower limit for the standard deviation is 0; the upper limit is________.
A) the score of the mean.
B) the score of the median.
C) a function of the number of cases.
D) undefined; there is no upper limit.
A) the score of the mean.
B) the score of the median.
C) a function of the number of cases.
D) undefined; there is no upper limit.
Unlock Deck
Unlock for access to all 37 flashcards in this deck.
Unlock Deck
k this deck
11
If a variable is interval-ratio in level of measurement, the preferred measure of variation would be________.
A) the mean.
B) the range.
C) the standard deviation.
D) the percentile.
A) the mean.
B) the range.
C) the standard deviation.
D) the percentile.
Unlock Deck
Unlock for access to all 37 flashcards in this deck.
Unlock Deck
k this deck
12
Which of the following is a correct description of the distribution of income in the US since the 1960s?
A) The mean income has risen but the median has fallen.
B) Both the mean and the median have risen but the mean has increased more.
C) There is a noticeable negative skew in the distribution.
D) The distribution has grown less variable.
A) The mean income has risen but the median has fallen.
B) Both the mean and the median have risen but the mean has increased more.
C) There is a noticeable negative skew in the distribution.
D) The distribution has grown less variable.
Unlock Deck
Unlock for access to all 37 flashcards in this deck.
Unlock Deck
k this deck
13
When you subtract the value of the mean from each score in a distribution and then add the results, the sum will be________.
A) 0.
B) the standard deviation.
C) the variance.
D) a positive number.
A) 0.
B) the standard deviation.
C) the variance.
D) a positive number.
Unlock Deck
Unlock for access to all 37 flashcards in this deck.
Unlock Deck
k this deck
14
If the standard deviation of a group of scores is 0,________.
A) the range would be at a maximum value.
B) there is maximum variation in the scores.
C) there is no variation in the scores.
D) the mean is larger than the median.
A) the range would be at a maximum value.
B) there is maximum variation in the scores.
C) there is no variation in the scores.
D) the mean is larger than the median.
Unlock Deck
Unlock for access to all 37 flashcards in this deck.
Unlock Deck
k this deck
15
If the variance of a distribution is 16, the mean is 12, and the number of cases is 24, the standard deviation is________.
A) 4.
B) 6.
C) 8.
D) 12.
A) 4.
B) 6.
C) 8.
D) 12.
Unlock Deck
Unlock for access to all 37 flashcards in this deck.
Unlock Deck
k this deck
16
Measures of central tendency (like the mean) and measures of variation (like the range) provide information about distributions of scores which is________.
A) contradictory.
B) redundant.
C) unnecessary.
D) complementary.
A) contradictory.
B) redundant.
C) unnecessary.
D) complementary.
Unlock Deck
Unlock for access to all 37 flashcards in this deck.
Unlock Deck
k this deck
17
The standard deviation(s)________.
A) squares the deviations to eliminate negative values.
B) decreases in value as distributions become more heterogeneous.
C) does not use all the scores.
D) is based on the median rather than the mean.
A) squares the deviations to eliminate negative values.
B) decreases in value as distributions become more heterogeneous.
C) does not use all the scores.
D) is based on the median rather than the mean.
Unlock Deck
Unlock for access to all 37 flashcards in this deck.
Unlock Deck
k this deck
18
The age of a sample has been measured in years. Which of the following would be the preferred measure of the variation for this variable?
A) The index of qualitative variation
B) The average deviation
C) The quartile deviation
D) The standard deviation
A) The index of qualitative variation
B) The average deviation
C) The quartile deviation
D) The standard deviation
Unlock Deck
Unlock for access to all 37 flashcards in this deck.
Unlock Deck
k this deck
19
The information below compares the final exam grades for 2 biology classes: What may we conclude? Class 1 _______.
A) is more homogeneous.
B) is more heterogeneous.
C) was a better class.
D) had no grade higher than a 90.
What may we conclude? Class 1 _______.A) is more homogeneous.
B) is more heterogeneous.
C) was a better class.
D) had no grade higher than a 90.
Unlock Deck
Unlock for access to all 37 flashcards in this deck.
Unlock Deck
k this deck
20
The income of a sample has been measured in dollars per year. Which of the following would be the preferred measure of the variation for this variable?
A) The index of qualitative variation
B) The average deviation
C) The quartile deviation
D) The standard deviation
A) The index of qualitative variation
B) The average deviation
C) The quartile deviation
D) The standard deviation
Unlock Deck
Unlock for access to all 37 flashcards in this deck.
Unlock Deck
k this deck
21
In a boxplot, an outlier is defined as a score that is________.
A) greater than 1.5 times the height of the box.
B) less than 1.5 times the height of the box.
C) greater than 1.25 times the height of the box.
D) greater than 0.75 times the height of the box.
A) greater than 1.5 times the height of the box.
B) less than 1.5 times the height of the box.
C) greater than 1.25 times the height of the box.
D) greater than 0.75 times the height of the box.
Unlock Deck
Unlock for access to all 37 flashcards in this deck.
Unlock Deck
k this deck
22
The distances between the scores and the mean are called________.
A) deviations.
B) differences.
C) ranges.
D) summations.
A) deviations.
B) differences.
C) ranges.
D) summations.
Unlock Deck
Unlock for access to all 37 flashcards in this deck.
Unlock Deck
k this deck
23
The interquartile range would be an appropriate measure of variation for________.
A) nominal level variables.
B) continuous interval-ratio level variables only.
C) ordinal level variables.
D) discrete interval-ratio level variables only.
A) nominal level variables.
B) continuous interval-ratio level variables only.
C) ordinal level variables.
D) discrete interval-ratio level variables only.
Unlock Deck
Unlock for access to all 37 flashcards in this deck.
Unlock Deck
k this deck
24
The second quartile (Q2) is equal in value to________.
A) the mode.
B) the median.
C) the mean.
D) the range.
A) the mode.
B) the median.
C) the mean.
D) the range.
Unlock Deck
Unlock for access to all 37 flashcards in this deck.
Unlock Deck
k this deck
25
A boxplot uses what to show the range of scores?
A) slices
B) bars
C) points
D) whiskers
A) slices
B) bars
C) points
D) whiskers
Unlock Deck
Unlock for access to all 37 flashcards in this deck.
Unlock Deck
k this deck
26
A boxplot uses all but which of the following to present dispersion?
A) median
B) third quartile (Q 3 )
C) standard deviation
D) first quartile (Q 1 )
A) median
B) third quartile (Q 3 )
C) standard deviation
D) first quartile (Q 1 )
Unlock Deck
Unlock for access to all 37 flashcards in this deck.
Unlock Deck
k this deck
27
When measures of central tendency and dispersion are presented in the literature, the number of cases may vary from variable to variable. This is because________.
A) the researchers only used a subset of their sample for convenience purposes.
B) cases were missing values for that variable.
C) the variable in those cases was measured at a different level.
D) none of these choices are correct.
A) the researchers only used a subset of their sample for convenience purposes.
B) cases were missing values for that variable.
C) the variable in those cases was measured at a different level.
D) none of these choices are correct.
Unlock Deck
Unlock for access to all 37 flashcards in this deck.
Unlock Deck
k this deck
28
If a distribution of scores has a mean of 30 and a range of 0________.
A) the variance is 30.
B) the quartile deviation (Q) is 10.
C) there is no variation in the distribution.
D) the standard deviation is 1.
A) the variance is 30.
B) the quartile deviation (Q) is 10.
C) there is no variation in the distribution.
D) the standard deviation is 1.
Unlock Deck
Unlock for access to all 37 flashcards in this deck.
Unlock Deck
k this deck
29
A graph used to visualize and analyze variation is a________.
A) pie chart.
B) boxplot.
C) histogram.
D) line chart.
A) pie chart.
B) boxplot.
C) histogram.
D) line chart.
Unlock Deck
Unlock for access to all 37 flashcards in this deck.
Unlock Deck
k this deck
30
Your score on the test is the same as the third quartile (Q3). You may conclude that________.
A) you scored higher than 75% of the people who took the test.
B) the distribution of the scores is skewed.
C) your score is 'typical' since it is the same value as the median.
D) you scored higher than 25% of the people who took the test.
A) you scored higher than 75% of the people who took the test.
B) the distribution of the scores is skewed.
C) your score is 'typical' since it is the same value as the median.
D) you scored higher than 25% of the people who took the test.
Unlock Deck
Unlock for access to all 37 flashcards in this deck.
Unlock Deck
k this deck
31
Which of the following data sets shows the greatest variability?
A) 9, 10, 11
B) 0, 5, 9
C) 50, 60, 170
D) 31, 33, 35
A) 9, 10, 11
B) 0, 5, 9
C) 50, 60, 170
D) 31, 33, 35
Unlock Deck
Unlock for access to all 37 flashcards in this deck.
Unlock Deck
k this deck
32
Since the 1960s, the income associated with the 80th percentile has ________ and the income associated with the 20th percentile has ________.
A) risen, risen
B) stayed roughly the same, risen
C) fallen, risen
D) risen, stayed roughly the same
A) risen, risen
B) stayed roughly the same, risen
C) fallen, risen
D) risen, stayed roughly the same
Unlock Deck
Unlock for access to all 37 flashcards in this deck.
Unlock Deck
k this deck
33
The scores below are from the same final exam given in a math class in two different years. Compute the mean and median (if necessary) and the range and standard deviation of these scores. Using these statistics, describe the differences in the two sets of scores.
Unlock Deck
Unlock for access to all 37 flashcards in this deck.
Unlock Deck
k this deck
34
Measures of variation indicate the degree to which a set of scores is________.
A) heterogeneous.
B) ambiguous.
C) average.
D) typical.
A) heterogeneous.
B) ambiguous.
C) average.
D) typical.
Unlock Deck
Unlock for access to all 37 flashcards in this deck.
Unlock Deck
k this deck
35
Boxplots depict________.
A) central tendency.
B) dispersion.
C) both central tendency and dispersion.
D) None of these choices are correct.
A) central tendency.
B) dispersion.
C) both central tendency and dispersion.
D) None of these choices are correct.
Unlock Deck
Unlock for access to all 37 flashcards in this deck.
Unlock Deck
k this deck
36
Some information about auto theft rates (number of auto thefts per 100,000 population) for a sample of 178 cities in two different years is summarized below.
Express this statistical information in words. What changes were there in the overall shape of the variation of this variable? In central tendency? In dispersion?
Express this statistical information in words. What changes were there in the overall shape of the variation of this variable? In central tendency? In dispersion? Unlock Deck
Unlock for access to all 37 flashcards in this deck.
Unlock Deck
k this deck
37
The range (R) is found by subtracting the lowest from the highest score in the distribution. Therefore, R could NOT be found for________.
A) nominal level variables.
B) discrete variables.
C) ordinal level variables.
D) continuous variables.
A) nominal level variables.
B) discrete variables.
C) ordinal level variables.
D) continuous variables.
Unlock Deck
Unlock for access to all 37 flashcards in this deck.
Unlock Deck
k this deck
Unlock Deck
Unlock for access to all 37 flashcards in this deck.


