Deck 20: Creating Formulas and Charting Data
Full screen (f)
Question
Question
Question
Question
Question
Question
Question
Question
Question
Question
Question
Question
Question
Question
Question
Question
Question
Question
Question
Question
Question
Question
Question
Question
Question
Question
Question
Question
Question
Question

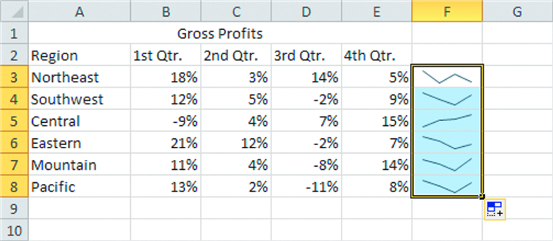
The accompanying figure shows ____ in column F.
A) sparklines
B) embedded charts
C) chart sheets
D) functions
Question
Question
Question
Using _____ is an easy method to apply formatting to data and convert the same data into a chart.
A) AutoCorrect
B) sparklines
C) Quick Analysis
D) Quick Data
Question
Question
Question
Question
Question
Question
Question
Question
Match between columns
Question

Unlock Deck
Sign up to unlock the cards in this deck!
Unlock Deck
Unlock Deck
1/42
Play
Full screen (f)
Deck 20: Creating Formulas and Charting Data
1
The first step in building a chart is to decide what type of chart you want to create.
True
2
Which of the following is NOT true about creating formulas?
A) Multiplication and division are performed before addition and subtraction.
B) When entering the cell reference, the column letters must be uppercase.
C) Calculations in parentheses are performed first.
D) Generally, cell references are used in formulas instead of the actual value.
A) Multiplication and division are performed before addition and subtraction.
B) When entering the cell reference, the column letters must be uppercase.
C) Calculations in parentheses are performed first.
D) Generally, cell references are used in formulas instead of the actual value.
B
3
The = SUM function adds up the number of cells containing values in the specified range. ____________________
False
4
An error value appears if the cell is not wide enough to show the result.
Unlock Deck
Unlock for access to all 42 flashcards in this deck.
Unlock Deck
k this deck
5
A(n) ____ cell reference does not change when the formula is copied or moved.
A) mixed
B) complex
C) absolute
D) relative
A) mixed
B) complex
C) absolute
D) relative
Unlock Deck
Unlock for access to all 42 flashcards in this deck.
Unlock Deck
k this deck
6
A cell reference that contains both relative and absolute references is called a(n) mixed cell reference. ____________________
Unlock Deck
Unlock for access to all 42 flashcards in this deck.
Unlock Deck
k this deck
7
The COUNT and SUM functions are interchangeable.
Unlock Deck
Unlock for access to all 42 flashcards in this deck.
Unlock Deck
k this deck
8
To create a minus sign in a formula, use the hyphen key.
Unlock Deck
Unlock for access to all 42 flashcards in this deck.
Unlock Deck
k this deck
9
____ formulas perform calculations that describe large quantities of data.
A) Complex
B) Embedded
C) Statistical
D) Mathematical
A) Complex
B) Embedded
C) Statistical
D) Mathematical
Unlock Deck
Unlock for access to all 42 flashcards in this deck.
Unlock Deck
k this deck
10
When creating formulas, there must be a closing parenthesis for every opening parenthesis.
Unlock Deck
Unlock for access to all 42 flashcards in this deck.
Unlock Deck
k this deck
11
All Excel formulas begin with ____.
A) the equal sign
B) a number
C) a value
D) an operand
A) the equal sign
B) a number
C) a value
D) an operand
Unlock Deck
Unlock for access to all 42 flashcards in this deck.
Unlock Deck
k this deck
12
A shortcut to entering cell references is to name a range of cells.
Unlock Deck
Unlock for access to all 42 flashcards in this deck.
Unlock Deck
k this deck
13
3D references used in summary worksheets condense and total data from other worksheets.
Unlock Deck
Unlock for access to all 42 flashcards in this deck.
Unlock Deck
k this deck
14
With the AutoComplete feature, the worksheet is scanned and a range of cells to sum is selected. ___________________
Unlock Deck
Unlock for access to all 42 flashcards in this deck.
Unlock Deck
k this deck
15
A(n) embedded chart is created on the same sheet as the data used in the chart. ____________________
Unlock Deck
Unlock for access to all 42 flashcards in this deck.
Unlock Deck
k this deck
16
You can change the sequence in which a formula is solved by using hyphens.
Unlock Deck
Unlock for access to all 42 flashcards in this deck.
Unlock Deck
k this deck
17
You can create multiple sparklines within a worksheet at the same time.
Unlock Deck
Unlock for access to all 42 flashcards in this deck.
Unlock Deck
k this deck
18
The equation used to calculate values in a cell is known as a(n) function . ____________________
Unlock Deck
Unlock for access to all 42 flashcards in this deck.
Unlock Deck
k this deck
19
____ formulas perform calculations that you could perform using a scientific calculator.
A) Complex
B) Embedded
C) Statistical
D) Mathematical
A) Complex
B) Embedded
C) Statistical
D) Mathematical
Unlock Deck
Unlock for access to all 42 flashcards in this deck.
Unlock Deck
k this deck
20
The formula =$A1 contains an absolute reference.
Unlock Deck
Unlock for access to all 42 flashcards in this deck.
Unlock Deck
k this deck
21
The ____________________ reference enables you to access data from three different dimensions in the workbook.
Unlock Deck
Unlock for access to all 42 flashcards in this deck.
Unlock Deck
k this deck
22
Rajit wants to display the data in his worksheet using graphics. Rajit knows that all of the following are true about charts EXCEPT: ____.
A) You cannot change the type of a chart.
B) You can resize a chart by dragging a sizing handle on the canvas.
C) To remove a chart element, select it, and then press Delete.
D) An embedded chart is useful if you want to view the chart and the data at the same time.
A) You cannot change the type of a chart.
B) You can resize a chart by dragging a sizing handle on the canvas.
C) To remove a chart element, select it, and then press Delete.
D) An embedded chart is useful if you want to view the chart and the data at the same time.
Unlock Deck
Unlock for access to all 42 flashcards in this deck.
Unlock Deck
k this deck
23
Tyler is teaching Eleni how to perform calculations in her Excel worksheet. Tyler tells Eleni that ____ is an absolute cell reference.
A) A1
B) $A1
C) A$1
D) $A$1
A) A1
B) $A1
C) A$1
D) $A$1
Unlock Deck
Unlock for access to all 42 flashcards in this deck.
Unlock Deck
k this deck
24
The ____ error occurs when the wrong type of argument or operand is used.
A) #VALUE!
B) #N/A
C) ####
D) #REF!
A) #VALUE!
B) #N/A
C) ####
D) #REF!
Unlock Deck
Unlock for access to all 42 flashcards in this deck.
Unlock Deck
k this deck
25
The ____ is a value, a cell reference, a range, or text used in a function.
A) operator
B) argument
C) operand
D) formula
A) operator
B) argument
C) operand
D) formula
Unlock Deck
Unlock for access to all 42 flashcards in this deck.
Unlock Deck
k this deck
26
A(n) ____________________ is a graphic representation of your worksheet data.
Unlock Deck
Unlock for access to all 42 flashcards in this deck.
Unlock Deck
k this deck
27
Rajit wants to display the data in his worksheet using graphics. Rajit decides to show snapshots of the data for each row in his worksheet. He inserts ____.
A) functions
B) sparklines
C) charts
D) graphics
A) functions
B) sparklines
C) charts
D) graphics
Unlock Deck
Unlock for access to all 42 flashcards in this deck.
Unlock Deck
k this deck
28
Which of the following is NOT true about charts?
A) Charts are used to draw or present conclusions about data.
B) If a chart is not set up correctly, the representation can be confusing or misleading.
C) When creating a chart, the first step is to decide what type of chart you want to create.
D) All charts have a horizontal and vertical axis.
A) Charts are used to draw or present conclusions about data.
B) If a chart is not set up correctly, the representation can be confusing or misleading.
C) When creating a chart, the first step is to decide what type of chart you want to create.
D) All charts have a horizontal and vertical axis.
Unlock Deck
Unlock for access to all 42 flashcards in this deck.
Unlock Deck
k this deck
29
Two non-adjacent cells are distinguished in a function using a ____.
A) comma
B) colon
C) semicolon
D) hyphen
A) comma
B) colon
C) semicolon
D) hyphen
Unlock Deck
Unlock for access to all 42 flashcards in this deck.
Unlock Deck
k this deck
30
The accompanying figure shows ____ in column F.
A) sparklines
B) embedded charts
C) chart sheets
D) functions
Unlock Deck
Unlock for access to all 42 flashcards in this deck.
Unlock Deck
k this deck
31
A(n) ____________________ is a symbol that indicates the mathematical operation to perform.
Unlock Deck
Unlock for access to all 42 flashcards in this deck.
Unlock Deck
k this deck
32
Tyler is teaching Eleni how to perform calculations in her Excel worksheet. Tyler tells Eleni that the * (asterisk) character is used to represent ____.
A) addition
B) subtraction
C) multiplication
D) division
A) addition
B) subtraction
C) multiplication
D) division
Unlock Deck
Unlock for access to all 42 flashcards in this deck.
Unlock Deck
k this deck
33
Using _____ is an easy method to apply formatting to data and convert the same data into a chart.
A) AutoCorrect
B) sparklines
C) Quick Analysis
D) Quick Data
Unlock Deck
Unlock for access to all 42 flashcards in this deck.
Unlock Deck
k this deck
34
Rather than manually re-entering the values of a column or row, use the ____________________ feature to identify the most logical cells to add.
Unlock Deck
Unlock for access to all 42 flashcards in this deck.
Unlock Deck
k this deck
35
The ____ error occurs when the contents of cells referred to by other formulas are deleted.
A) #VALUE!
B) #N/A
C) ####
D) #REF!
A) #VALUE!
B) #N/A
C) ####
D) #REF!
Unlock Deck
Unlock for access to all 42 flashcards in this deck.
Unlock Deck
k this deck
36
Which of the following is NOT true about creating a function?
A) Several common functions are available by clicking a button on the Ribbon.
B) You can collapse and expand the Function Arguments dialog box.
C) You can drag the fill handle to copy a formula across a column.
D) All of the above are true.
A) Several common functions are available by clicking a button on the Ribbon.
B) You can collapse and expand the Function Arguments dialog box.
C) You can drag the fill handle to copy a formula across a column.
D) All of the above are true.
Unlock Deck
Unlock for access to all 42 flashcards in this deck.
Unlock Deck
k this deck
37
Formulas containing more than one operator are called ____________________ formulas.
Unlock Deck
Unlock for access to all 42 flashcards in this deck.
Unlock Deck
k this deck
38
The ____ function multiplies values in the specified cells.
A) =PRODUCT
B) =SUM
C) =COUNT
D) =MEDIAN
A) =PRODUCT
B) =SUM
C) =COUNT
D) =MEDIAN
Unlock Deck
Unlock for access to all 42 flashcards in this deck.
Unlock Deck
k this deck
39
For help with choosing the appropriate chart for your data, use the _____ command.
A) AutoChart
B) Chart Filter
C) Data Labels
D) Recommended Charts
A) AutoChart
B) Chart Filter
C) Data Labels
D) Recommended Charts
Unlock Deck
Unlock for access to all 42 flashcards in this deck.
Unlock Deck
k this deck
40
The ____ error occurs when the column is not wide enough or a negative date is entered.
A) #VALUE!
B) #N/A
C) ####
D) #REF!
A) #VALUE!
B) #N/A
C) ####
D) #REF!
Unlock Deck
Unlock for access to all 42 flashcards in this deck.
Unlock Deck
k this deck
41
Match between columns
Unlock Deck
Unlock for access to all 42 flashcards in this deck.
Unlock Deck
k this deck
42
What is the difference between a function and a formula? List two types of functions available in Excel. Describe how you would use the following functions: SUM, AVERAGE, COUNT, and MIN.
Unlock Deck
Unlock for access to all 42 flashcards in this deck.
Unlock Deck
k this deck
Unlock Deck
Unlock for access to all 42 flashcards in this deck.


