Deck 4: Discrete Probability Distributions
Full screen (f)
Question
A student has five motor vehicle accidents in one year and claims that having five accidents is not unusual.
Use the frequency distribution below to determine if the student is correct.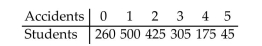
Use the frequency distribution below to determine if the student is correct.
Question
Question
Question
Question
Question
Question
A sports analyst records the winners of NASCAR Winston Cup races for a recent season. The random variable
x represents the races won by a driver in one season. Use the frequency distribution to construct a probability
distribution.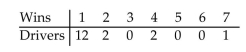
x represents the races won by a driver in one season. Use the frequency distribution to construct a probability
distribution.
Question
A sports announcer researched the performance of baseball players in the World Series. The random variable x
represents the number of of hits a player had in the series. Use the frequency distribution to construct a
probability distribution.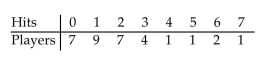
represents the number of of hits a player had in the series. Use the frequency distribution to construct a
probability distribution.
Question
Question
An insurance actuary asked a sample of senior citizens the cause of their automobile accidents over a two -year
period. The random variable x represents the number of accidents caused by their failure to yield the right of
way. Use the frequency distribution to construct a probability distribution.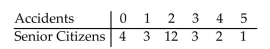
period. The random variable x represents the number of accidents caused by their failure to yield the right of
way. Use the frequency distribution to construct a probability distribution.
Question
Question
A baseball player gets four hits during the World Series and a sports announcer claims that getting four or
more hits is not unusual. Use the frequency distribution below to determine if the sports announcer is correct.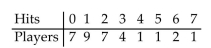
more hits is not unusual. Use the frequency distribution below to determine if the sports announcer is correct.
Question
Question
Question
Determine whether the number line represents a discrete random variable or a continuous random variable. Explain your reasoning.
The attendance at games for a sports team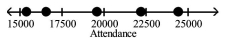
A)Discrete; Attendance is a random variable that is countable.
B)Continuous; Attendance is a random variable that must be measured.
The attendance at games for a sports team
A)Discrete; Attendance is a random variable that is countable.
B)Continuous; Attendance is a random variable that must be measured.
Question
Question
Question
Determine whether the number line represents a discrete random variable or a continuous random variable. Explain your reasoning.
The length of time college students study each week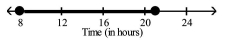
A)Continuous; Time is a random variable that must be measured.
B)Discrete; Time is a random variable that is countable.
The length of time college students study each week
A)Continuous; Time is a random variable that must be measured.
B)Discrete; Time is a random variable that is countable.
Question
Question
Question
Question
Question
Question
Determine whether the distribution represents a probability distribution. If not, identify any requirements that
are not satisfied.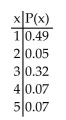
are not satisfied.
Question
Use the frequency distribution to (a)construct a probability distribution for the random variable x which
represents the number of cars per household in a town of 1000 households, and (b)graph the distribution.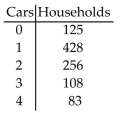
represents the number of cars per household in a town of 1000 households, and (b)graph the distribution.
Question
The random variable x represents the number of credit cards that adults have along with the corresponding
probabilities. Graph the probability distribution.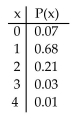
probabilities. Graph the probability distribution.
Question
Determine whether the distribution represents a probability distribution. If not, identify any requirements that
are not satisfied.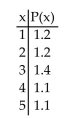
are not satisfied.
Question
Question
Determine whether the distribution represents a probability distribution. If not, identify any requirements that
are not satisfied.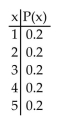
are not satisfied.
Question
Determine whether the distribution represents a probability distribution. If not, identify any requirements that
are not satisfied.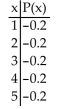
are not satisfied.
Question
In a pizza takeout restaurant, the following probability distribution was obtained. The random variable x
represents the number of toppings for a large pizza. Graph the probability distribution.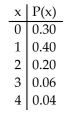
represents the number of toppings for a large pizza. Graph the probability distribution.
Question
Question
Question
Question
Question
The random variable x represents the number of tests that a patient entering a hospital will have along with the
corresponding probabilities. Graph the probability distribution.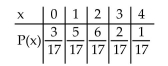
corresponding probabilities. Graph the probability distribution.
Question
Question
Determine whether the distribution represents a probability distribution. If not, identify any requirements that
are not satisfied.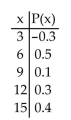
are not satisfied.
Question
Question
Question
Question
Question
Question
Question
Question
Question
Question
Question
From the probability distribution, find the mean and standard deviation for the random variable x, which
represents the number of cars per household in a town of 1000 households.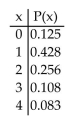
represents the number of cars per household in a town of 1000 households.
Question
Question
Question
Question
Question
Question
Question
Question
Question
Question
Question
Question
Question
Question
Question
Question
Question
Question
Question
Question
Question
Question
Question
Question
Question
Question
Question
Question
Question
Question
Question

Unlock Deck
Sign up to unlock the cards in this deck!
Unlock Deck
Unlock Deck
1/103
Play
Full screen (f)
Deck 4: Discrete Probability Distributions
1
A student has five motor vehicle accidents in one year and claims that having five accidents is not unusual.
Use the frequency distribution below to determine if the student is correct.
Use the frequency distribution below to determine if the student is correct.
The student is not correct. For a student to have five accidents is unusual because the probability of this event is 0.026.
2
State whether the variable is discrete or continuous. The blood pressures of a group of students the day before their final exam
A)continuous
B)discrete
A)continuous
B)discrete
continuous
3
State whether the variable is discrete or continuous. The number of pills in a container of vitamins
A)discrete
B)continuous
A)discrete
B)continuous
discrete
4
State whether the variable is discrete or continuous. The number of cups of coffee sold in a cafeteria during lunch
A)discrete
B)continuous
A)discrete
B)continuous
Unlock Deck
Unlock for access to all 103 flashcards in this deck.
Unlock Deck
k this deck
5
State whether the variable is discrete or continuous. The number of phone calls to the attendance office of a high school on any given school day
A)discrete
B)continuous
A)discrete
B)continuous
Unlock Deck
Unlock for access to all 103 flashcards in this deck.
Unlock Deck
k this deck
6
The random variable x represents the number of cars per household in a town of 1000 households. Find the probability of randomly selecting a household that has at least one car.
A)0.875
B)0.125
C)0.500
D)0.083
A)0.875
B)0.125
C)0.500
D)0.083
Unlock Deck
Unlock for access to all 103 flashcards in this deck.
Unlock Deck
k this deck
7
A sports analyst records the winners of NASCAR Winston Cup races for a recent season. The random variable
x represents the races won by a driver in one season. Use the frequency distribution to construct a probability
distribution.
x represents the races won by a driver in one season. Use the frequency distribution to construct a probability
distribution.
Unlock Deck
Unlock for access to all 103 flashcards in this deck.
Unlock Deck
k this deck
8
A sports announcer researched the performance of baseball players in the World Series. The random variable x
represents the number of of hits a player had in the series. Use the frequency distribution to construct a
probability distribution.
represents the number of of hits a player had in the series. Use the frequency distribution to construct a
probability distribution.
Unlock Deck
Unlock for access to all 103 flashcards in this deck.
Unlock Deck
k this deck
9
State whether the variable is discrete or continuous. The age of the oldest student in a statistics class
A)continuous
B)discrete
A)continuous
B)discrete
Unlock Deck
Unlock for access to all 103 flashcards in this deck.
Unlock Deck
k this deck
10
An insurance actuary asked a sample of senior citizens the cause of their automobile accidents over a two -year
period. The random variable x represents the number of accidents caused by their failure to yield the right of
way. Use the frequency distribution to construct a probability distribution.
period. The random variable x represents the number of accidents caused by their failure to yield the right of
way. Use the frequency distribution to construct a probability distribution.
Unlock Deck
Unlock for access to all 103 flashcards in this deck.
Unlock Deck
k this deck
11
State whether the variable is discrete or continuous. The speed of a car on a Los Angeles freeway during rush hour traffic
A)continuous
B)discrete
A)continuous
B)discrete
Unlock Deck
Unlock for access to all 103 flashcards in this deck.
Unlock Deck
k this deck
12
A baseball player gets four hits during the World Series and a sports announcer claims that getting four or
more hits is not unusual. Use the frequency distribution below to determine if the sports announcer is correct.
more hits is not unusual. Use the frequency distribution below to determine if the sports announcer is correct.
Unlock Deck
Unlock for access to all 103 flashcards in this deck.
Unlock Deck
k this deck
13
State whether the variable is discrete or continuous. The cost of a Statistics textbook
A)discrete
B)continuous
A)discrete
B)continuous
Unlock Deck
Unlock for access to all 103 flashcards in this deck.
Unlock Deck
k this deck
14
State whether the variable is discrete or continuous. The temperature in degrees Fahrenheit on July 4th in Juneau, Alaska
A)continuous
B)discrete
A)continuous
B)discrete
Unlock Deck
Unlock for access to all 103 flashcards in this deck.
Unlock Deck
k this deck
15
Determine whether the number line represents a discrete random variable or a continuous random variable. Explain your reasoning.
The attendance at games for a sports team
A)Discrete; Attendance is a random variable that is countable.
B)Continuous; Attendance is a random variable that must be measured.
The attendance at games for a sports team
A)Discrete; Attendance is a random variable that is countable.
B)Continuous; Attendance is a random variable that must be measured.
Unlock Deck
Unlock for access to all 103 flashcards in this deck.
Unlock Deck
k this deck
16
State whether the variable is discrete or continuous. The height of a player on a basketball team
A)continuous
B)discrete
A)continuous
B)discrete
Unlock Deck
Unlock for access to all 103 flashcards in this deck.
Unlock Deck
k this deck
17
The random variable x represents the number of cars per household in a town of 1000 households. Find the probability of randomly selecting a household that has between one and three cars, inclusive.
A)0.792
B)0.125
C)0.208
D)0.256
A)0.792
B)0.125
C)0.208
D)0.256
Unlock Deck
Unlock for access to all 103 flashcards in this deck.
Unlock Deck
k this deck
18
Determine whether the number line represents a discrete random variable or a continuous random variable. Explain your reasoning.
The length of time college students study each week
A)Continuous; Time is a random variable that must be measured.
B)Discrete; Time is a random variable that is countable.
The length of time college students study each week
A)Continuous; Time is a random variable that must be measured.
B)Discrete; Time is a random variable that is countable.
Unlock Deck
Unlock for access to all 103 flashcards in this deck.
Unlock Deck
k this deck
19
The random variable x represents the number of cars per household in a town of 1000 households. Find the probability of randomly selecting a household that has less than two cars.
A)0.553
B)0.809
C)0.428
D)0.125
A)0.553
B)0.809
C)0.428
D)0.125
Unlock Deck
Unlock for access to all 103 flashcards in this deck.
Unlock Deck
k this deck
20
State whether the variable is discrete or continuous. The number of goals scored in a soccer game
A)discrete
B)continuous
A)discrete
B)continuous
Unlock Deck
Unlock for access to all 103 flashcards in this deck.
Unlock Deck
k this deck
21
One thousand tickets are sold at $2 each. One ticket will be randomly selected and the winner will receive a color television valued at $387. What is the expected value for a person that buys one ticket?
A)-$1.61
B)$1.61
C)$1.00
D)-$1.00
A)-$1.61
B)$1.61
C)$1.00
D)-$1.00
Unlock Deck
Unlock for access to all 103 flashcards in this deck.
Unlock Deck
k this deck
22
Determine the probability distribution?s missing value. The probability that a tutor sees 0, 1, 2, 3, or 4 students on a given day.
A)0.20
B)0.50
C)0.80
D)1.0
A)0.20
B)0.50
C)0.80
D)1.0
Unlock Deck
Unlock for access to all 103 flashcards in this deck.
Unlock Deck
k this deck
23
In a pizza takeout restaurant, the following probability distribution was obtained. The random variable x represents the number of toppings for a large pizza. Find the mean and standard deviation.
A)mean: 1.14; standard deviation: 1.04
B)mean: 1.54; standard deviation: 1.30
C)mean: 1.30; standard deviation: 2.38
D)mean: 1.30; standard deviation: 1.54
A)mean: 1.14; standard deviation: 1.04
B)mean: 1.54; standard deviation: 1.30
C)mean: 1.30; standard deviation: 2.38
D)mean: 1.30; standard deviation: 1.54
Unlock Deck
Unlock for access to all 103 flashcards in this deck.
Unlock Deck
k this deck
24
Determine whether the distribution represents a probability distribution. If not, identify any requirements that
are not satisfied.
are not satisfied.
Unlock Deck
Unlock for access to all 103 flashcards in this deck.
Unlock Deck
k this deck
25
Use the frequency distribution to (a)construct a probability distribution for the random variable x which
represents the number of cars per household in a town of 1000 households, and (b)graph the distribution.
represents the number of cars per household in a town of 1000 households, and (b)graph the distribution.
Unlock Deck
Unlock for access to all 103 flashcards in this deck.
Unlock Deck
k this deck
26
The random variable x represents the number of credit cards that adults have along with the corresponding
probabilities. Graph the probability distribution.
probabilities. Graph the probability distribution.
Unlock Deck
Unlock for access to all 103 flashcards in this deck.
Unlock Deck
k this deck
27
Determine whether the distribution represents a probability distribution. If not, identify any requirements that
are not satisfied.
are not satisfied.
Unlock Deck
Unlock for access to all 103 flashcards in this deck.
Unlock Deck
k this deck
28
If a person rolls doubles when tossing two dice, the roller profits $100. If the game is fair, how much should the person pay to play the game?
A)$20
B)$100
C)$99
D)$97
A)$20
B)$100
C)$99
D)$97
Unlock Deck
Unlock for access to all 103 flashcards in this deck.
Unlock Deck
k this deck
29
Determine whether the distribution represents a probability distribution. If not, identify any requirements that
are not satisfied.
are not satisfied.
Unlock Deck
Unlock for access to all 103 flashcards in this deck.
Unlock Deck
k this deck
30
Determine whether the distribution represents a probability distribution. If not, identify any requirements that
are not satisfied.
are not satisfied.
Unlock Deck
Unlock for access to all 103 flashcards in this deck.
Unlock Deck
k this deck
31
In a pizza takeout restaurant, the following probability distribution was obtained. The random variable x
represents the number of toppings for a large pizza. Graph the probability distribution.
represents the number of toppings for a large pizza. Graph the probability distribution.
Unlock Deck
Unlock for access to all 103 flashcards in this deck.
Unlock Deck
k this deck
32
The random variable x represents the number of boys in a family of three children. Assuming that boys and girls are equally likely, find the mean and standard deviation for the random variable x.
A)mean: 1.50; standard deviation: 0.87
B)mean: 2.25; standard deviation: 0.87
C)mean: 1.50; standard deviation: 0.76
D)mean: 2.25; standard deviation: 0.76
A)mean: 1.50; standard deviation: 0.87
B)mean: 2.25; standard deviation: 0.87
C)mean: 1.50; standard deviation: 0.76
D)mean: 2.25; standard deviation: 0.76
Unlock Deck
Unlock for access to all 103 flashcards in this deck.
Unlock Deck
k this deck
33
The random variable x represents the number of tests that a patient entering a hospital will have along with the corresponding probabilities. Find the mean and standard deviation.
A)mean: 1.59; standard deviation: 1.09
B)mean: 1.59; standard deviation: 3.71
C)mean: 2.52; standard deviation: 1.93
D)mean: 3.72; standard deviation: 2.52
A)mean: 1.59; standard deviation: 1.09
B)mean: 1.59; standard deviation: 3.71
C)mean: 2.52; standard deviation: 1.93
D)mean: 3.72; standard deviation: 2.52
Unlock Deck
Unlock for access to all 103 flashcards in this deck.
Unlock Deck
k this deck
34
At a raffle, 10,000 tickets are sold at $5 each for three prizes valued at $4,800, $1,200, and $400. What is the expected value of one ticket?
A)-$4.36
B)$4.36
C)$0.64
D)-$0.64
A)-$4.36
B)$4.36
C)$0.64
D)-$0.64
Unlock Deck
Unlock for access to all 103 flashcards in this deck.
Unlock Deck
k this deck
35
At a raffle, 10,000 tickets are sold at $10 each for three prizes valued at $4,800, $1,200, and $400. What is the expected value of one ticket?
A)-$9.36
B)$9.36
C)-$0.64
D)$0.64
A)-$9.36
B)$9.36
C)-$0.64
D)$0.64
Unlock Deck
Unlock for access to all 103 flashcards in this deck.
Unlock Deck
k this deck
36
The random variable x represents the number of tests that a patient entering a hospital will have along with the
corresponding probabilities. Graph the probability distribution.
corresponding probabilities. Graph the probability distribution.
Unlock Deck
Unlock for access to all 103 flashcards in this deck.
Unlock Deck
k this deck
37
The random variable x represents the number of boys in a family of three children. Assuming that boys and
girls are equally likely, (a)construct a probability distribution, and (b)graph the distribution.
girls are equally likely, (a)construct a probability distribution, and (b)graph the distribution.
Unlock Deck
Unlock for access to all 103 flashcards in this deck.
Unlock Deck
k this deck
38
Determine whether the distribution represents a probability distribution. If not, identify any requirements that
are not satisfied.
are not satisfied.
Unlock Deck
Unlock for access to all 103 flashcards in this deck.
Unlock Deck
k this deck
39
The random variable x represents the number of credit cards that adults have along with the corresponding probabilities. Find the mean and standard deviation.
A)mean: 1.23; standard deviation: 0.66
B)mean: 1.30; standard deviation: 0.32
C)mean: 1.30; standard deviation: 0.44
D)mean: 1.23; standard deviation: 0.44
A)mean: 1.23; standard deviation: 0.66
B)mean: 1.30; standard deviation: 0.32
C)mean: 1.30; standard deviation: 0.44
D)mean: 1.23; standard deviation: 0.44
Unlock Deck
Unlock for access to all 103 flashcards in this deck.
Unlock Deck
k this deck
40
Determine the probability distribution?s missing value. The probability that a tutor will see 0, 1, 2, 3, or 4 students
A)0.47
B)0.8
C)0.53
D)-0.67
A)0.47
B)0.8
C)0.53
D)-0.67
Unlock Deck
Unlock for access to all 103 flashcards in this deck.
Unlock Deck
k this deck
41
Find the standard deviation of the binomial distribution for which n = 1000 and p = 0.94.
A)7.51
B)56.4
C)940
D)6.31
A)7.51
B)56.4
C)940
D)6.31
Unlock Deck
Unlock for access to all 103 flashcards in this deck.
Unlock Deck
k this deck
42
Decide whether the experiment is a binomial experiment. If it is not, explain why. Testing a pain reliever using
740 people to determine if it is effective. The random variable represents the number of people who find the
pain reliever to be effective.
740 people to determine if it is effective. The random variable represents the number of people who find the
pain reliever to be effective.
Unlock Deck
Unlock for access to all 103 flashcards in this deck.
Unlock Deck
k this deck
43
Decide whether the experiment is a binomial experiment. If it is not, explain why. You roll a die 100 times. The
random variable represents the number that appears on each roll of the die.
random variable represents the number that appears on each roll of the die.
Unlock Deck
Unlock for access to all 103 flashcards in this deck.
Unlock Deck
k this deck
44
Decide whether the experiment is a binomial experiment. If it is not, explain why. Surveying 600 prisoners to
see whether they are serving time for their first offense. The random variable represents the number of
prisoners serving time for their first offense.
see whether they are serving time for their first offense. The random variable represents the number of
prisoners serving time for their first offense.
Unlock Deck
Unlock for access to all 103 flashcards in this deck.
Unlock Deck
k this deck
45
Decide whether the experiment is a binomial experiment. If it is not, explain why. You test four pain relievers.
The random variable represents the pain reliever that is most effective.
The random variable represents the pain reliever that is most effective.
Unlock Deck
Unlock for access to all 103 flashcards in this deck.
Unlock Deck
k this deck
46
Find the mean of the binomial distribution for which n = 40 and p = 0.2.
A)8
B)2.53
C)20
D)40
A)8
B)2.53
C)20
D)40
Unlock Deck
Unlock for access to all 103 flashcards in this deck.
Unlock Deck
k this deck
47
Decide whether the experiment is a binomial experiment. If it is not, explain why. Surveying 250 prisoners to
see how many crimes in which they were convicted. The random variable represents the number of crimes in
which each prisoner was convicted.
see how many crimes in which they were convicted. The random variable represents the number of crimes in
which each prisoner was convicted.
Unlock Deck
Unlock for access to all 103 flashcards in this deck.
Unlock Deck
k this deck
48
Decide whether the experiment is a binomial experiment. If it is not, explain why. You observe the gender of
the next 250 babies born at a local hospital. The random variable represents the number of girls.
the next 250 babies born at a local hospital. The random variable represents the number of girls.
Unlock Deck
Unlock for access to all 103 flashcards in this deck.
Unlock Deck
k this deck
49
From the probability distribution, find the mean and standard deviation for the random variable x, which
represents the number of cars per household in a town of 1000 households.
represents the number of cars per household in a town of 1000 households.
Unlock Deck
Unlock for access to all 103 flashcards in this deck.
Unlock Deck
k this deck
50
Decide whether the experiment is a binomial experiment. If it is not, explain why. Each week, a man plays a
game in which he has a 39% chance of winning. The random variable is the number of times he wins in 51
weeks.
game in which he has a 39% chance of winning. The random variable is the number of times he wins in 51
weeks.
Unlock Deck
Unlock for access to all 103 flashcards in this deck.
Unlock Deck
k this deck
51
Decide whether the experiment is a binomial experiment. If it is not, explain why. You spin a number wheel
that has 19 numbers 450 times. The random variable represents the winning numbers on each spin of the
wheel.
that has 19 numbers 450 times. The random variable represents the winning numbers on each spin of the
wheel.
Unlock Deck
Unlock for access to all 103 flashcards in this deck.
Unlock Deck
k this deck
52
In a recent survey, 80% of the community favored building a police substation in their neighborhood. If 15 citizens are chosen, what is the mean number favoring the substation?
A)12
B)15
C)8
D)10
A)12
B)15
C)8
D)10
Unlock Deck
Unlock for access to all 103 flashcards in this deck.
Unlock Deck
k this deck
53
In a recent survey, 80% of the community favored building a police substation in their neighborhood. If 15 citizens are chosen, what is the standard deviation of the number favoring the substation?
A)1.55
B)2.40
C)0.98
D)0.55
A)1.55
B)2.40
C)0.98
D)0.55
Unlock Deck
Unlock for access to all 103 flashcards in this deck.
Unlock Deck
k this deck
54
In one city, 24% of adults smoke. In groups of size 130 of adults, what is the variance of the number that smoke ?
A)23.71
B)4.87
C)31.2
D)11.86
A)23.71
B)4.87
C)31.2
D)11.86
Unlock Deck
Unlock for access to all 103 flashcards in this deck.
Unlock Deck
k this deck
55
In a raffle, 1,000 tickets are sold for $2 each. One ticket will be randomly selected and the winner will receive a laptop computer valued at $1200. What is the expected value for a person that buys one ticket?
A)-$0.80
B)$0.8
C)$1.20
D)-$1.20
A)-$0.80
B)$0.8
C)$1.20
D)-$1.20
Unlock Deck
Unlock for access to all 103 flashcards in this deck.
Unlock Deck
k this deck
56
A test consists of 700 true or false questions. If the student guesses on each question, what is the mean number of correct answers?
A)350
B)0
C)700
D)140
A)350
B)0
C)700
D)140
Unlock Deck
Unlock for access to all 103 flashcards in this deck.
Unlock Deck
k this deck
57
Find the variance of the binomial distribution for which n = 800 and p = 0.87.
A)90.48
B)9.51
C)696
D)32.54
A)90.48
B)9.51
C)696
D)32.54
Unlock Deck
Unlock for access to all 103 flashcards in this deck.
Unlock Deck
k this deck
58
The probability that a house in an urban area will be burglarized is 5%. If 20 houses are randomly selected, what is the mean of the number of houses burglarized?
A)1
B)10
C)0.5
D)1.5
A)1
B)10
C)0.5
D)1.5
Unlock Deck
Unlock for access to all 103 flashcards in this deck.
Unlock Deck
k this deck
59
A test consists of 800 true or false questions. If the student guesses on each question, what is the standard deviation of the number of correct answers?
A)14.14
B)0
C)2
D)20
A)14.14
B)0
C)2
D)20
Unlock Deck
Unlock for access to all 103 flashcards in this deck.
Unlock Deck
k this deck
60
Decide whether the experiment is a binomial experiment. If it is not, explain why. Selecting five cards, one at a
time without replacement, from a standard deck of cards. The random variable is the number of red cards
obtained.
time without replacement, from a standard deck of cards. The random variable is the number of red cards
obtained.
Unlock Deck
Unlock for access to all 103 flashcards in this deck.
Unlock Deck
k this deck
61
The probability that an individual is left-handed is 0.12. In a class of 39 students, what is the probability of finding five left-handers?
A)0.186
B)0.128
C)0.000
D)0.12
A)0.186
B)0.128
C)0.000
D)0.12
Unlock Deck
Unlock for access to all 103 flashcards in this deck.
Unlock Deck
k this deck
62
A recent survey found that 70% of all adults over 50 wear glasses for driving. In a random sample of 10 adults over 50, what is the probability that at least six wear glasses?
A)0.850
B)0.700
C)0.200
D)0.006
A)0.850
B)0.700
C)0.200
D)0.006
Unlock Deck
Unlock for access to all 103 flashcards in this deck.
Unlock Deck
k this deck
63
In a recent survey, 64% of the community favored building a police substation in their neighborhood. If 14 citizens are chosen, find the probability that exactly 8 of them favor the building of the police substation.
A)0.184
B)0.058
C)0.571
D)0.640
A)0.184
B)0.058
C)0.571
D)0.640
Unlock Deck
Unlock for access to all 103 flashcards in this deck.
Unlock Deck
k this deck
64
Assume that male and female births are equally likely and that the birth of any child does not affect the
probability of the gender of any other children. Suppose that 500 couples each have a baby; find the mean and
standard deviation for the number of girls in the 500 babies.
probability of the gender of any other children. Suppose that 500 couples each have a baby; find the mean and
standard deviation for the number of girls in the 500 babies.
Unlock Deck
Unlock for access to all 103 flashcards in this deck.
Unlock Deck
k this deck
65
According to government data, the probability that a woman between the ages of 25 and 29 was never married is 40%. In a random survey of 10 women in this age group, what is the mean and standard deviation of the
Number that never married?
A)mean: 4; standard deviation: 1.55
B)mean: 6; standard deviation: 1.55
C)mean: 6; standard deviation: 155
D)mean: 4; standard deviation: 2.4
Number that never married?
A)mean: 4; standard deviation: 1.55
B)mean: 6; standard deviation: 1.55
C)mean: 6; standard deviation: 155
D)mean: 4; standard deviation: 2.4
Unlock Deck
Unlock for access to all 103 flashcards in this deck.
Unlock Deck
k this deck
66
According to government data, the probability that a woman between the ages of 25 and 29 was never married is 40%. In a random survey of 10 women in this age group, what is the probability that two or fewer were never
Married?
A)0.167
B)1.002
C)0.013
D)0.161
Married?
A)0.167
B)1.002
C)0.013
D)0.161
Unlock Deck
Unlock for access to all 103 flashcards in this deck.
Unlock Deck
k this deck
67
The probability that a tennis set will go to a tiebreaker is 16%. In 220 randomly selected tennis sets, what is the mean and the standard deviation of the number of tiebreakers?
A)mean: 35.2; standard deviation: 5.44
B)mean: 35.2; standard deviation: 5.93
C)mean: 33; standard deviation: 5.44
D)mean: 33; standard deviation: 5.93
A)mean: 35.2; standard deviation: 5.44
B)mean: 35.2; standard deviation: 5.93
C)mean: 33; standard deviation: 5.44
D)mean: 33; standard deviation: 5.93
Unlock Deck
Unlock for access to all 103 flashcards in this deck.
Unlock Deck
k this deck
68
The probability that a tennis set will go to a tie-breaker is 14%. What is the probability that two of three sets will go to tie-breakers?
A)0.051
B)0.14
C)0.311
D)0.0196
A)0.051
B)0.14
C)0.311
D)0.0196
Unlock Deck
Unlock for access to all 103 flashcards in this deck.
Unlock Deck
k this deck
69
Assume that male and female births are equally likely and that the birth of any child does not affect the probability of the gender of any other children. Find the probability of exactly nine boys in ten births.
A)0.010
B)0.9
C)0.020
D)0.09
A)0.010
B)0.9
C)0.020
D)0.09
Unlock Deck
Unlock for access to all 103 flashcards in this deck.
Unlock Deck
k this deck
70
According to police sources, a car with a certain protection system will be recovered 90% of the time. If 600 stolen cars are randomly selected, what is the mean and standard deviation of the number of cars recovered
After being stolen?
A)mean: 540; standard deviation: 7.35
B)mean: 540; standard deviation: 54
C)mean: 306: standard deviation: 7.35
D)mean: 306: standard deviation: 54
After being stolen?
A)mean: 540; standard deviation: 7.35
B)mean: 540; standard deviation: 54
C)mean: 306: standard deviation: 7.35
D)mean: 306: standard deviation: 54
Unlock Deck
Unlock for access to all 103 flashcards in this deck.
Unlock Deck
k this deck
71
Assume that male and female births are equally likely and that the birth of any child does not affect the probability of the gender of any other children. Find the probability of at most three boys in ten births.
A)0.172
B)0.300
C)0.003
D)0.333
A)0.172
B)0.300
C)0.003
D)0.333
Unlock Deck
Unlock for access to all 103 flashcards in this deck.
Unlock Deck
k this deck
72
According to police sources, a car with a certain protection system will be recovered 89% of the time. Find the probability that 3 of 7 stolen cars will be recovered.
A)0.004
B)0.429
C)0.89
D)0.11
A)0.004
B)0.429
C)0.89
D)0.11
Unlock Deck
Unlock for access to all 103 flashcards in this deck.
Unlock Deck
k this deck
73
Fifty percent of the people that get mail-order catalogs order something. Find the probability that exactly two of 10 people getting these catalogs will order something.
A)0.044
B)0.200
C)0.001
D)11.250
A)0.044
B)0.200
C)0.001
D)11.250
Unlock Deck
Unlock for access to all 103 flashcards in this deck.
Unlock Deck
k this deck
74
The probability that a house in an urban area will be burglarized is 5%. If 82 houses are randomly selected, what is the probability that none of the houses will be burglarized?
A)0.015
B)0.050
C)0.000
D)0.001
A)0.015
B)0.050
C)0.000
D)0.001
Unlock Deck
Unlock for access to all 103 flashcards in this deck.
Unlock Deck
k this deck
75
A test consists of 10 true or false questions. To pass the test a student must answer at least eight questions correctly. If the student guesses on each question, what is the probability that the student will pass the test?
A)0.055
B)0.8
C)0.20
D)0.08
A)0.055
B)0.8
C)0.20
D)0.08
Unlock Deck
Unlock for access to all 103 flashcards in this deck.
Unlock Deck
k this deck
76
A recent survey found that 63% of all adults over 50 wear glasses for driving. In a random sample of 100 adults over 50, what is the mean and standard deviation of those that wear glasses?
A)mean: 63; standard deviation: 4.83
B)mean: 63; standard deviation: 7.94
C)mean: 37; standard deviation: 4.83
D)mean: 37; standard deviation: 7.94
A)mean: 63; standard deviation: 4.83
B)mean: 63; standard deviation: 7.94
C)mean: 37; standard deviation: 4.83
D)mean: 37; standard deviation: 7.94
Unlock Deck
Unlock for access to all 103 flashcards in this deck.
Unlock Deck
k this deck
77
A test consists of 100 multiple choice questions, each with five possible answers, only one of which is correct. Find the mean and the standard deviation of the number of correct answers.
A)mean: 20; standard deviation: 4
B)mean: 20; standard deviation: 4.47
C)mean: 50; standard deviation: 4
D)mean: 50; standard deviation: 7.07
A)mean: 20; standard deviation: 4
B)mean: 20; standard deviation: 4.47
C)mean: 50; standard deviation: 4
D)mean: 50; standard deviation: 7.07
Unlock Deck
Unlock for access to all 103 flashcards in this deck.
Unlock Deck
k this deck
78
A test consists of 10 multiple choice questions, each with five possible answers, one of which is correct. To pass the test a student must get 60% or better on the test. If a student randomly guesses, what is the probability that
The student will pass the test?
A)0.006
B)0.060
C)0.377
D)0.205
The student will pass the test?
A)0.006
B)0.060
C)0.377
D)0.205
Unlock Deck
Unlock for access to all 103 flashcards in this deck.
Unlock Deck
k this deck
79
The probability that an individual is left-handed is 0.16. In a class of 10 students, what is the mean and standard deviation of the number of left-handers in the class?
A)mean: 1.6; standard deviation: 1.16
B)mean: 10; standard deviation: 1.16
C)mean: 1.6; standard deviation: 1.26
D)mean: 10; standard deviation: 1.26
A)mean: 1.6; standard deviation: 1.16
B)mean: 10; standard deviation: 1.16
C)mean: 1.6; standard deviation: 1.26
D)mean: 10; standard deviation: 1.26
Unlock Deck
Unlock for access to all 103 flashcards in this deck.
Unlock Deck
k this deck
80
According to government data, the probability that a woman between the ages of 25 and 29 was never married is 40%. In a random survey of 10 women in this age group, what is the probability that at least eight were
Married?
A)0.167
B)1.002
C)0.013
D)0.161
Married?
A)0.167
B)1.002
C)0.013
D)0.161
Unlock Deck
Unlock for access to all 103 flashcards in this deck.
Unlock Deck
k this deck
Unlock Deck
Unlock for access to all 103 flashcards in this deck.


