Deck 7: Hypothesis Testing With One Sample
Full screen (f)
Question
Question
Question
Question
Question
Question
Question
Question
Question
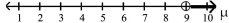
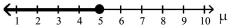
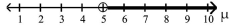
The alternative hypothesis is given with its graph. State the null hypothesis and sketch its graph. 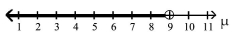
A)
B)
C)
D)
A)
B)
C)
D)
Question
Question
Question
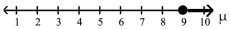
The alternative hypothesis is given with its graph. State the null hypothesis and sketch its graph. 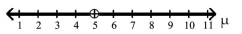
A)
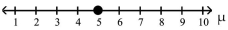
B)
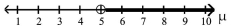
C)
D)
A)
B)
C)
D)
Question
Question
Question
Question
Question
Question
Question
Question
Question
Question
Question
Question
Question
Question
Question
Question
Question
Question
Question
Question
Question
Question
Question
Question
Question
Question
Question
Question
Question
Question
Question
Question
Question
Question
Question
Question
Question
Question
Question
Question
Question
Question
Question
Question
Question
Question
Question
Question
Question
Question
Test the claim that  given that ,
 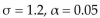 and the sample statistics are n =
given that , and the sample statistics are n = Question
Test the claim that  13, given that
  and the sample statistics are n =
  .
.
13, given that and the sample statistics are n = . Question
Question
Test the claim that  given that
  and the sample statistics are n =
given that and the sample statistics are n = Question
Question
A local politician, running for reelection, claims that the mean prison time for car thieves is less than the
required 4 years. A sample of 80 convicted car thieves was randomly selected, and the mean length of prison
time was found to be 3 years and 6 months, with a population standard deviation of 1 year and 3 months. At α = 0.05, test the politicianʹs claim.
required 4 years. A sample of 80 convicted car thieves was randomly selected, and the mean length of prison
time was found to be 3 years and 6 months, with a population standard deviation of 1 year and 3 months. At
α = 0.05, test the politicianʹs claim. Question
Question
Question
Test the claim that  40, given that
  and the sample statistics are n =
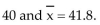
40, given that and the sample statistics are n = Question
A fast food outlet claims that the mean waiting time in line is less than 3.8 minutes. A random sample of 60
customers has a mean of 3.7 minutes with a population standard deviation of 0.6 minute. If α = 0.05, test the
fast food outletʹs claim.
customers has a mean of 3.7 minutes with a population standard deviation of 0.6 minute. If α
= 0.05, test thefast food outletʹs claim.
Question
Question
Question
A local group claims that the police issue at least 60 speeding tickets a day in their area. To prove their point,
they randomly select one month. Their research yields the number of tickets issued for each day. The data are
listed below. Assume the population standard deviation is 12.2 tickets. At α = 0.01, test the groupʹs claim.
they randomly select one month. Their research yields the number of tickets issued for each day. The data are
listed below. Assume the population standard deviation is 12.2 tickets. At α
= 0.01, test the groupʹs claim. Question
Question
Question
Question
Question
A manufacturer claims that the mean lifetime of its fluorescent bulbs is 1500 hours. A homeowner selects 40
bulbs and finds the mean lifetime to be 1480 hours with a population standard deviation of 80 hours. Test the
manufacturerʹs claim. Use = 0.05.
bulbs and finds the mean lifetime to be 1480 hours with a population standard deviation of 80 hours. Test the
manufacturerʹs claim. Use
= 0.05. Question
A trucking firm suspects that the mean lifetime of a certain tire it uses is less than 36,000 miles. To check the
claim, the firm randomly selects and tests 54 of these tires and gets a mean lifetime of 35,630 miles with a
population standard deviation of 1200 miles. At α .05, test the trucking firmʹs claim.
claim, the firm randomly selects and tests 54 of these tires and gets a mean lifetime of 35,630 miles with a
population standard deviation of 1200 miles. At α
.05, test the trucking firmʹs claim.
Unlock Deck
Sign up to unlock the cards in this deck!
Unlock Deck
Unlock Deck
1/159
Play
Full screen (f)
Deck 7: Hypothesis Testing With One Sample
1
The mean score for all NBA games during a particular season was less than 92 points per game. Write the null
and alternative hypotheses.
and alternative hypotheses.

2
A researcher claims that 71% of voters favor gun control. Determine whether the hypothesis test for this claim is left-tailed, right-tailed, or two-tailed.
A)two-tailed
B)left-tailed
C)right-tailed
A)two-tailed
B)left-tailed
C)right-tailed
two-tailed
3
The mean score for all NBA games during a particular season was less than 106 points per game. State this
claim mathematically. Write the null and alternative hypotheses. Identify which hypothesis is the claim.
claim mathematically. Write the null and alternative hypotheses. Identify which hypothesis is the claim.
claim: 
4
A candidate for governor of a particular state claims to be favored by at least half of the voters. State this claim
mathematically. Write the null and alternative hypotheses. Identify which hypothesis is the claim.
mathematically. Write the null and alternative hypotheses. Identify which hypothesis is the claim.
Unlock Deck
Unlock for access to all 159 flashcards in this deck.
Unlock Deck
k this deck
5
The statement represents a claim. Write its complement and state which is and which is = 8.3
A)
B)
C)
D)
A)
B)
C)
D)
Unlock Deck
Unlock for access to all 159 flashcards in this deck.
Unlock Deck
k this deck
6
The mean IQ of statistics teachers is greater than 160. Write the null and alternative hypotheses.
Unlock Deck
Unlock for access to all 159 flashcards in this deck.
Unlock Deck
k this deck
7
The dean of a major university claims that the mean time for students to earn a Masterʹs degree is at most 3.3
years. Write the null and alternative hypotheses.
years. Write the null and alternative hypotheses.
Unlock Deck
Unlock for access to all 159 flashcards in this deck.
Unlock Deck
k this deck
8
Given determinedetermin whether the hypothesis test is left-tailed, right-tailed, or two-tailed.
A)left-tailed
B)right-tailed
C)two-tailed
A)left-tailed
B)right-tailed
C)two-tailed
Unlock Deck
Unlock for access to all 159 flashcards in this deck.
Unlock Deck
k this deck
9
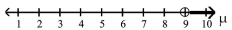
The alternative hypothesis is given with its graph. State the null hypothesis and sketch its graph.
A)
B)
C)
D)
A)
B)
C)
D)
Unlock Deck
Unlock for access to all 159 flashcards in this deck.
Unlock Deck
k this deck
10
The mean IQ of statistics teachers is greater than 140. State this claim mathematically. Write the null and
alternative hypotheses. Identify which hypothesis is the claim.
alternative hypotheses. Identify which hypothesis is the claim.
Unlock Deck
Unlock for access to all 159 flashcards in this deck.
Unlock Deck
k this deck
11
The mean age of bus drivers in Chicago is 56.9 years. State this claim mathematically. Write the null and
alternative hypotheses. Identify which hypothesis is the claim.
alternative hypotheses. Identify which hypothesis is the claim.
Unlock Deck
Unlock for access to all 159 flashcards in this deck.
Unlock Deck
k this deck
12
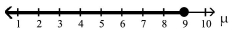
The alternative hypothesis is given with its graph. State the null hypothesis and sketch its graph.
A)
B)
C)
D)
A)
B)
C)
D)
Unlock Deck
Unlock for access to all 159 flashcards in this deck.
Unlock Deck
k this deck
13
The dean of a major university claims that the mean time for students to earn a Masterʹs degree is at most 4.2
years. State this claim mathematically. Write the null and alternative hypotheses. Identify which hypothesis is
the claim.
years. State this claim mathematically. Write the null and alternative hypotheses. Identify which hypothesis is
the claim.
Unlock Deck
Unlock for access to all 159 flashcards in this deck.
Unlock Deck
k this deck
14
The buyer of a local hiking club store recommends against buying the new digital altimeters because they vary
more than the old altimeters, which had a standard deviation of one yard. Write the null and alternative
hypotheses.
more than the old altimeters, which had a standard deviation of one yard. Write the null and alternative
hypotheses.
Unlock Deck
Unlock for access to all 159 flashcards in this deck.
Unlock Deck
k this deck
15
The mean age of bus drivers in Chicago is 48.6 years. Write the null and alternative hypotheses.
Unlock Deck
Unlock for access to all 159 flashcards in this deck.
Unlock Deck
k this deck
16
The buyer of a local hiking club store recommends against buying the new digital altimeters because they vary
more than the old altimeters, which had a standard deviation of one yard. State this claim mathematically.
Write the null and alternative hypotheses. Identify which hypothesis is the claim.
more than the old altimeters, which had a standard deviation of one yard. State this claim mathematically.
Write the null and alternative hypotheses. Identify which hypothesis is the claim.
Unlock Deck
Unlock for access to all 159 flashcards in this deck.
Unlock Deck
k this deck
17
The statement represents a claim. Write its complement and state which is and which is .93
A)
B)
C)
D)
A)
B)
C)
D)
Unlock Deck
Unlock for access to all 159 flashcards in this deck.
Unlock Deck
k this deck
18
A candidate for governor of a particular state claims to be favored by at least half of the voters. Write the null
and alternative hypotheses.
and alternative hypotheses.
Unlock Deck
Unlock for access to all 159 flashcards in this deck.
Unlock Deck
k this deck
19
Given determine whether the hypothesis test is left-tailed, right-tailed, or two-tailed.
A)right-tailed
B)left-tailed
C)two-tailed
A)right-tailed
B)left-tailed
C)two-tailed
Unlock Deck
Unlock for access to all 159 flashcards in this deck.
Unlock Deck
k this deck
20
The statement represents a claim. Write its complement and state which is and which is
A)
B)
C)
D)
A)
B)
C)
D)
Unlock Deck
Unlock for access to all 159 flashcards in this deck.
Unlock Deck
k this deck
21
The mean age of bus drivers in Chicago is greater than 54.4 years. If a hypothesis test is performed, how should you interpret a decision that fails to reject the null hypothesis?
A)There is not sufficient evidence to support the claim μ 54.4.
B)There is sufficient evidence to reject the claim μ 54.4.
C)There is not sufficient evidence to reject the claim μ 54.4.
D)There is sufficient evidence to support the claim μ 54.4.
A)There is not sufficient evidence to support the claim μ 54.4.
B)There is sufficient evidence to reject the claim μ 54.4.
C)There is not sufficient evidence to reject the claim μ 54.4.
D)There is sufficient evidence to support the claim μ 54.4.
Unlock Deck
Unlock for access to all 159 flashcards in this deck.
Unlock Deck
k this deck
22
A candidate for governor of a certain state claims to be favored by at least half of the voters. If a hypothesis test is performed, how should you interpret a decision that fails to reject the null hypothesis?
A)There is not sufficient evidence to reject the claim ρ
B)There is sufficient evidence to reject the claim ρ
C)There is sufficient evidence to support the claim ρ
D)There is not sufficient evidence to support the claim ρ
A)There is not sufficient evidence to reject the claim ρ
B)There is sufficient evidence to reject the claim ρ
C)There is sufficient evidence to support the claim ρ
D)There is not sufficient evidence to support the claim ρ
Unlock Deck
Unlock for access to all 159 flashcards in this deck.
Unlock Deck
k this deck
23
The mean score for all NBA games during a particular season was less than 90 points per game. Identify the
type I and type II errors for the hypothesis test of this claim.
type I and type II errors for the hypothesis test of this claim.
Unlock Deck
Unlock for access to all 159 flashcards in this deck.
Unlock Deck
k this deck
24
The mean age of bus drivers in Chicago is 51.3 years. Identify the type I and type II errors for the hypothesis
test of this claim.
test of this claim.
Unlock Deck
Unlock for access to all 159 flashcards in this deck.
Unlock Deck
k this deck
25
The mean score for all NBA games during a particular season was less than 104 points per game. If a hypothesis test is performed, how should you interpret a decision that fails to reject the null hypothesis?
A)There is not sufficient evidence to support the claim μ 10104.
B)There is sufficient evidence to reject the claim μ 104.
C)There is not sufficient evidence to reject the claim μ
D)There is sufficient evidence to support the claim μ
A)There is not sufficient evidence to support the claim μ 10104.
B)There is sufficient evidence to reject the claim μ 104.
C)There is not sufficient evidence to reject the claim μ
D)There is sufficient evidence to support the claim μ
Unlock Deck
Unlock for access to all 159 flashcards in this deck.
Unlock Deck
k this deck
26
The mean score for all NBA games during a particular season was less than 104 points per game. If a hypothesis test is performed, how should you interpret a decision that rejects the null hypothesis?
A)There is sufficient evidence to support the claim μ 10104.
B)There is sufficient evidence to reject the claim μ 104.
C)There is not sufficient evidence to reject the claim μ 104.
D)There is not sufficient evidence to support the claim μ 10104.
A)There is sufficient evidence to support the claim μ 10104.
B)There is sufficient evidence to reject the claim μ 104.
C)There is not sufficient evidence to reject the claim μ 104.
D)There is not sufficient evidence to support the claim μ 10104.
Unlock Deck
Unlock for access to all 159 flashcards in this deck.
Unlock Deck
k this deck
27
The mean IQ of statistics teachers is greater than 130. Identify the type I and type II errors for the hypothesis
test of this claim.
test of this claim.
Unlock Deck
Unlock for access to all 159 flashcards in this deck.
Unlock Deck
k this deck
28
The mean IQ of statistics teachers is greater than 110. If a hypothesis test is performed, how should you interpret a decision that fails to reject the null hypothesis?
A)There is not sufficient evidence to support the claim μ 11110.
B)There is sufficient evidence to reject the claim μ 110.
C)There is not sufficient evidence to reject the claiclaim 110.
D)There is sufficient evidence to support the claim μ 110.
A)There is not sufficient evidence to support the claim μ 11110.
B)There is sufficient evidence to reject the claim μ 110.
C)There is not sufficient evidence to reject the claiclaim 110.
D)There is sufficient evidence to support the claim μ 110.
Unlock Deck
Unlock for access to all 159 flashcards in this deck.
Unlock Deck
k this deck
29
The mean IQ of statistics teachers is greater than 130. If a hypothesis test is performed, how should you interpret a decision that rejects the null hypothesis?
A)There is sufficient evidence to support the claim μ 130.
B)There is sufficient evidence to reject the claim μ 130.
C)There is not sufficient evidence to reject the claim μ 130.
D)There is not sufficient evidence to support the claim μ 13130.
A)There is sufficient evidence to support the claim μ 130.
B)There is sufficient evidence to reject the claim μ 130.
C)There is not sufficient evidence to reject the claim μ 130.
D)There is not sufficient evidence to support the claim μ 13130.
Unlock Deck
Unlock for access to all 159 flashcards in this deck.
Unlock Deck
k this deck
30
A candidate for governor of a certain state claims to be favored by at least half of the voters. Identify the type I
and type II errors for the hypothesis test of this claim.
and type II errors for the hypothesis test of this claim.
Unlock Deck
Unlock for access to all 159 flashcards in this deck.
Unlock Deck
k this deck
31
The owner of a professional basketball team claims that the mean attendance at games is over 22,000 and therefore the team needs a new arena. Determine whether the hypothesis test for this claim is left-tailed,
Right-tailed, or two-tailed.
A)right-tailed
B)left-tailed
C)two-tailed
Right-tailed, or two-tailed.
A)right-tailed
B)left-tailed
C)two-tailed
Unlock Deck
Unlock for access to all 159 flashcards in this deck.
Unlock Deck
k this deck
32
An elementary school claims that the standard deviation in reading scores of its fourth grade students is less than 3.75. Determine whether the hypothesis test for this claim is left-tailed, right-tailed, or two-tailed.
A)left-tailed
B)right-tailed
C)two-tailed
A)left-tailed
B)right-tailed
C)two-tailed
Unlock Deck
Unlock for access to all 159 flashcards in this deck.
Unlock Deck
k this deck
33
A car maker claims that its new sub-compact car gets better than 49 miles per gallon on the highway. Determine whether the hypothesis test for this is left-tailed, right-tailed, or two-tailed.
A)right-tailed
B)left-tailed
C)two-tailed
A)right-tailed
B)left-tailed
C)two-tailed
Unlock Deck
Unlock for access to all 159 flashcards in this deck.
Unlock Deck
k this deck
34
A candidate for governor of a certain state claims to be favored by at least half of the voters. If a hypothesis test is performed, how should you interpret a decision that rejects the null hypothesis?
A)There is sufficient evidence to reject the claim ρ
B)There is not sufficient evidence to reject the claiclaim
C)There is sufficient evidence to support the claim ρ
D)There is not sufficient evidence to support the claim ρ
A)There is sufficient evidence to reject the claim ρ
B)There is not sufficient evidence to reject the claiclaim
C)There is sufficient evidence to support the claim ρ
D)There is not sufficient evidence to support the claim ρ
Unlock Deck
Unlock for access to all 159 flashcards in this deck.
Unlock Deck
k this deck
35
The mean age of bus drivers in Chicago is 50.3 years. If a hypothesis test is performed, how should you interpret a decision that fails to reject the null hypothesis?
A)There is not sufficient evidence to reject the claim μ = 50.3.
B)There is sufficient evidence to reject the claim μ = 50.3.
C)There is sufficient evidence to support the claim μ = 50.3.
D)There is not sufficient evidence to support the claim μ = 50.3.
A)There is not sufficient evidence to reject the claim μ = 50.3.
B)There is sufficient evidence to reject the claim μ = 50.3.
C)There is sufficient evidence to support the claim μ = 50.3.
D)There is not sufficient evidence to support the claim μ = 50.3.
Unlock Deck
Unlock for access to all 159 flashcards in this deck.
Unlock Deck
k this deck
36
The dean of a major university claims that the mean time for students to earn a Masterʹs degree is at most 4.1 years. If a hypothesis test is performed, how should you interpret a decision that fails to reject the null
Hypothesis?
A)There is not sufficient evidence to reject the claim
B)There is sufficient evidence to reject the claim 4.4.1.
C)There is sufficient evidence to support the claim ≤ 4.1.
D)There is not sufficient evidence to support the claim 4.1.
Hypothesis?
A)There is not sufficient evidence to reject the claim
B)There is sufficient evidence to reject the claim 4.4.1.
C)There is sufficient evidence to support the claim ≤ 4.1.
D)There is not sufficient evidence to support the claim 4.1.
Unlock Deck
Unlock for access to all 159 flashcards in this deck.
Unlock Deck
k this deck
37
The dean of a major university claims that the mean time for students to earn a Masterʹs degree is at most 3.5 years. If a hypothesis test is performed, how should you interpret a decision that rejects the null hypothesis?
A)There is sufficient evidence to reject the claim 3.5.
B)There is not sufficient evidence to reject the claim 3.5.
C)There is sufficient evidence to support the claim 3.5.
D)There is not sufficient evidence to support the claim 3.5.
A)There is sufficient evidence to reject the claim 3.5.
B)There is not sufficient evidence to reject the claim 3.5.
C)There is sufficient evidence to support the claim 3.5.
D)There is not sufficient evidence to support the claim 3.5.
Unlock Deck
Unlock for access to all 159 flashcards in this deck.
Unlock Deck
k this deck
38
The mean age of bus drivers in Chicago is greater than 54.1 years. If a hypothesis test is performed, how should you interpret a decision that rejects the null hypothesis?
A)There is sufficient evidence to support the claim μ 54.1.
B)There is sufficient evidence to reject the claim μ 54.1.
C)There is not sufficient evidence to reject the claiclaim
> 54.1.
D)There is not sufficient evidence to support the claim μ 54.1.
A)There is sufficient evidence to support the claim μ 54.1.
B)There is sufficient evidence to reject the claim μ 54.1.
C)There is not sufficient evidence to reject the claiclaim
> 54.1.
D)There is not sufficient evidence to support the claim μ 54.1.
Unlock Deck
Unlock for access to all 159 flashcards in this deck.
Unlock Deck
k this deck
39
A brewery claims that the mean amount of beer in their bottles is at least 12 ounces. Determine whether the hypothesis test for this claim is left-tailed, right-tailed, or two-tailed.
A)left-tailed
B)right-tailed
C)two-tailed
A)left-tailed
B)right-tailed
C)two-tailed
Unlock Deck
Unlock for access to all 159 flashcards in this deck.
Unlock Deck
k this deck
40
The mean age of bus drivers in Chicago is 51.5 years. If a hypothesis test is performed, how should you interpret a decision that rejects the null hypothesis?
A)There is sufficient evidence to reject the claim μ = 51.5.
B)There is not sufficient evidence to reject the claim μ = 51.5.
C)There is sufficient evidence to support the claim μ = 51.5.
D)There is not sufficient evidence to support the claim μ = 51.5.
A)There is sufficient evidence to reject the claim μ = 51.5.
B)There is not sufficient evidence to reject the claim μ = 51.5.
C)There is sufficient evidence to support the claim μ = 51.5.
D)There is not sufficient evidence to support the claim μ = 51.5.
Unlock Deck
Unlock for access to all 159 flashcards in this deck.
Unlock Deck
k this deck
41
Find the critical value and rejection region for the type of z-test with level of significance α Two-tailed test, α
A)
B)
C)
D)
A)
B)
C)
D)
Unlock Deck
Unlock for access to all 159 flashcards in this deck.
Unlock Deck
k this deck
42
Find the P-value for the hypothesis test with the standardized test statistic z. Decide whether to reject for the level of significance α Left-tailed test
Z = -1.83 α = 0.05
A)0.0336; reject
B)0.0672; reject
C)0.9664; fail to reject
D)0.0672; fail to reject
Z = -1.83 α = 0.05
A)0.0336; reject
B)0.0672; reject
C)0.9664; fail to reject
D)0.0672; fail to reject
Unlock Deck
Unlock for access to all 159 flashcards in this deck.
Unlock Deck
k this deck
43
Test the claim about the population mean at the level of significance α. Assume the population is normally distributed. Claim:
Sample statistics:
A)Reject . There is enough evidence at the 5% level of significance to support the claim.
B)Fail to reject There is not enough evidence at the 5% level of significance to support the claim.
C)Not enough information to decide.
Sample statistics:
A)Reject . There is enough evidence at the 5% level of significance to support the claim.
B)Fail to reject There is not enough evidence at the 5% level of significance to support the claim.
C)Not enough information to decide.
Unlock Deck
Unlock for access to all 159 flashcards in this deck.
Unlock Deck
k this deck
44
Given which level of confidence should you use to test the claim?
A)90%
B)99%
C)80%
D)95%
A)90%
B)99%
C)80%
D)95%
Unlock Deck
Unlock for access to all 159 flashcards in this deck.
Unlock Deck
k this deck
45
Given for which confidence interval should you reject
A)(13, 16)
B)(11.5, 12.5)
C)(10, 13)
A)(13, 16)
B)(11.5, 12.5)
C)(10, 13)
Unlock Deck
Unlock for access to all 159 flashcards in this deck.
Unlock Deck
k this deck
46
Find the P-value for the hypothesis test with the standardized test statistic z. Decide whether to reject for the level of significance α Two-tailed test
Z = 1.95 = 0.05
A)0.0512; fail to reject
B)0.0256; reject
C)0.0512; reject
D)0.9744; fail to reject
Z = 1.95 = 0.05
A)0.0512; fail to reject
B)0.0256; reject
C)0.0512; reject
D)0.9744; fail to reject
Unlock Deck
Unlock for access to all 159 flashcards in this deck.
Unlock Deck
k this deck
47
Find the critical value and rejection region for the type of z-test with level of significance α. Two-tailed test, α
A)
B)
C)
D)
A)
B)
C)
D)
Unlock Deck
Unlock for access to all 159 flashcards in this deck.
Unlock Deck
k this deck
48
The P-value for a hypothesis test is P = 0.006. Do you reject or fail to reject when the level of significance is α = 0.01?
A)reject
B)fail to reject
C)not sufficient information to decide
A)reject
B)fail to reject
C)not sufficient information to decide
Unlock Deck
Unlock for access to all 159 flashcards in this deck.
Unlock Deck
k this deck
49
The P-value for a hypothesis test is P = 0.066. Do you reject or fail to reject when the level of significance is = 0.05?
A)fail to reject
B)reject
C)not sufficient information to decide
A)fail to reject
B)reject
C)not sufficient information to decide
Unlock Deck
Unlock for access to all 159 flashcards in this deck.
Unlock Deck
k this deck
50
Given for which confidence interval should you reject
A)(0.32, 0.40)
B)(0.40, 0.50)
C)(0.42, 0.47)
A)(0.32, 0.40)
B)(0.40, 0.50)
C)(0.42, 0.47)
Unlock Deck
Unlock for access to all 159 flashcards in this deck.
Unlock Deck
k this deck
51
Find the critical value and rejection region for the type of z-test with level of significance α Right-tailed test, α = 0.01
A)
B)
C)
D)
A)
B)
C)
D)
Unlock Deck
Unlock for access to all 159 flashcards in this deck.
Unlock Deck
k this deck
52
Find the critical value and rejection region for the type of z-test with level of significance α Two-tailed test, α = 0.06
A)-
B)
C)-
D)
A)-
B)
C)-
D)
Unlock Deck
Unlock for access to all 159 flashcards in this deck.
Unlock Deck
k this deck
53
Find the P-value for the hypothesis test with the standardized test statistic z. Decide whether to reject for the level of significance α Left-tailed test
Z = -2.05 = 0.05
The test statistic in a left-tailed test is z = -2.05.
A)0.0202; reject
B)0.4798; fail to reject
C)0.0404; reject
D)0.0453 fail to reject
Z = -2.05 = 0.05
The test statistic in a left-tailed test is z = -2.05.
A)0.0202; reject
B)0.4798; fail to reject
C)0.0404; reject
D)0.0453 fail to reject
Unlock Deck
Unlock for access to all 159 flashcards in this deck.
Unlock Deck
k this deck
54
Find the P-value for the hypothesis test with the standardized test statistic z. Decide whether to reject for the level of significance α Right-tailed test
Z = 1.43 = 0.05
A)0.0764; Fail to reject
B)0.0764; reject
C)0.1528; fail to reject
D)0.1528; reject
Z = 1.43 = 0.05
A)0.0764; Fail to reject
B)0.0764; reject
C)0.1528; fail to reject
D)0.1528; reject
Unlock Deck
Unlock for access to all 159 flashcards in this deck.
Unlock Deck
k this deck
55
Find the P-value for the hypothesis test with the standardized test statistic z. Decide whether to reject H₀ for the level of significance α.
Right-tailed test
Z = 0.52 = 0.05
A)0.3015; Fail to reject
B)0.0195; Reject
C)0.3015; Reject
D)0.6030; Fail to reject H
Right-tailed test
Z = 0.52 = 0.05
A)0.3015; Fail to reject
B)0.0195; Reject
C)0.3015; Reject
D)0.6030; Fail to reject H
Unlock Deck
Unlock for access to all 159 flashcards in this deck.
Unlock Deck
k this deck
56
The P-value for a hypothesis test is P = 0.034. Do you reject or fail to reject when the level of significance is = 0.01?
A)fail to reject
B)reject
C)not sufficient information to decide
A)fail to reject
B)reject
C)not sufficient information to decide
Unlock Deck
Unlock for access to all 159 flashcards in this deck.
Unlock Deck
k this deck
57
Find the P-value for the hypothesis test with the standardized test statistic z. Decide whether to reject for the level of significance α Two-tailed test
Z = -1.63 α = 0.05
A)0.1032; fail to reject
B)0.9484; fail to reject
C)0.0516; reject
D)0.0516; fail to reject
Z = -1.63 α = 0.05
A)0.1032; fail to reject
B)0.9484; fail to reject
C)0.0516; reject
D)0.0516; fail to reject
Unlock Deck
Unlock for access to all 159 flashcards in this deck.
Unlock Deck
k this deck
58
Find the critical value and rejection region for the type of z-test with level of significance α Left-tailed test, α
A)
B)
C)
D)
A)
B)
C)
D)
Unlock Deck
Unlock for access to all 159 flashcards in this deck.
Unlock Deck
k this deck
59
Given = 0.85 and α = 0.10, which level of confidence should you use to test the claim?
A)90%
B)95%
C)99%
D)80%
A)90%
B)95%
C)99%
D)80%
Unlock Deck
Unlock for access to all 159 flashcards in this deck.
Unlock Deck
k this deck
60
Find the critical value and rejection region for the type of z-test with level of significance α Left-tailed test, α
A)
B)
C)
D)
A)
B)
C)
D)
Unlock Deck
Unlock for access to all 159 flashcards in this deck.
Unlock Deck
k this deck
61
Suppose you want to test the claim that = 3.5. Given a sample size of n = 40 and a level of significance of α = 0.05, when should you reject H₀ ?
A)Reject H₀ if the standardized test statistic is greater than 1.96 or less than -1.96.
B)Reject H₀ if the standardized test statistic is greater than 2.33 or less than -2.33.
C)Reject H₀ if the standardized test statistic is greater than 2.575 or less than -2.575
D)Reject H₀ if the standardized test statistic is greater than 1.645 or less than -1.645
Unlock Deck
Unlock for access to all 159 flashcards in this deck.
Unlock Deck
k this deck
62
Test the claim that given that , and the sample statistics are n =
given that , and the sample statistics are n = Unlock Deck
Unlock for access to all 159 flashcards in this deck.
Unlock Deck
k this deck
63
Test the claim that 13, given that and the sample statistics are n = .
13, given that and the sample statistics are n = . Unlock Deck
Unlock for access to all 159 flashcards in this deck.
Unlock Deck
k this deck
64
A local brewery distributes beer in bottles labeled 32 ounces. A government agency thinks that the brewery is
cheating its customers. The agency selects 50 of these bottles, measures their contents, and obtains a sample
mean of 31.7 ounces with a population standard deviation of 0.70 ounce. Use a 0.01 significance level to test the
agencyʹs claim that the brewery is cheating its customers.
cheating its customers. The agency selects 50 of these bottles, measures their contents, and obtains a sample
mean of 31.7 ounces with a population standard deviation of 0.70 ounce. Use a 0.01 significance level to test the
agencyʹs claim that the brewery is cheating its customers.
Unlock Deck
Unlock for access to all 159 flashcards in this deck.
Unlock Deck
k this deck
65
Test the claim that given that and the sample statistics are n =
given that and the sample statistics are n = Unlock Deck
Unlock for access to all 159 flashcards in this deck.
Unlock Deck
k this deck
66
You wish to test the claim that μ ≠ 14 at a level of significance of α = 0.05 and are given sample statistics n = 35, Assume the population standard deviation is 2.7. Compute the value of the standardized test statistic. Round your answer to two decimal places.
A)-1.97
B)-3.12
C)-2.86
D)-1.83
A)-1.97
B)-3.12
C)-2.86
D)-1.83
Unlock Deck
Unlock for access to all 159 flashcards in this deck.
Unlock Deck
k this deck
67
A local politician, running for reelection, claims that the mean prison time for car thieves is less than the
required 4 years. A sample of 80 convicted car thieves was randomly selected, and the mean length of prison
time was found to be 3 years and 6 months, with a population standard deviation of 1 year and 3 months. At α = 0.05, test the politicianʹs claim.
required 4 years. A sample of 80 convicted car thieves was randomly selected, and the mean length of prison
time was found to be 3 years and 6 months, with a population standard deviation of 1 year and 3 months. At
α = 0.05, test the politicianʹs claim. Unlock Deck
Unlock for access to all 159 flashcards in this deck.
Unlock Deck
k this deck
68
Test the claim about the population mean μ at the level of significance α. Assume the population is normally distributed. Claim:
Sample statistics:
A)Reject There is enough evidence at the 1% level of significance to reject the claim.
B)Fail to reject There is enough evidence at the 1% level of significance to support the claim.
C)Not enough information to decide.
Sample statistics:
A)Reject There is enough evidence at the 1% level of significance to reject the claim.
B)Fail to reject There is enough evidence at the 1% level of significance to support the claim.
C)Not enough information to decide.
Unlock Deck
Unlock for access to all 159 flashcards in this deck.
Unlock Deck
k this deck
69
You wish to test the claim that at a level of significance of α = 0.05 and are given sample statistics n = 50, Assume the population standard deviation is 1.2. Compute the value of the standardized test statistic. Round your answer to two decimal places.
A)1.77
B)2.31
C)0.98
D)3.11
A)1.77
B)2.31
C)0.98
D)3.11
Unlock Deck
Unlock for access to all 159 flashcards in this deck.
Unlock Deck
k this deck
70
Test the claim that 40, given that and the sample statistics are n =
40, given that and the sample statistics are n = Unlock Deck
Unlock for access to all 159 flashcards in this deck.
Unlock Deck
k this deck
71
A fast food outlet claims that the mean waiting time in line is less than 3.8 minutes. A random sample of 60
customers has a mean of 3.7 minutes with a population standard deviation of 0.6 minute. If α = 0.05, test the
fast food outletʹs claim.
customers has a mean of 3.7 minutes with a population standard deviation of 0.6 minute. If α
= 0.05, test thefast food outletʹs claim.
Unlock Deck
Unlock for access to all 159 flashcards in this deck.
Unlock Deck
k this deck
72
Suppose you want to test the claim that Given a sample size of n = 35 and a level of significance of α = 0.05, when should you reject H₀?
A)Reject H₀ if the standardized test statistic is less than -1.645.
B)Reject H₀ if the standardized test is less than -1.96.
C)Reject H₀ if the standardized test statistic is less than -1.28.
D)Reject H₀ if the standardized test statistic is less than -2.33.
A)Reject H₀ if the standardized test statistic is less than -1.645.
B)Reject H₀ if the standardized test is less than -1.96.
C)Reject H₀ if the standardized test statistic is less than -1.28.
D)Reject H₀ if the standardized test statistic is less than -2.33.
Unlock Deck
Unlock for access to all 159 flashcards in this deck.
Unlock Deck
k this deck
73
You wish to test the claim that at a level of significance of α = 0.01 and are given sample statistics n = 40, Assume the population standard deviation is 4.3. Compute the value of the standardized test statistic. Round your answer to two decimal places.
A)2.65
B)3.51
C)2.12
D)1.96
A)2.65
B)3.51
C)2.12
D)1.96
Unlock Deck
Unlock for access to all 159 flashcards in this deck.
Unlock Deck
k this deck
74
A local group claims that the police issue at least 60 speeding tickets a day in their area. To prove their point,
they randomly select one month. Their research yields the number of tickets issued for each day. The data are
listed below. Assume the population standard deviation is 12.2 tickets. At α = 0.01, test the groupʹs claim.
they randomly select one month. Their research yields the number of tickets issued for each day. The data are
listed below. Assume the population standard deviation is 12.2 tickets. At α
= 0.01, test the groupʹs claim. Unlock Deck
Unlock for access to all 159 flashcards in this deck.
Unlock Deck
k this deck
75
Test the claim about the population mean μ at the level of significance α Assume the population is normally distributed. Claim:
Sample statistics:
A)Reject There is enough evidence at the 5% level of significance to support the claim.
B)Fail to reject There is not enough evidence at the 5% level of significance to support the claim.
C)Not enough information to decide.
Sample statistics:
A)Reject There is enough evidence at the 5% level of significance to support the claim.
B)Fail to reject There is not enough evidence at the 5% level of significance to support the claim.
C)Not enough information to decide.
Unlock Deck
Unlock for access to all 159 flashcards in this deck.
Unlock Deck
k this deck
76
Suppose you want to test the claim that Given a sample size of n = 55 and a level of significance of α = 0.01, when should you reject H₀?
A)Reject H₀ if the standardized test statistic is greater than 2.33.
B)Reject H₀ if the standardized test statistic is greater than 1.645.
C)Reject H₀ if the standardized test statistic is greater than 1.28.
D)Reject H₀ if the standardized test statistic is greater than 2.575.
A)Reject H₀ if the standardized test statistic is greater than 2.33.
B)Reject H₀ if the standardized test statistic is greater than 1.645.
C)Reject H₀ if the standardized test statistic is greater than 1.28.
D)Reject H₀ if the standardized test statistic is greater than 2.575.
Unlock Deck
Unlock for access to all 159 flashcards in this deck.
Unlock Deck
k this deck
77
You wish to test the claim that = 1430 at a level of significance of α = 0.01 and are given sample statistics Assume the population standard deviation is 82. Compute the value of the standardized test statistic. Round your answer to two decimal places.
A)-2.16
B)-3.82
C)-4.67
D)-5.18
A)-2.16
B)-3.82
C)-4.67
D)-5.18
Unlock Deck
Unlock for access to all 159 flashcards in this deck.
Unlock Deck
k this deck
78
Test the claim about the population mean μ at the level of significance α Assume the population is normally distributed. Claim:
Sample statistics:
A)Fail to reject There is enough evidence at the 1% level of significance to support the claim.
B)Reject . There is enough evidence at the 1% level of significance to reject the claim.
C)Not enough information to decide.
Sample statistics:
A)Fail to reject There is enough evidence at the 1% level of significance to support the claim.
B)Reject . There is enough evidence at the 1% level of significance to reject the claim.
C)Not enough information to decide.
Unlock Deck
Unlock for access to all 159 flashcards in this deck.
Unlock Deck
k this deck
79
A manufacturer claims that the mean lifetime of its fluorescent bulbs is 1500 hours. A homeowner selects 40
bulbs and finds the mean lifetime to be 1480 hours with a population standard deviation of 80 hours. Test the
manufacturerʹs claim. Use = 0.05.
bulbs and finds the mean lifetime to be 1480 hours with a population standard deviation of 80 hours. Test the
manufacturerʹs claim. Use
= 0.05. Unlock Deck
Unlock for access to all 159 flashcards in this deck.
Unlock Deck
k this deck
80
A trucking firm suspects that the mean lifetime of a certain tire it uses is less than 36,000 miles. To check the
claim, the firm randomly selects and tests 54 of these tires and gets a mean lifetime of 35,630 miles with a
population standard deviation of 1200 miles. At α .05, test the trucking firmʹs claim.
claim, the firm randomly selects and tests 54 of these tires and gets a mean lifetime of 35,630 miles with a
population standard deviation of 1200 miles. At α
.05, test the trucking firmʹs claim. Unlock Deck
Unlock for access to all 159 flashcards in this deck.
Unlock Deck
k this deck
Unlock Deck
Unlock for access to all 159 flashcards in this deck.


