Deck 8: Hypothesis Testing With Two Samples
Full screen (f)
Question
Question
Question
Question
Question
Question
Question
Question
Question
Question
Question
Question
Question
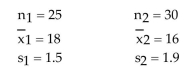
Test the claim that  Assume the two samples are random and independent. Use
  = 0.05.
Population statistics: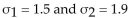 Sample statisticsstatistics:
Assume the two samples are random and independent. Use = 0.05.Population statistics:
Sample statisticsstatistics: Question
Question
Question
Question
Question
Question
Question
Question
Test the claim that  Assume the two samples are random and independent. Use
  Population statistics:
 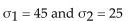 Sample statisticsstatistics:
Assume the two samples are random and independent. Use Population statistics: Sample statisticsstatistics: Question
A recent study of 100 elementary school teachers in a southern state found that their mean salary was $24,700
with a population standard deviation of $2100. A similar study of 100 elementary school teachers in a western
state found that their mean salary was $35,100 with a population standard deviation of $3200. Test the claim
that the salaries of elementary school teachers in the western state is more than $10,000 greater than that of
elementary teachers in the southern state. Use = 0.05. Assume the two samples are random and independent.
with a population standard deviation of $2100. A similar study of 100 elementary school teachers in a western
state found that their mean salary was $35,100 with a population standard deviation of $3200. Test the claim
that the salaries of elementary school teachers in the western state is more than $10,000 greater than that of
elementary teachers in the southern state. Use
= 0.05. Assume the two samples are random and independent. Question
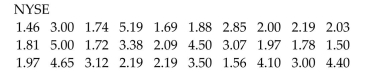
At α  = 0.05, test a financial advisorʹs claim that the difference between the mean dividend rate for listings in the
NYSE market and the mean dividend rate for listings in the NASDAQ market is more than 0.75. Assume the
two samples are random and independent.

= 0.05, test a financial advisorʹs claim that the difference between the mean dividend rate for listings in theNYSE market and the mean dividend rate for listings in the NASDAQ market is more than 0.75. Assume the
two samples are random and independent.
Question
Question
A financial advisor wants to know whether there is a significant difference between the NYSE and NASDAQ
markets in the annual dividend rates for preferred stocks. A sample of 30 returns is selected from each market.
Assume the two samples are random and independent. Test the claim that there is no difference in the annual
dividend rates for the two markets. Use = 0.05.
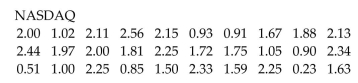
markets in the annual dividend rates for preferred stocks. A sample of 30 returns is selected from each market.
Assume the two samples are random and independent. Test the claim that there is no difference in the annual
dividend rates for the two markets. Use
= 0.05. Question
Two groups of patients with colorectal cancer are treated with a different drug to reduce pain. A random
sample of 140 patients are treated using the drug Irinotican and a random sample of 127 patients are treated
using the drug Fluorouracil. Assume the two samples are random and independent. At α = 0.01, test a
pharmaceutical representativeʹs claim that the difference between the mean number of pain-free months for
patients using Fluorouracil and the mean number of pain-free months for patients using Irinotican is less than
two months.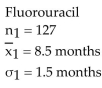
sample of 140 patients are treated using the drug Irinotican and a random sample of 127 patients are treated
using the drug Fluorouracil. Assume the two samples are random and independent. At α
= 0.01, test apharmaceutical representativeʹs claim that the difference between the mean number of pain-free months for
patients using Fluorouracil and the mean number of pain-free months for patients using Irinotican is less than
two months.
Question
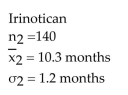
A medical researcher suspects that the pulse rate of smokers is higher than the pulse rate of non-smokers. Test
the researcherʹs suspicion using α = 0.05. Assume the two samples are random and independent.
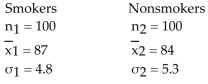
the researcherʹs suspicion using α
= 0.05. Assume the two samples are random and independent. Question
A statistics teacher believes that students in an evening statistics class score higher than the students in a day
class. The results of a special exam are shown below. Assume the two samples are random and independent.
Can the teacher conclude that the evening students have a higher score? Use
class. The results of a special exam are shown below. Assume the two samples are random and independent.
Can the teacher conclude that the evening students have a higher score? Use
Question
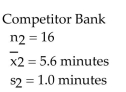
A local bank claims that the waiting time for its customers to be served is the lowest in the area. A competitor
bank checks the waiting times at both banks. Use P-values to test the local bankʹs claim. Use = 0.05. Assume
the two samples are random and independent.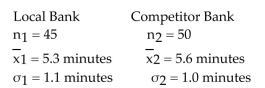
bank checks the waiting times at both banks. Use P-values to test the local bankʹs claim. Use
= 0.05. Assumethe two samples are random and independent.
Question
Test the claim that  Assume the two samples are random and independent. Use
  Population statistics:
 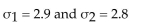 Sample statistics:
Assume the two samples are random and independent. Use Population statistics: Sample statistics: Question
Question
A local bank claims that the waiting time for its customers to be served is the lowest in the area. A competitor
bank checks the waiting times at both banks. Assume the two samples are random and independent. Use α = 0.05 and a confidence interval to test the local bankʹs claim.
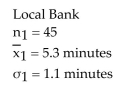
bank checks the waiting times at both banks. Assume the two samples are random and independent. Use
α = 0.05 and a confidence interval to test the local bankʹs claim. Question
Question
A study was conducted to determine if the salaries of elementary school teachers from two neighboring states
were equal. A sample of 100 teachers from each state was randomly selected. The mean from the first state was
$29,100 with a population standard deviation of $2300. The mean from the second state was $30,500 with a
population standard deviation of $2100. Test the claim that the salaries from both states are equal. Use
Question
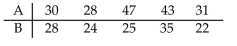
A statistics teacher wanted to see whether there was a significant difference in ages between day students and
night students. A sample of 35 students is selected from each group. The data are given below. Assume the two
samples are random and independent. Test the claim that there is no difference in age between the two groups.
Use α Day Students
 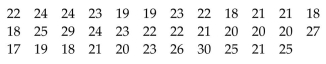 Evening Students
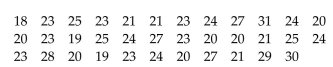
night students. A sample of 35 students is selected from each group. The data are given below. Assume the two
samples are random and independent. Test the claim that there is no difference in age between the two groups.
Use α
Day Students Evening Students Question
Question
Test the claim thathat  Assume the two samples are random and independent. Use
  Population statistics:
 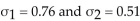 Sample statistics:
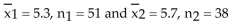
Assume the two samples are random and independent. Use Population statistics: Sample statistics: Question
At a local college, 65 female students were randomly selected and it was found that their mean monthly income
was $616 with a population standard deviation of $121.50. Seventy-five male students were also randomly
selected and their mean monthly income was found to be $658 with a population standard deviation of $168.70.
Test the claim that male students have a higher monthly income than female students. Use
Question
Question
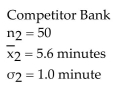
A local bank claims that the waiting time for its customers to be served is the lowest in the area. A competitor
bank checks the waiting times at both banks. Test the local bankʹs claim using α = 0.05. Assume the two
samples are random and independent.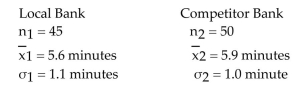
bank checks the waiting times at both banks. Test the local bankʹs claim using α
= 0.05. Assume the twosamples are random and independent.
Question
Question
Question
A researcher wishes to determine whether people with high blood pressure can lower their blood pressure by
following a certain diet. A treatment group and a control group are selected. Assume the two samples are
random and independent. Construct a 90% confidence interval for the difference between the two population
means, Would you recommend using this diet plan? Explain your reasoning.
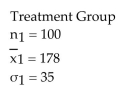
following a certain diet. A treatment group and a control group are selected. Assume the two samples are
random and independent. Construct a 90% confidence interval for the difference between the two population
means,
Would you recommend using this diet plan? Explain your reasoning. Question
Question
Question
Question
Question
Test the claim that  Two samples are random, independent, and come from populations that are
normally distributed. The sample statistics are given below. Assume that Use
Use  = 0.05.
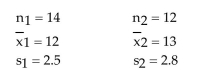
Two samples are random, independent, and come from populations that arenormally distributed. The sample statistics are given below. Assume that
Use = 0.05. Question
Question
Question
Test the claim that  Two samples are random, independent, and come from populations that are
normally distributed. The sample statistics are given below. Assume that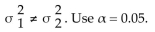
Two samples are random, independent, and come from populations that arenormally distributed. The sample statistics are given below. Assume that
Question
Test the claim that  Two samples are random, independent, and come from populations that are
normally distributed. The sample statistics are given below. Assume that . Use
. Use  = 0.01.
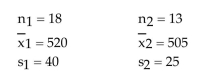
Two samples are random, independent, and come from populations that arenormally distributed. The sample statistics are given below. Assume that
. Use = 0.01. Question
Question
Question
Question
Question
Question
Question
Question
Question
Question
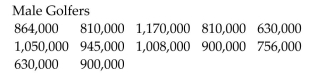
A womenʹs advocacy group claims that women golfers receive significantly less prize money than their male
counterparts when they win first place in a professional tournament. The data listed below are the first place
prize monies from male and female tournament winners. Assume the samples are random, independent, and
come from populations that are normally distributed. At α = 0.01, test the groupʹs claim. Assume the
population variances are not equal.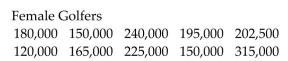
counterparts when they win first place in a professional tournament. The data listed below are the first place
prize monies from male and female tournament winners. Assume the samples are random, independent, and
come from populations that are normally distributed. At α
= 0.01, test the groupʹs claim. Assume thepopulation variances are not equal.
Question
Question
Question
Question
A local bank claims that the waiting time for its customers to be served is the lowest in the area. A competitorʹs
bank checks the waiting times at both banks. Assume the samples are random and independent, and the
populations are normally distributed. Test the local bankʹs claim: (a)assuming that assuming that
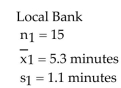
bank checks the waiting times at both banks. Assume the samples are random and independent, and the
populations are normally distributed. Test the local bankʹs claim: (a)assuming that
assuming that Question
A womenʹs advocacy group claims that women golfers receive significantly less prize money than their male
counterparts when they win first place in a professional tournament. The data listed below are the first place
prize monies from male and female tournament winners. Assume the samples are random, independent, and
come from populations that are normally distributed. Construct a 99% confidence interval for the difference in
the means Assume the population variances are not equal.
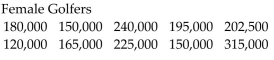
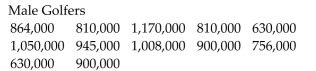
counterparts when they win first place in a professional tournament. The data listed below are the first place
prize monies from male and female tournament winners. Assume the samples are random, independent, and
come from populations that are normally distributed. Construct a 99% confidence interval for the difference in
the means
Assume the population variances are not equal. Question
Test the claim that  Two samples are random, independent, and come from populations that are
normally distributed. The sample statistics are given below. Assume that
Two samples are random, independent, and come from populations that arenormally distributed. The sample statistics are given below. Assume that
Question
Question
Question
A study was conducted to determine if the salaries of elementary school teachers from two neighboring
districts were equal. A sample of 15 teachers from each district was randomly selected. The mean from the first
district was $28,900 with a standard deviation of $2300. The mean from the second district was $30,300 with a
standard deviation of $2100. Test the claim that the salaries from both districts are equal. Assume the samples
are random and independent, and the populations are normally distributed. Also, assume that Use
Use 
districts were equal. A sample of 15 teachers from each district was randomly selected. The mean from the first
district was $28,900 with a standard deviation of $2300. The mean from the second district was $30,300 with a
standard deviation of $2100. Test the claim that the salaries from both districts are equal. Assume the samples
are random and independent, and the populations are normally distributed. Also, assume that
Use Question
Question
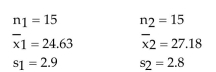
Test the claim that the paired sample data is from a population with a mean difference of 0. Assume the
samples are random and dependent, and the populations are normally distributed. Use
samples are random and dependent, and the populations are normally distributed. Use
Question
Question
Question
A sports analyst claims that the mean batting average for teams in the American League is not equal to the
mean batting average for teams in the National League because a pitcher does not bat in the American League.
The data listed below are random, independent, and come from populations that are normally distributed. At α = 0.05, test the sports analystʹs claim. Assume the population variances are equal.
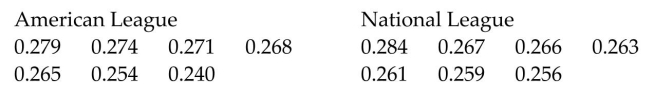
mean batting average for teams in the National League because a pitcher does not bat in the American League.
The data listed below are random, independent, and come from populations that are normally distributed. At
α = 0.05, test the sports analystʹs claim. Assume the population variances are equal. Question
A sports analyst claims that the mean batting average for teams in the American League is not equal to the
mean batting average for teams in the National League because a pitcher does not bat in the American League.
The data listed below are random, independent, and come from populations that are normally distributed.
Construct a 95% confidence interval for the difference in the means Assume the population variances
are equal.
mean batting average for teams in the National League because a pitcher does not bat in the American League.
The data listed below are random, independent, and come from populations that are normally distributed.
Construct a 95% confidence interval for the difference in the means
Assume the population variancesare equal.
Question
Question
Test the claim that  Two samples are random, independent, and come from populations that are
normally distributed. The sample statistics are given below. Assume that
Two samples are random, independent, and come from populations that arenormally distributed. The sample statistics are given below. Assume that
Question

Unlock Deck
Sign up to unlock the cards in this deck!
Unlock Deck
Unlock Deck
1/122
Play
Full screen (f)
Deck 8: Hypothesis Testing With Two Samples
1
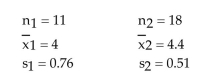
Find the standardized test statistic to test the claim that Assume the two samples are random and independent.
Population statistics: Sample statisticsstatistics:
A)-3.90
B)-3.16
C)-2.63
D)-1.66
Population statistics: Sample statisticsstatistics:
A)-3.90
B)-3.16
C)-2.63
D)-1.66
-3.90
2
Suppose you want to test the claim that Assume the two samples are random and independent. If a hypothesis test is performed, how should you interpret a decision that rejects the null hypothesis?
A)There is sufficient evidence to support the claim μ
B)There is sufficient evidence to reject the claim μ
C)There is not sufficient evidence to reject the claim μ
D)There is not sufficient evidence to support the claim μ
A)There is sufficient evidence to support the claim μ
B)There is sufficient evidence to reject the claim μ
C)There is not sufficient evidence to reject the claim μ
D)There is not sufficient evidence to support the claim μ
There is sufficient evidence to support the claim μ
3
Classify the two given samples as independent or dependent. Sample 1: The scores of 22 students who took the ACT
Sample 2: The scores of 22 different students who took the SAT
A)independent
B)dependent
Sample 2: The scores of 22 different students who took the SAT
A)independent
B)dependent
independent
4
Classify the two given samples as independent or dependent. Sample 1: The weights in pounds of 21 newborn females
Sample 2: The weights in pounds of 21 newborn males
A)independent
B)dependent
Sample 2: The weights in pounds of 21 newborn males
A)independent
B)dependent
Unlock Deck
Unlock for access to all 122 flashcards in this deck.
Unlock Deck
k this deck
5
Suppose you want to test the claim that Assume the two samples are random and independent. At a level of significance of α = 0.02, when should you reject H₀?
Population statistics: Sample statisticsstatistics:
A)Reject H₀ if the standardized test statistic is less than -2.33 or greater than 2.33.
B)Reject H₀ if the standardized test statistic is less than -1.96 or greater than 1.96.
C)Reject H₀ if the standardized test statistic is less than -1.645 or greater than 1.645.
D)Reject H₀ if the standardized test statistic is less than -2.575 or greater than 2.575.
Unlock Deck
Unlock for access to all 122 flashcards in this deck.
Unlock Deck
k this deck
6
Find the standardized test statistic to test the claim that Assume the two samples are random and independent.
Population statistics: Sample statisticsstatistics:
A)6.2
B)8.1
C)4.2
D)3.8
Population statistics: Sample statisticsstatistics:
A)6.2
B)8.1
C)4.2
D)3.8
Unlock Deck
Unlock for access to all 122 flashcards in this deck.
Unlock Deck
k this deck
7
As part of a Masterʹs thesis project, a mathematics teacher is interested in the effects of two different teaching methods on mathematics achievement. She randomly chooses one class of students to learn an algebraic
Concept using traditional methods and another class of students to learn the same algebraic concept using
Manipulatives. The teacher then compares their test scores. Determine whether the samples are dependent or
Independent.
A)independent
B)dependent
Concept using traditional methods and another class of students to learn the same algebraic concept using
Manipulatives. The teacher then compares their test scores. Determine whether the samples are dependent or
Independent.
A)independent
B)dependent
Unlock Deck
Unlock for access to all 122 flashcards in this deck.
Unlock Deck
k this deck
8
Suppose you want to test the claim that AssumAssume the two samples are random and independent. At a level of significance of α = 0.01, when should you reject H₀?
Population statistics: Sample statistics:
A)Reject H₀ if the standardized test statistic is greater than 2.33.
B)Reject H₀ if the standardized test statistic is greater than 1.96.
C)Reject H₀ if the standardized test statistic is greater than 1.645.
D)Reject H₀ if the standardized test statistic is greater than 2.575.
Unlock Deck
Unlock for access to all 122 flashcards in this deck.
Unlock Deck
k this deck
9
Find the standardized test statistic to test the claim that . Assume the two samples are random and independent.
Population statistics: Sample statistics:
A)-1.6
B)-0.8
C)-2.6
D)-1.0
Population statistics: Sample statistics:
A)-1.6
B)-0.8
C)-2.6
D)-1.0
Unlock Deck
Unlock for access to all 122 flashcards in this deck.
Unlock Deck
k this deck
10
Find the standardized test statistic to test the claim that Assume the two samples are random and independent.
Population statistics: Sample statistics:
A)-2.97
B)-1.82
C)-2.12
D)-2.32
Population statistics: Sample statistics:
A)-2.97
B)-1.82
C)-2.12
D)-2.32
Unlock Deck
Unlock for access to all 122 flashcards in this deck.
Unlock Deck
k this deck
11
Suppose you want to test the claim that Assume the two samples are random and independent. If a hypothesis test is performed, how should you interpret a decision that rejects the null hypothesis?
A)There is sufficient evidence to reject the claim μ
B)There is not sufficient evidence to reject the claim μ
C)There is sufficient evidence to support the claim μ
D)There is not sufficient evidence to support the claim μ
A)There is sufficient evidence to reject the claim μ
B)There is not sufficient evidence to reject the claim μ
C)There is sufficient evidence to support the claim μ
D)There is not sufficient evidence to support the claim μ
Unlock Deck
Unlock for access to all 122 flashcards in this deck.
Unlock Deck
k this deck
12
Suppose you want to test the claim that Assume the two samples are random and independent. At a level of significance of α = 0.05, when should you reject H₀?
Population statistics: Sample statistics:
A)Reject H₀ if the standardized test statistic is less than -1.96 or greater than 1.96.
B)Reject H₀ if the standardized test statistic is less than -2.33 or greater than 2.33.
C)Reject H₀ if the standardized test statistic is less than -1.645 or greater than 1.645.
D)Reject H₀ if the standardized test statistic is less than -2.575 or greater than 2.575.
Unlock Deck
Unlock for access to all 122 flashcards in this deck.
Unlock Deck
k this deck
13
Test the claim that Assume the two samples are random and independent. Use = 0.05.
Population statistics: Sample statisticsstatistics:
Assume the two samples are random and independent. Use = 0.05.Population statistics:
Sample statisticsstatistics: Unlock Deck
Unlock for access to all 122 flashcards in this deck.
Unlock Deck
k this deck
14
Classify the two given samples as independent or dependent. Sample 1: Pre-training weights of 18 people
Sample 2: Post-training weights of 18 people
A)dependent
B)independent
Sample 2: Post-training weights of 18 people
A)dependent
B)independent
Unlock Deck
Unlock for access to all 122 flashcards in this deck.
Unlock Deck
k this deck
15
Suppose you want to test the claim that Assume the two samples are random and independent. If a hypothesis test is performed, how should you interpret a decision that fails to reject the null hypothesis?
A)There is not sufficient evidence to support the claim μ
B)There is sufficient evidence to reject the claim μ
C)There is not sufficient evidence to reject the claim μ .
D)There is sufficient evidence to support the claim μ
A)There is not sufficient evidence to support the claim μ
B)There is sufficient evidence to reject the claim μ
C)There is not sufficient evidence to reject the claim μ .
D)There is sufficient evidence to support the claim μ
Unlock Deck
Unlock for access to all 122 flashcards in this deck.
Unlock Deck
k this deck
16
As part of a marketing experiment, a department store regularly mailed discount coupons to 25 of its credit card holders. Their total credit card purchases over the next three months were compared to their prior credit
Card purchases during the previous three months. Determine whether the samples are dependent or
Independent.
A)dependent
B)independent
Card purchases during the previous three months. Determine whether the samples are dependent or
Independent.
A)dependent
B)independent
Unlock Deck
Unlock for access to all 122 flashcards in this deck.
Unlock Deck
k this deck
17
Suppose you want to test the claim that Assume the two samples are random and independent. At a level of significance of α = 0.05, when should you reject H₀?
Population statistics: Sample statistics:
A)Reject H₀ if the standardized test statistic is less than -1.645.
B)Reject H₀ if the standardized test statistic is less than -1.96.
C)Reject H₀ if the standardized test statistic is less than -2.33.
D)Reject H₀ if the standardized test statistic is less than -2.575.
Unlock Deck
Unlock for access to all 122 flashcards in this deck.
Unlock Deck
k this deck
18
Find the standardized test statistic to test the claim that Assume the two samples are random and independent.
Population statistics: Sample statistics:
A)2.99
B)2.81
C)1.86
D)0.91
Population statistics: Sample statistics:
A)2.99
B)2.81
C)1.86
D)0.91
Unlock Deck
Unlock for access to all 122 flashcards in this deck.
Unlock Deck
k this deck
19
As part of a marketing experiment, a department store regularly mailed discount coupons to 25 of its credit card holders. Their total credit card purchases over the next three months were compared to the credit card
Purchases over the next three months for 25 credit card holders who were not sent discount coupons.
Determine whether the samples are dependent or independent.
A)independent
B)dependent
Purchases over the next three months for 25 credit card holders who were not sent discount coupons.
Determine whether the samples are dependent or independent.
A)independent
B)dependent
Unlock Deck
Unlock for access to all 122 flashcards in this deck.
Unlock Deck
k this deck
20
As part of a Masterʹs thesis project, a mathematics teacher is interested in the effects of two different teaching methods on mathematics achievement. She randomly chooses a class of students to learn one algebraic concept
Using traditional methods. Then on another day, the same students learn a similar algebraic concept using
Manipulatives. The teacher then compares their test scores. Determine whether the samples are dependent or
Independent.
A)dependent
B)independent
Using traditional methods. Then on another day, the same students learn a similar algebraic concept using
Manipulatives. The teacher then compares their test scores. Determine whether the samples are dependent or
Independent.
A)dependent
B)independent
Unlock Deck
Unlock for access to all 122 flashcards in this deck.
Unlock Deck
k this deck
21
Test the claim that Assume the two samples are random and independent. Use Population statistics: Sample statisticsstatistics:
Assume the two samples are random and independent. Use Population statistics: Sample statisticsstatistics: Unlock Deck
Unlock for access to all 122 flashcards in this deck.
Unlock Deck
k this deck
22
A recent study of 100 elementary school teachers in a southern state found that their mean salary was $24,700
with a population standard deviation of $2100. A similar study of 100 elementary school teachers in a western
state found that their mean salary was $35,100 with a population standard deviation of $3200. Test the claim
that the salaries of elementary school teachers in the western state is more than $10,000 greater than that of
elementary teachers in the southern state. Use = 0.05. Assume the two samples are random and independent.
with a population standard deviation of $2100. A similar study of 100 elementary school teachers in a western
state found that their mean salary was $35,100 with a population standard deviation of $3200. Test the claim
that the salaries of elementary school teachers in the western state is more than $10,000 greater than that of
elementary teachers in the southern state. Use
= 0.05. Assume the two samples are random and independent. Unlock Deck
Unlock for access to all 122 flashcards in this deck.
Unlock Deck
k this deck
23
At α = 0.05, test a financial advisorʹs claim that the difference between the mean dividend rate for listings in the
NYSE market and the mean dividend rate for listings in the NASDAQ market is more than 0.75. Assume the
two samples are random and independent.
= 0.05, test a financial advisorʹs claim that the difference between the mean dividend rate for listings in theNYSE market and the mean dividend rate for listings in the NASDAQ market is more than 0.75. Assume the
two samples are random and independent.
Unlock Deck
Unlock for access to all 122 flashcards in this deck.
Unlock Deck
k this deck
24
Suppose you want to test the claim that Assume the two samples are random and independent. If a hypothesis test is performed, how should you interpret a decision that fails to reject the null hypothesis?
A)There is not sufficient evidence to support the claim μ
B)There is sufficient evidence to reject the claim μ
C)There is not sufficient evidence to reject the claim μ
D)There is sufficient evidence to support the claim μ
A)There is not sufficient evidence to support the claim μ
B)There is sufficient evidence to reject the claim μ
C)There is not sufficient evidence to reject the claim μ
D)There is sufficient evidence to support the claim μ
Unlock Deck
Unlock for access to all 122 flashcards in this deck.
Unlock Deck
k this deck
25
A financial advisor wants to know whether there is a significant difference between the NYSE and NASDAQ
markets in the annual dividend rates for preferred stocks. A sample of 30 returns is selected from each market.
Assume the two samples are random and independent. Test the claim that there is no difference in the annual
dividend rates for the two markets. Use = 0.05.
markets in the annual dividend rates for preferred stocks. A sample of 30 returns is selected from each market.
Assume the two samples are random and independent. Test the claim that there is no difference in the annual
dividend rates for the two markets. Use
= 0.05. Unlock Deck
Unlock for access to all 122 flashcards in this deck.
Unlock Deck
k this deck
26
Two groups of patients with colorectal cancer are treated with a different drug to reduce pain. A random
sample of 140 patients are treated using the drug Irinotican and a random sample of 127 patients are treated
using the drug Fluorouracil. Assume the two samples are random and independent. At α = 0.01, test a
pharmaceutical representativeʹs claim that the difference between the mean number of pain-free months for
patients using Fluorouracil and the mean number of pain-free months for patients using Irinotican is less than
two months.
sample of 140 patients are treated using the drug Irinotican and a random sample of 127 patients are treated
using the drug Fluorouracil. Assume the two samples are random and independent. At α
= 0.01, test apharmaceutical representativeʹs claim that the difference between the mean number of pain-free months for
patients using Fluorouracil and the mean number of pain-free months for patients using Irinotican is less than
two months.
Unlock Deck
Unlock for access to all 122 flashcards in this deck.
Unlock Deck
k this deck
27
A medical researcher suspects that the pulse rate of smokers is higher than the pulse rate of non-smokers. Test
the researcherʹs suspicion using α = 0.05. Assume the two samples are random and independent.
the researcherʹs suspicion using α
= 0.05. Assume the two samples are random and independent. Unlock Deck
Unlock for access to all 122 flashcards in this deck.
Unlock Deck
k this deck
28
A statistics teacher believes that students in an evening statistics class score higher than the students in a day
class. The results of a special exam are shown below. Assume the two samples are random and independent.
Can the teacher conclude that the evening students have a higher score? Use
class. The results of a special exam are shown below. Assume the two samples are random and independent.
Can the teacher conclude that the evening students have a higher score? Use
Unlock Deck
Unlock for access to all 122 flashcards in this deck.
Unlock Deck
k this deck
29
A local bank claims that the waiting time for its customers to be served is the lowest in the area. A competitor
bank checks the waiting times at both banks. Use P-values to test the local bankʹs claim. Use = 0.05. Assume
the two samples are random and independent.
bank checks the waiting times at both banks. Use P-values to test the local bankʹs claim. Use
= 0.05. Assumethe two samples are random and independent.
Unlock Deck
Unlock for access to all 122 flashcards in this deck.
Unlock Deck
k this deck
30
Test the claim that Assume the two samples are random and independent. Use Population statistics: Sample statistics:
Assume the two samples are random and independent. Use Population statistics: Sample statistics: Unlock Deck
Unlock for access to all 122 flashcards in this deck.
Unlock Deck
k this deck
31
Two samples are random and independent. Find the P-value used to test the claim that Population statistics: Sample statistics:
A)0.0005
B)0.0505
C)0.1015
D)0.5105
A)0.0005
B)0.0505
C)0.1015
D)0.5105
Unlock Deck
Unlock for access to all 122 flashcards in this deck.
Unlock Deck
k this deck
32
A local bank claims that the waiting time for its customers to be served is the lowest in the area. A competitor
bank checks the waiting times at both banks. Assume the two samples are random and independent. Use α = 0.05 and a confidence interval to test the local bankʹs claim.
bank checks the waiting times at both banks. Assume the two samples are random and independent. Use
α = 0.05 and a confidence interval to test the local bankʹs claim. Unlock Deck
Unlock for access to all 122 flashcards in this deck.
Unlock Deck
k this deck
33
Two samples are random and independent. Find the P-value used to test the claim that Population statistics: Sample statisticsstatistics:
A)0.1052
B)0.0526
C)0.4020
D)0.1138
A)0.1052
B)0.0526
C)0.4020
D)0.1138
Unlock Deck
Unlock for access to all 122 flashcards in this deck.
Unlock Deck
k this deck
34
A study was conducted to determine if the salaries of elementary school teachers from two neighboring states
were equal. A sample of 100 teachers from each state was randomly selected. The mean from the first state was
$29,100 with a population standard deviation of $2300. The mean from the second state was $30,500 with a
population standard deviation of $2100. Test the claim that the salaries from both states are equal. Use
were equal. A sample of 100 teachers from each state was randomly selected. The mean from the first state was
$29,100 with a population standard deviation of $2300. The mean from the second state was $30,500 with a
population standard deviation of $2100. Test the claim that the salaries from both states are equal. Use
Unlock Deck
Unlock for access to all 122 flashcards in this deck.
Unlock Deck
k this deck
35
A statistics teacher wanted to see whether there was a significant difference in ages between day students and
night students. A sample of 35 students is selected from each group. The data are given below. Assume the two
samples are random and independent. Test the claim that there is no difference in age between the two groups.
Use α Day Students Evening Students
night students. A sample of 35 students is selected from each group. The data are given below. Assume the two
samples are random and independent. Test the claim that there is no difference in age between the two groups.
Use α
Day Students Evening Students Unlock Deck
Unlock for access to all 122 flashcards in this deck.
Unlock Deck
k this deck
36
Construct a 95% confidence interval for Assume the two samples are random and independent. The sample statistics are given below.
Population statistics: Sample statistics:
A)(1.364, 2.636)
B)(1.572, 2.987)
C)(1.723, 3.012)
D)(1.919, 3.142)
Population statistics: Sample statistics:
A)(1.364, 2.636)
B)(1.572, 2.987)
C)(1.723, 3.012)
D)(1.919, 3.142)
Unlock Deck
Unlock for access to all 122 flashcards in this deck.
Unlock Deck
k this deck
37
Test the claim thathat Assume the two samples are random and independent. Use Population statistics: Sample statistics:
Assume the two samples are random and independent. Use Population statistics: Sample statistics: Unlock Deck
Unlock for access to all 122 flashcards in this deck.
Unlock Deck
k this deck
38
At a local college, 65 female students were randomly selected and it was found that their mean monthly income
was $616 with a population standard deviation of $121.50. Seventy-five male students were also randomly
selected and their mean monthly income was found to be $658 with a population standard deviation of $168.70.
Test the claim that male students have a higher monthly income than female students. Use
was $616 with a population standard deviation of $121.50. Seventy-five male students were also randomly
selected and their mean monthly income was found to be $658 with a population standard deviation of $168.70.
Test the claim that male students have a higher monthly income than female students. Use
Unlock Deck
Unlock for access to all 122 flashcards in this deck.
Unlock Deck
k this deck
39
Construct a 95% confidence interval for Assume the two samples are random and independent. The sample statistics are given below.
Population statistics: Sample statistics:
A)(-2.209, 0.209)
B)(-2.001, -1.873)
C)(-1.968, 1.561)
D)(-1.673, 1.892)
Population statistics: Sample statistics:
A)(-2.209, 0.209)
B)(-2.001, -1.873)
C)(-1.968, 1.561)
D)(-1.673, 1.892)
Unlock Deck
Unlock for access to all 122 flashcards in this deck.
Unlock Deck
k this deck
40
A local bank claims that the waiting time for its customers to be served is the lowest in the area. A competitor
bank checks the waiting times at both banks. Test the local bankʹs claim using α = 0.05. Assume the two
samples are random and independent.
bank checks the waiting times at both banks. Test the local bankʹs claim using α
= 0.05. Assume the twosamples are random and independent.
Unlock Deck
Unlock for access to all 122 flashcards in this deck.
Unlock Deck
k this deck
41
Suppose you want to test the claim that Two samples are random, independent, and come from populations that are normally distributed. The sample statistics are given below. Assume that At a
Level of significance of α when should you reject H₀?
A)Reject H₀ if the standardized test statistic is less than -2.064 or greater than 2.064.
B)Reject H₀ if the standardized test statistic is less than -2.492 or greater than 2.492
C)Reject H₀ if the standardized test statistic is less than -1.711 or greater than 1.711.
D)Reject H₀ if the standardized test statistic is less than -1.318 or greater than 1.318.
Unlock Deck
Unlock for access to all 122 flashcards in this deck.
Unlock Deck
k this deck
42
Find the standardized test statistic, t, to test the claim that Two samples are random, independent, and come from populations that are normally distributed. The sample statistics are given below. Assume that
A)4.361
B)3.287
C)2.892
D)1.986
A)4.361
B)3.287
C)2.892
D)1.986
Unlock Deck
Unlock for access to all 122 flashcards in this deck.
Unlock Deck
k this deck
43
A researcher wishes to determine whether people with high blood pressure can lower their blood pressure by
following a certain diet. A treatment group and a control group are selected. Assume the two samples are
random and independent. Construct a 90% confidence interval for the difference between the two population
means, Would you recommend using this diet plan? Explain your reasoning.
following a certain diet. A treatment group and a control group are selected. Assume the two samples are
random and independent. Construct a 90% confidence interval for the difference between the two population
means,
Would you recommend using this diet plan? Explain your reasoning. Unlock Deck
Unlock for access to all 122 flashcards in this deck.
Unlock Deck
k this deck
44
Suppose you want to test the claim that Two samples are random, independent, and come from populations that are normally distributed. The sample statistics are given below. Assume that At a
Level of significance of α = 0.01, when should you reject H₀?
A)Reject H₀ if the standardized test statistic is less than -2.797 or greater than 2.797.
B)Reject H₀ if the standardized test statistic is less than -2.789 or greater than 2.797.
C)Reject H₀ if the standardized test statistic is less than -1.711 or greater than 1.711.
D)Reject H₀ if the standardized test statistic is less than -2.492 or greater than 2.492.
Unlock Deck
Unlock for access to all 122 flashcards in this deck.
Unlock Deck
k this deck
45
Find the standardized test statistic, t, to test the claim that Two samples are random, independent, and come from populations that are normally distributed. The sample statistics are given below. Assume that
A)-2.450
B)-3.165
C)-1.667
D)-0.669
A)-2.450
B)-3.165
C)-1.667
D)-0.669
Unlock Deck
Unlock for access to all 122 flashcards in this deck.
Unlock Deck
k this deck
46
Suppose you want to test the claim that Two samples are random, independent, and come from populations that are normally distributed. The sample statistics are given below. Assume that At a
Level of significance of α when should you reject H₀?
A)Reject H₀ if the standardized test statistic is less than -1.313.
B)Reject H₀ if the standardized test statistic is less than -2.467.
C)Reject H₀ if the standardized test statistic is less than -1.701.
D)Reject H₀ if the standardized test statistic is less than -0.683.
Unlock Deck
Unlock for access to all 122 flashcards in this deck.
Unlock Deck
k this deck
47
Find the critical values, to test the claim that Two samples are random, independent, and come from populations that are normal. The sample statistics are given below. Assume that Use = 0.05.
A)
B)
C)
D)±
A)
B)
C)
D)±
Unlock Deck
Unlock for access to all 122 flashcards in this deck.
Unlock Deck
k this deck
48
Test the claim that Two samples are random, independent, and come from populations that are
normally distributed. The sample statistics are given below. Assume that Use = 0.05.
Two samples are random, independent, and come from populations that arenormally distributed. The sample statistics are given below. Assume that
Use = 0.05. Unlock Deck
Unlock for access to all 122 flashcards in this deck.
Unlock Deck
k this deck
49
Suppose you want to test the claim that TTwo samples are random, independent, and come from populations that are normally distributed. The sample statistics are given below. Assume that At a
Level of significance of α = 0.20, when should you reject H₀?
A)Reject H₀ if the standardized test statistic is less than -1.372 or greater than 1.372.
B)Reject H₀ if the standardized test statistic is less than -0.684 or greater than 0.684.
C)Reject H₀ if the standardized test statistic is less than -2.228 or greater than 2.228.
D)Reject H₀ if the standardized test statistic is less than -3.169 or greater than 3.169.
Unlock Deck
Unlock for access to all 122 flashcards in this deck.
Unlock Deck
k this deck
50
Find the critical valuevalue, to test the claim that Two samples are random, independent, and come from populations that are normal. The sample statistics are given below. Assume that
A)-1.701
B)2.467
C)-1.313
D)0.683
A)-1.701
B)2.467
C)-1.313
D)0.683
Unlock Deck
Unlock for access to all 122 flashcards in this deck.
Unlock Deck
k this deck
51
Test the claim that Two samples are random, independent, and come from populations that are
normally distributed. The sample statistics are given below. Assume that
Two samples are random, independent, and come from populations that arenormally distributed. The sample statistics are given below. Assume that
Unlock Deck
Unlock for access to all 122 flashcards in this deck.
Unlock Deck
k this deck
52
Test the claim that Two samples are random, independent, and come from populations that are
normally distributed. The sample statistics are given below. Assume that . Use = 0.01.
Two samples are random, independent, and come from populations that arenormally distributed. The sample statistics are given below. Assume that
. Use = 0.01. Unlock Deck
Unlock for access to all 122 flashcards in this deck.
Unlock Deck
k this deck
53
For which confidence interval for the difference in the means would you reject the null hypothesis?
A)(-2.001, -1.873)
B)(-1.968, 1.561)
C)(-1.673, 1.892)
D)(-2.209, 0.209)
A)(-2.001, -1.873)
B)(-1.968, 1.561)
C)(-1.673, 1.892)
D)(-2.209, 0.209)
Unlock Deck
Unlock for access to all 122 flashcards in this deck.
Unlock Deck
k this deck
54
Suppose you want to test the claim that Two samples are random, independent, and come from populations that are normally distributed. The sample statistics are given below. Assume that At a
Level of significance of α = 0.01, when should you reject H₀?
A)Reject H₀ if the standardized test statistic is greater than 2.681.
B)Reject H₀ if the standardized test statistic is greater than 1.699.
C)Reject H₀ if the standardized test statistic is greater than 2.179.
D)Reject H₀ if the standardized test statistic is greater than 3.055.
Unlock Deck
Unlock for access to all 122 flashcards in this deck.
Unlock Deck
k this deck
55
Find the standardized test statistic, t, to test the claim that Two samples are random, independent, and come from populations that are normally distributed. The sample statistics are given below. Assume that
A)-0.962
B)-0.813
C)-1.326
D)-1.101
A)-0.962
B)-0.813
C)-1.326
D)-1.101
Unlock Deck
Unlock for access to all 122 flashcards in this deck.
Unlock Deck
k this deck
56
Find the standardized test statistic, t, to test the claim that Two samples are random, independent, and come from populations that are normally distributed. The sample statistics are given below. Assume that
A)1.282
B)3.271
C)2.819
D)1.865
A)1.282
B)3.271
C)2.819
D)1.865
Unlock Deck
Unlock for access to all 122 flashcards in this deck.
Unlock Deck
k this deck
57
Find the critical values, to test the claim that Two samples are random, independent, and come from populations that are normal. The sample statistics are given below. Assume that Use = 0.05.
A)
B)
C)
D)
A)
B)
C)
D)
Unlock Deck
Unlock for access to all 122 flashcards in this deck.
Unlock Deck
k this deck
58
Find the critical value, to test the claim that Two samples are random, independent, and come from populations that are normal. The sample statistics are given below. Assume that
A)
B)
C)
D)
A)
B)
C)
D)
Unlock Deck
Unlock for access to all 122 flashcards in this deck.
Unlock Deck
k this deck
59
Find the critical value, to test the claim that Two samples are random, independent, and come from populations that are normal. The sample statistics are given below. Assume that Use α = 0.01.
A)2.681
B)1.699
C)2.179
D)3.055
A)2.681
B)1.699
C)2.179
D)3.055
Unlock Deck
Unlock for access to all 122 flashcards in this deck.
Unlock Deck
k this deck
60
Find the standardized test statistic, t, to test the claim that Two samples are random, independent, and come from populations that are normally distributed. The sample statistics are given below. Assume that
A)-1.546
B)-1.821
C)-2.123
D)-1.326
A)-1.546
B)-1.821
C)-2.123
D)-1.326
Unlock Deck
Unlock for access to all 122 flashcards in this deck.
Unlock Deck
k this deck
61
Construct a 90% confidence interval for Two samples are random, independent, and come from populations that are normally distributed. The sample statistics are given below. Assume that
A)(0.721, 3.279)
B)(1.335, 3.012)
C)(1.413, 3.124)
D)(1.554, 3.651)
A)(0.721, 3.279)
B)(1.335, 3.012)
C)(1.413, 3.124)
D)(1.554, 3.651)
Unlock Deck
Unlock for access to all 122 flashcards in this deck.
Unlock Deck
k this deck
62
A womenʹs advocacy group claims that women golfers receive significantly less prize money than their male
counterparts when they win first place in a professional tournament. The data listed below are the first place
prize monies from male and female tournament winners. Assume the samples are random, independent, and
come from populations that are normally distributed. At α = 0.01, test the groupʹs claim. Assume the
population variances are not equal.
counterparts when they win first place in a professional tournament. The data listed below are the first place
prize monies from male and female tournament winners. Assume the samples are random, independent, and
come from populations that are normally distributed. At α
= 0.01, test the groupʹs claim. Assume thepopulation variances are not equal.
Unlock Deck
Unlock for access to all 122 flashcards in this deck.
Unlock Deck
k this deck
63
Find Assume the samples are random and dependent, and the populations are normally distributed.
A)-0.94
B)-0.76
C)0.58
D)0.89
A)-0.94
B)-0.76
C)0.58
D)0.89
Unlock Deck
Unlock for access to all 122 flashcards in this deck.
Unlock Deck
k this deck
64
Find Assume the samples are random and dependent, and the populations are normally distributed.
A)9.0
B)-5.1
C)33.1
D)25.2
A)9.0
B)-5.1
C)33.1
D)25.2
Unlock Deck
Unlock for access to all 122 flashcards in this deck.
Unlock Deck
k this deck
65
Construct a 95% confidence interval for Two samples are random, independent, and come from populations that are normally distributed The sample statistics are given below. Assume that
A)(-0.883, 0.083)
B)(-4.152, 3.981)
C)(-2.762, 2.762)
D)(-1.762, 1.762)
A)(-0.883, 0.083)
B)(-4.152, 3.981)
C)(-2.762, 2.762)
D)(-1.762, 1.762)
Unlock Deck
Unlock for access to all 122 flashcards in this deck.
Unlock Deck
k this deck
66
A local bank claims that the waiting time for its customers to be served is the lowest in the area. A competitorʹs
bank checks the waiting times at both banks. Assume the samples are random and independent, and the
populations are normally distributed. Test the local bankʹs claim: (a)assuming that assuming that
bank checks the waiting times at both banks. Assume the samples are random and independent, and the
populations are normally distributed. Test the local bankʹs claim: (a)assuming that
assuming that Unlock Deck
Unlock for access to all 122 flashcards in this deck.
Unlock Deck
k this deck
67
A womenʹs advocacy group claims that women golfers receive significantly less prize money than their male
counterparts when they win first place in a professional tournament. The data listed below are the first place
prize monies from male and female tournament winners. Assume the samples are random, independent, and
come from populations that are normally distributed. Construct a 99% confidence interval for the difference in
the means Assume the population variances are not equal.
counterparts when they win first place in a professional tournament. The data listed below are the first place
prize monies from male and female tournament winners. Assume the samples are random, independent, and
come from populations that are normally distributed. Construct a 99% confidence interval for the difference in
the means
Assume the population variances are not equal. Unlock Deck
Unlock for access to all 122 flashcards in this deck.
Unlock Deck
k this deck
68
Test the claim that Two samples are random, independent, and come from populations that are
normally distributed. The sample statistics are given below. Assume that
Two samples are random, independent, and come from populations that arenormally distributed. The sample statistics are given below. Assume that
Unlock Deck
Unlock for access to all 122 flashcards in this deck.
Unlock Deck
k this deck
69
Find the critical value, to test the claim that = 0. Assume the samples are random and dependent, and the populations are normally distributed. Use = 0.05.
A)
B)2.132
C)
D)3.747
A)
B)2.132
C)
D)3.747
Unlock Deck
Unlock for access to all 122 flashcards in this deck.
Unlock Deck
k this deck
70
Find the critical value, to test the claim that = 0. Assume the samples are random and dependent, and the populations are normally distributed. Use = 0.01.
A)
B)
C)2.132
D)0.741
A)
B)
C)2.132
D)0.741
Unlock Deck
Unlock for access to all 122 flashcards in this deck.
Unlock Deck
k this deck
71
A study was conducted to determine if the salaries of elementary school teachers from two neighboring
districts were equal. A sample of 15 teachers from each district was randomly selected. The mean from the first
district was $28,900 with a standard deviation of $2300. The mean from the second district was $30,300 with a
standard deviation of $2100. Test the claim that the salaries from both districts are equal. Assume the samples
are random and independent, and the populations are normally distributed. Also, assume that Use
districts were equal. A sample of 15 teachers from each district was randomly selected. The mean from the first
district was $28,900 with a standard deviation of $2300. The mean from the second district was $30,300 with a
standard deviation of $2100. Test the claim that the salaries from both districts are equal. Assume the samples
are random and independent, and the populations are normally distributed. Also, assume that
Use Unlock Deck
Unlock for access to all 122 flashcards in this deck.
Unlock Deck
k this deck
72
A study was conducted to determine if the salaries of elementary school teachers from two neighboring districts were equal. A sample of 15 teachers from each district was randomly selected. The mean from the first
District was $28,900 with a standard deviation of $2300. The mean from the second district was $30,300 with a
Standard deviation of $2100. Assume the samples are random, independent, and come from populations that
Are normally distributed. Construct a 95% confidence interval for Assume that
A)(-3047, 247)
B)(-2054, 238)
C)(-2871, 567)
D)(-4081, 597)
Unlock Deck
Unlock for access to all 122 flashcards in this deck.
Unlock Deck
k this deck
73
Test the claim that the paired sample data is from a population with a mean difference of 0. Assume the
samples are random and dependent, and the populations are normally distributed. Use
samples are random and dependent, and the populations are normally distributed. Use
Unlock Deck
Unlock for access to all 122 flashcards in this deck.
Unlock Deck
k this deck
74
Find Assume the samples are random and dependent, and the populations are normally distributed.
A)1.73
B)1.21
C)1.32
D)1.89
A)1.73
B)1.21
C)1.32
D)1.89
Unlock Deck
Unlock for access to all 122 flashcards in this deck.
Unlock Deck
k this deck
75
Find the critical value, to test the claim that = 0. Assume the samples are random and dependent, and the populations are normally distributed. Use = 0.02.
A)
B)
C)2.132
D)0.741
A)
B)
C)2.132
D)0.741
Unlock Deck
Unlock for access to all 122 flashcards in this deck.
Unlock Deck
k this deck
76
A sports analyst claims that the mean batting average for teams in the American League is not equal to the
mean batting average for teams in the National League because a pitcher does not bat in the American League.
The data listed below are random, independent, and come from populations that are normally distributed. At α = 0.05, test the sports analystʹs claim. Assume the population variances are equal.
mean batting average for teams in the National League because a pitcher does not bat in the American League.
The data listed below are random, independent, and come from populations that are normally distributed. At
α = 0.05, test the sports analystʹs claim. Assume the population variances are equal. Unlock Deck
Unlock for access to all 122 flashcards in this deck.
Unlock Deck
k this deck
77
A sports analyst claims that the mean batting average for teams in the American League is not equal to the
mean batting average for teams in the National League because a pitcher does not bat in the American League.
The data listed below are random, independent, and come from populations that are normally distributed.
Construct a 95% confidence interval for the difference in the means Assume the population variances
are equal.
mean batting average for teams in the National League because a pitcher does not bat in the American League.
The data listed below are random, independent, and come from populations that are normally distributed.
Construct a 95% confidence interval for the difference in the means
Assume the population variancesare equal.
Unlock Deck
Unlock for access to all 122 flashcards in this deck.
Unlock Deck
k this deck
78
Find Assume the samples are random and dependent, and the populations are normally distributed.
A)7.8
B)5.6
C)6.8
D)8.9
A)7.8
B)5.6
C)6.8
D)8.9
Unlock Deck
Unlock for access to all 122 flashcards in this deck.
Unlock Deck
k this deck
79
Test the claim that Two samples are random, independent, and come from populations that are
normally distributed. The sample statistics are given below. Assume that
Two samples are random, independent, and come from populations that arenormally distributed. The sample statistics are given below. Assume that
Unlock Deck
Unlock for access to all 122 flashcards in this deck.
Unlock Deck
k this deck
80
Construct a 95% confidence interval for Two samples are random, independent, and come from populations that are normally distributed. The sample statistics are given below. Assume that
A)(-3.406, 0.606)
B)(-1.132, 1.543)
C)(-1.679, 1.987)
D)(2.112, 2.113)
A)(-3.406, 0.606)
B)(-1.132, 1.543)
C)(-1.679, 1.987)
D)(2.112, 2.113)
Unlock Deck
Unlock for access to all 122 flashcards in this deck.
Unlock Deck
k this deck
Unlock Deck
Unlock for access to all 122 flashcards in this deck.


