Deck 18: Extending the Analysis of Aggregate Supply
Full screen (f)
Question
Question
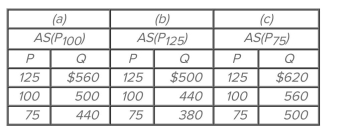 Suppose the full employment level of real output (Q) for a hypothetical economy is $500, the price level (P) initially is 100, and prices and wages are flexible both upward and downward. Refer to the
Accompanying short-run aggregate supply schedules. In the long run, an increase in the price level
From 100 to 125 will
A) increase real output from $500 to $560.
B) decrease real output from $500 to $440.
C) change the aggregate supply schedule from (a) to (c) and result in an equilibrium level of real output of $560.
D) change the aggregate supply schedule from (a) to (b) and result in an equilibrium level of real output of $500.
Question
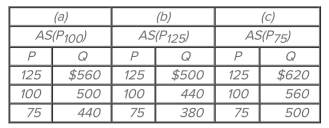 Suppose the full employment level of real output (Q) for a hypothetical economy is $500, the price level (P) initially is 100, and prices and wages are flexible both upward and downward. Refer to the
Accompanying short-run aggregate supply schedules. In the long run, a fall in the price level from
100 to 75 will
A) decrease real output from $500 to $440.
B) increase real output from $500 to $620.
C) change the aggregate supply schedule from (a) to (c) and produce an equilibrium level of real output of $500.
D) change the aggregate supply schedule from (a) to (b) and produce an equilibrium level of real output of $500.
Question
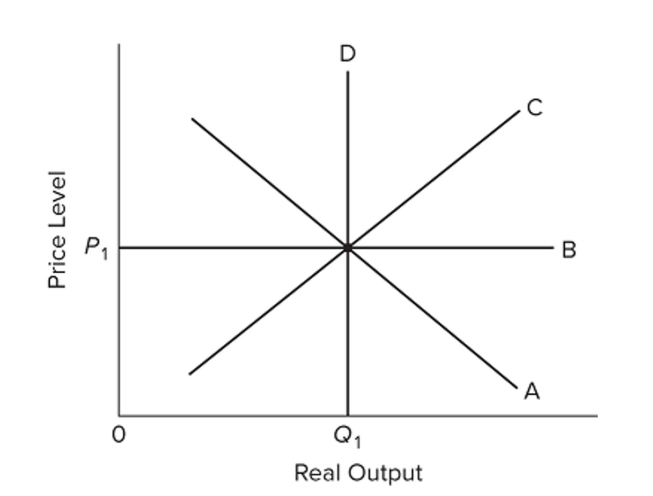
A) increase real output from
B) change aggregate supply from A
C) decrease real output from
D) move the economy from b to d.
Question
A) change aggregate supply from A
B) increase real output from
C) change aggregate supply from A
D) increase real output from
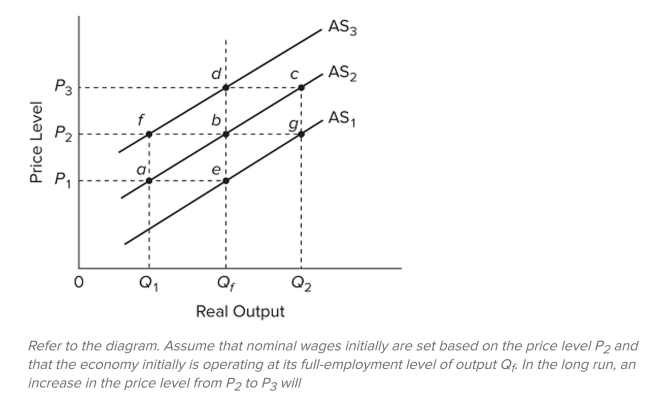
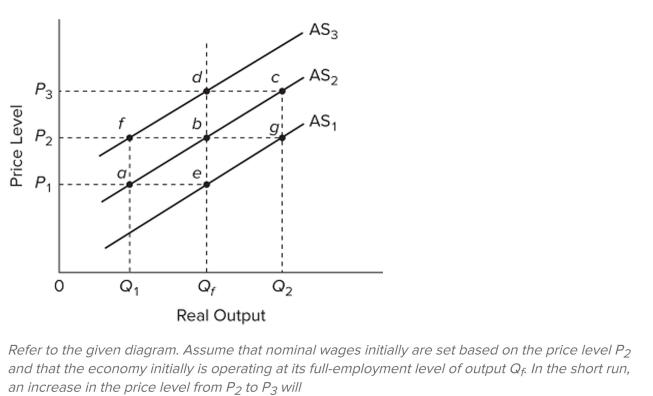
Question
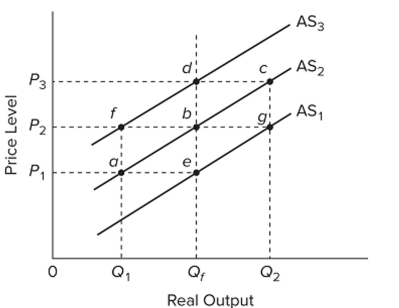
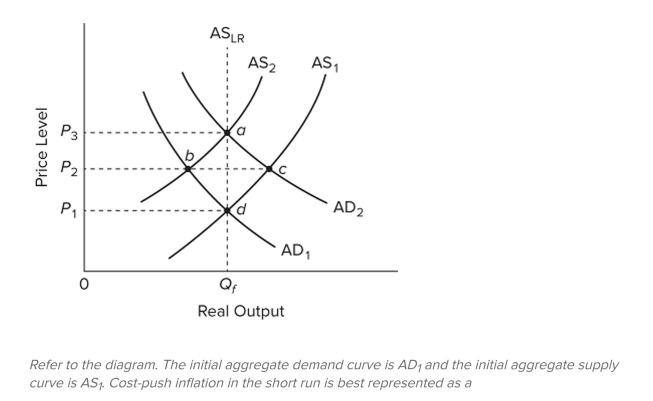
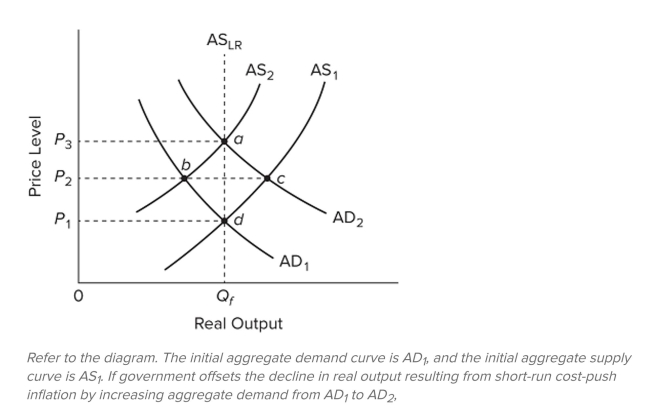
Refer to the diagram. Assume that nominal wages initially are set based on the price level P2 and that the economy initially is operating at its full-employment level of output Qf. In the short run, costpush inflation could best be shown as
A) a leftward shift of aggregate supply from A
B) a move from b to c on A
C) a move from b to c to d.
D) a move from b to f to d.
Question
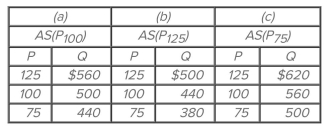 Suppose the full employment level of real output (Q) for a hypothetical economy is $500, the price level (P) initially is 100, and prices and wages are flexible both upward and downward. Refer to the
Accompanying short-run aggregate supply schedules. If the price level unexpectedly declines from
100 to 75, the level of real output in the short run will
A) rise from $500 to $560.
B) fall from $500 to $440.
C) fall from $560 to $500.
D) rise from $440 to $500.
Question
Question
Question
Question
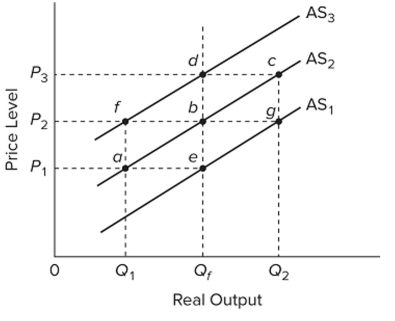
Refer to the diagram. Assume that nominal wages initially are set based on the price level P2 and that the economy initially is operating at its full-employment level of output Qf. In the long run, demand-pull inflation could best be shown as
A) a move from b to c on A
B) a move from b to f to d.
C) a change of aggregate supply from A
D) a move from b to d.
Question
Question
Question
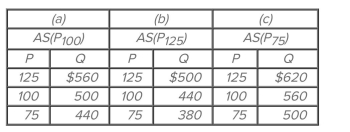 Suppose the full employment level of real output (Q) for a hypothetical economy is $500, the price level (P) initially is 100, and prices and wages are flexible both upward and downward. Refer to the
Accompanying short-run aggregate supply schedules. If the price level unexpectedly increases from
100 to 125, the level of real output in the short run will
A) rise from $500 to $560.
B) fall from $500 to $440.
C) fall from $560 to $500.
D) rise from $440 to $500.
Question
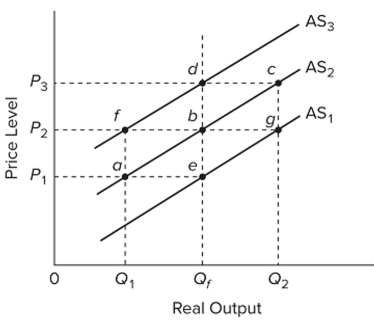
Refer to the diagram. Assume that nominal wages initially are set based on the price level P2 and that the economy initially is operating at its full-employment level of output Qf. In terms of this diagram, the long-run aggregate supply curve
A)
B) is a vertical line extending from upward through e, b, and d.
C) may be either A depending on whether the price level is
D) is a horizontal line extending from rightward through f, b, and g.
Question
Question
Question
Question
Question
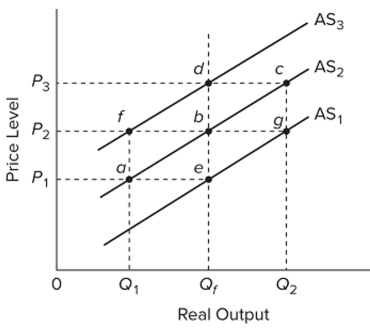
Refer to the diagram. Assume that nominal wages initially are set based on the price level P2 and that the economy initially is operating at its full-employment level of output Qf. In the short run, demand-pull inflation could best be shown as
A) a move from b to c on A
B) a move from b to c to d.
C) a change of aggregate supply from A
D) a move from b to d.
Question
Question
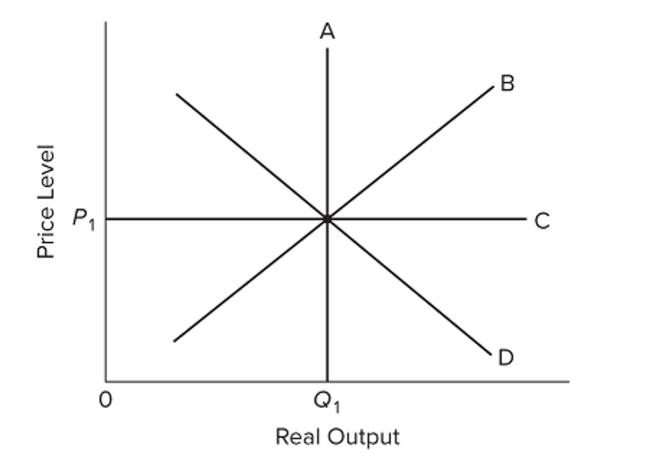
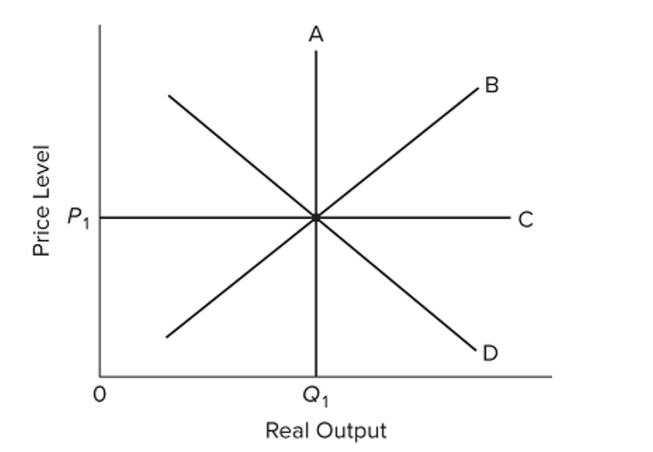 Refer to the diagram relating to short-run and long-run aggregate supply. The
A) short-run aggregate supply curve is A.
B) short-run aggregate supply curve is B.
C) long-run aggregate supply curve is B.
D) long-run aggregate supply curve is D.
Question
Question
A) a shift of aggregate demand from to , followed by a shift of aggregate supply from to .
B) a move from d to b to a.
C) a shift of aggregate supply from to , followed by a shift of aggregate demand from to
D) a move from a to d.
Question
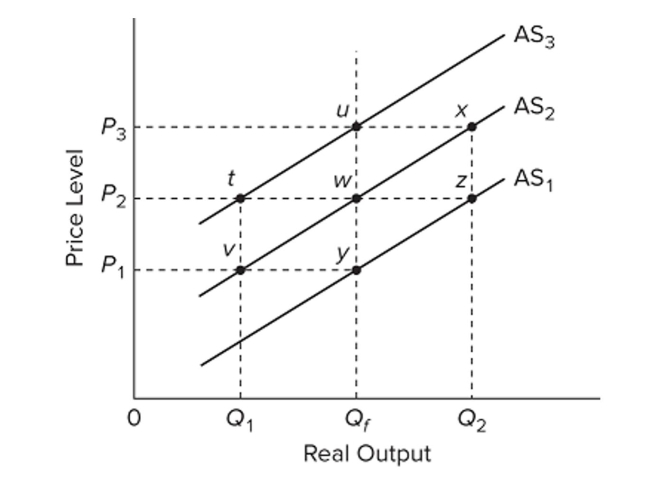 Refer to the diagram. If drawn, the long-run aggregate supply curve would include points
A) v, w, and u.
B) y, w, and u.
C) t, w, and z.
D) y, w, and x.
Question
 Refer to the diagram. If the price level rises above because of an increase in aggregate demand,
The
A) economy will move up along curve B and output will temporarily increase.
B) long-run aggregate supply curve C will shift upward.
C) short-run aggregate supply curve B will automatically shift to the right.
D) economy's output ?rst will decline, then increase, and ?nally return to
Question

A) v.
B) x.
C) t.
D) y.
Question
 Refer to the diagram. The long-run aggregate supply curve is
A) A.
B) B.
C) C.
D) D.
Question
Question
A) leftward shift of the aggregate supply curve from A
B) rightward shift of the aggregate demand curve from AD
C) move from d to b to a.
D) move from d directly to a.
Question
Question
A) nominal wages and other input prices are assumed to be ?xed.
B)
C) price level increases produce perfectly offsetting changes in nominal wages and other input prices.
D) higher-than-expected rates of actual in?ation reduce real output only temporarily.
Question
A) v.
B) x.
C) t.
D) y.
Question
A) a shift of the aggregate demand curve from AD
B) a move from d to b to a.
C) a move directly from d to a.
D) a shift of the aggregate supply curve from A
Question
A) v.
B) x.
C) u.
D) y.
Question
A) real output will rise above
B) the price level will rise from
C) it is possible that aggregate supply will shift rightward from A because nominal wage
Demands will rise.
D) the price level will rise from
Question
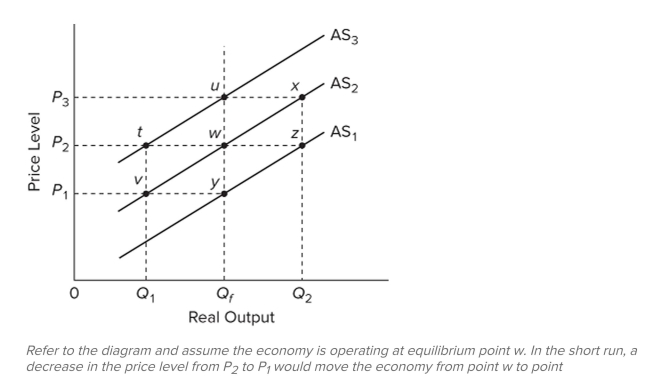
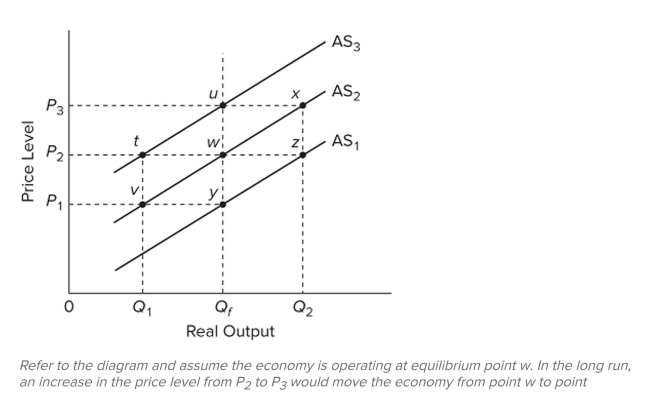
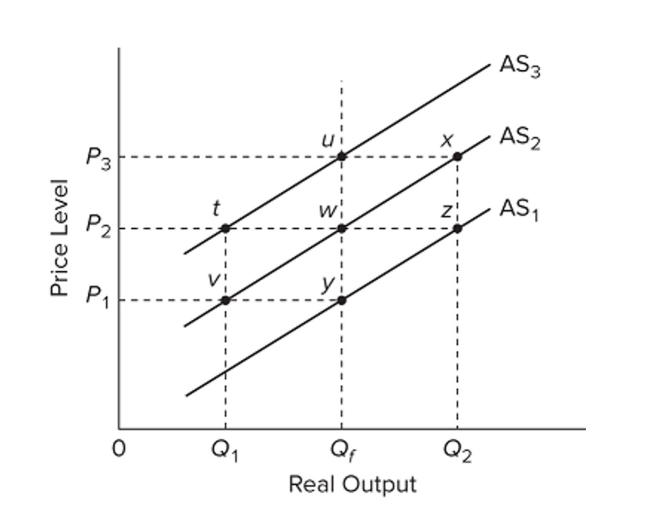 Refer to the diagram and assume the economy is operating at equilibrium point w. In the short run, an increase in the price level from
would move the economy from point w to point
A) v.
B) x.
C) u.
D) z.
Question
Question
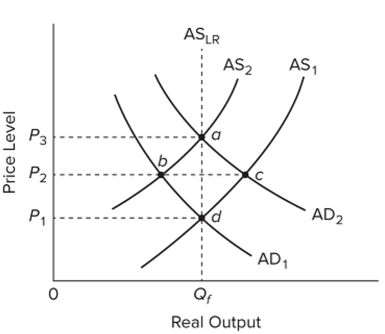
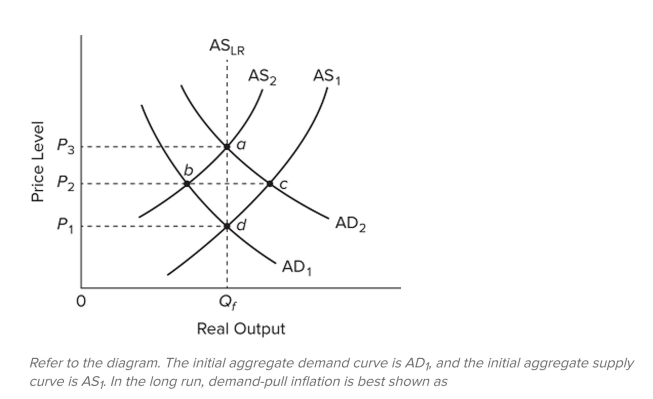
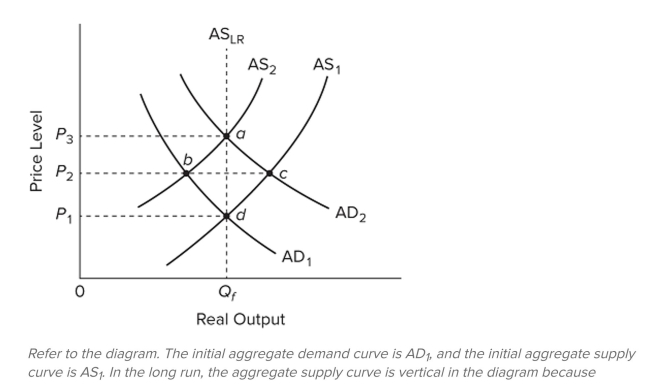
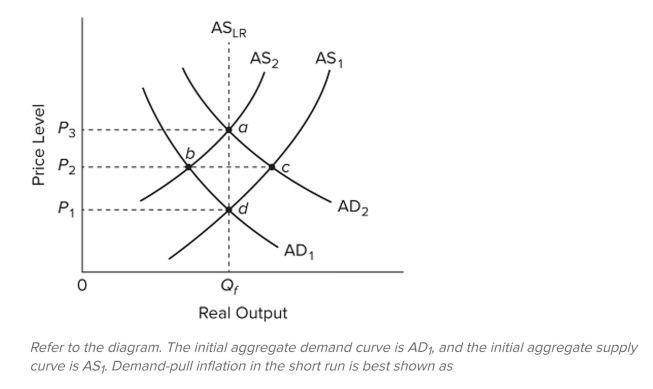
Refer to the diagram. The initial aggregate demand curve is AD1, and the initial aggregate supply curve is AS1. Assuming no change in aggregate demand, the long-run response to a recession caused by cost-push inflation is best depicted as a
A) move from a to d along the long-run aggregate supply curve.
B) rightward shift of the aggregate supply curve from A
C) move from a to c to d.
D) leftward shift of the aggregate supply curve from A
Question
Question
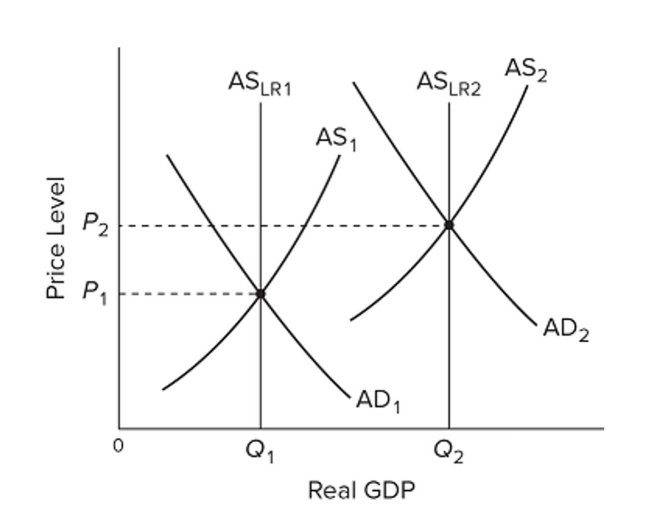 Refer to the graphs, where the subscripts on the labels denote years 1 and 2. In year 1 the economy
A) is in long-run equilibrium at output
B) is in short-run equilibrium at output , but not in long-run equilibrium.
C) cannot be in long-run equilibrium because output changes in period 2.
D) is in a recession, based on output being below output
Question
Question
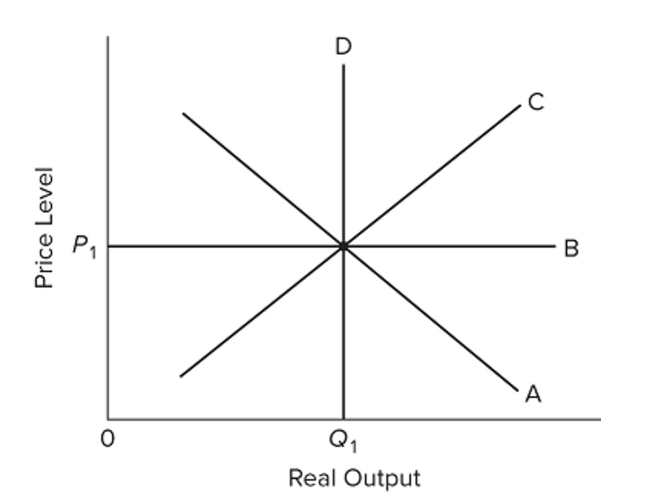 Refer to the diagram and assume that prices and wages are flexible both upward and downward in the economy. In the extended AD-AS model,
A) demand-pull inflation would involve a rightward shift of curve A, followed by a rightward shift of curve C.
B) cost-push inflation would involve a rightward shift of curve A, followed by a leftward shift of curve C.
C) recession would involve a leftward shift of curve A, followed by a rightward shift of curve C.
D) recession would involve a rightward shift of curve D, followed by leftward shifts of curves A and C.
Question
Question
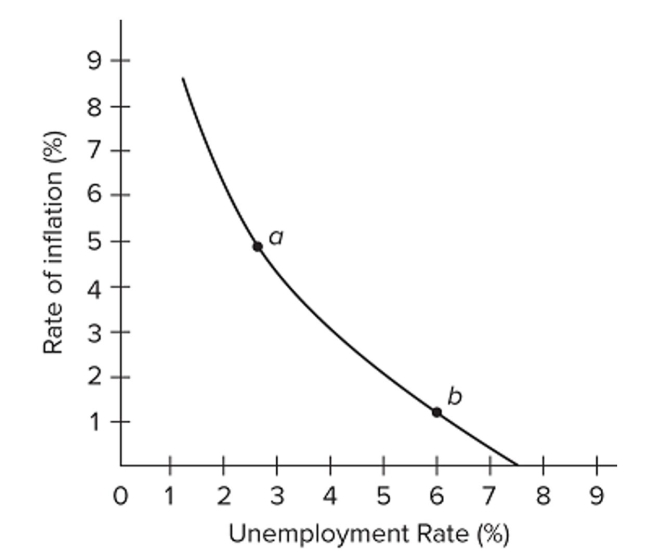 Refer to the diagram for a specific economy. A reduction in structural unemployment or bottleneck problems in labor markets will
A) shift this curve to the right.
B) shift this curve to the left.
C) move this economy southeast along the curve.
D) move this economy northwest along the curve.
Question
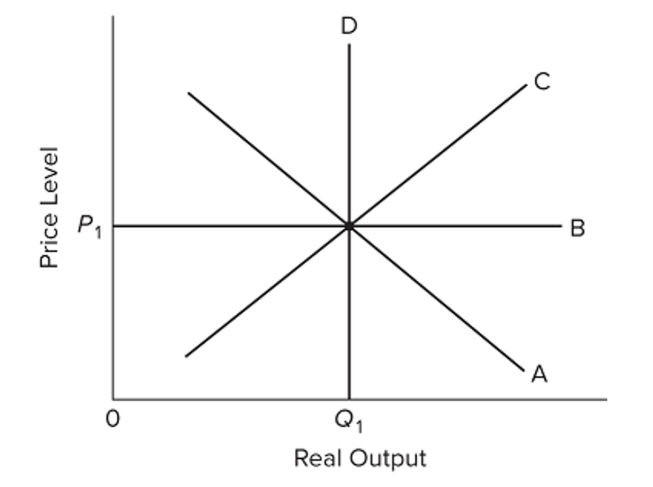 Refer to the diagram and assume that prices and wages are flexible both upward and downward in the economy. In the extended AD-AS model,
A) demand-pull inflation would involve a rightward shift of curve A, followed by a rightward shift of curve C.
B) cost-push inflation would involve first a leftward shift of curve C, then a rightward shift of curve C.
C) recession would involve a leftward shift of curve A, followed by a leftward shift of curve C.
D) recession would involve a rightward shift of curve D, followed by leftward shifts of curves A and C.
Question
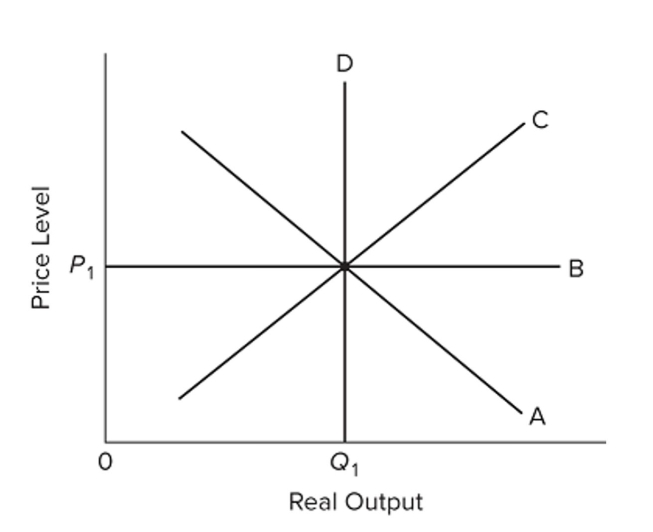 Refer to the diagram. Assume both upward and downward price and wage flexibility in the economy. In the extended AD-AS model,
A) demand-pull inflation would involve a rightward shift of curve A, followed by a rightward shift of curve C.
B) cost-push inflation would involve a leftward shift of curve C, followed by an upward shift of curve B.
C) recession would involve a leftward shift of curve A.
D) a rightward shift of curve D would be equivalent to an outward shift of the nation's production possibilities curve.
Question
Question
Question
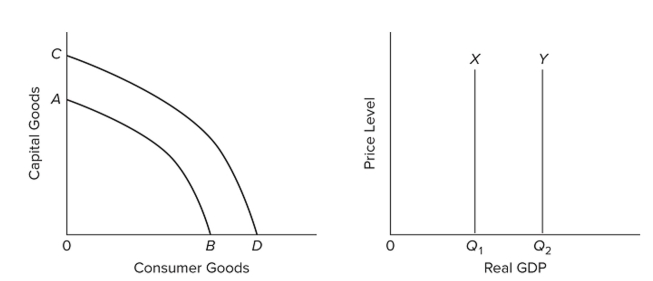 Refer to the graphs. Growth of production capacity is shown by
A) the shift from AB to CD only.
B) the shift from X to Y only.
C) both the shift from AB to CD and the shift from X to Y.
D) both the shift from AB to CD and the shift from Y to X.
Question
 Refer to the graphs. An increase in the economy's human capital would shift curve
A) AB to CD and curve Y to X.
B) CD to AB and curve X to Y.
C) X to Y, while leaving curve AB in place.
D) AB to CD and curve X to Y.
Question
Question
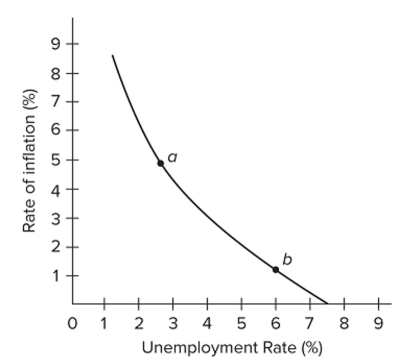 Refer to the diagram for a specific economy. Which of the following best describes the relationship shown by this curve?
A) The demand for labor is large when the rate of inflation is low.
B) When the rate of unemployment is high, the rate of inflation is high.
C) The rate of inflation and the rate of unemployment are inversely related.
D) The rate of inflation and the rate of unemployment are directly related.
Question
 Refer to the diagram for a specific economy. The curve on this graph is known as a
A) Laffer Curve.
B) Phillips Curve.
C) labor demand curve.
D) production possibilities curve.
Question
 Refer to the diagram and assume that prices and wages are flexible both upward and downward in the economy. In the extended AD-AS model,
A) demand-pull inflation would involve a rightward shift of curve A, followed by a leftward shift of curve C.
B) cost-push inflation would involve a rightward shift of curve A, followed by a leftward shift of curve C.
C) recession would involve a leftward shift of curve A, followed by a leftward shift of curve C.
D) recession would involve a rightward shift of curve D, followed by leftward shifts of curves A and C.
Question
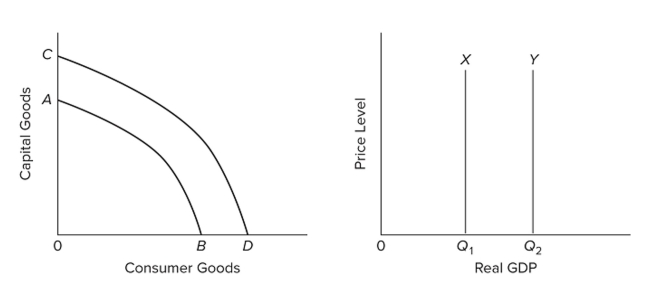 Refer to the graphs. An increase in an economy's labor productivity would shift curve
A) AB to CD and shift curve Y to X.
B) CD to AB and shift curve X to Y.
C) AB to CD and shift curve X to Y.
D) X to Y, while leaving curve AB in place.
Question
 Refer to the graphs, where the subscripts on the labels denote years 1 and 2. From the graphs we can conclude that from year 1 to year 2,
A) the economy recovered from a recession.
B) the economy experienced economic growth and inflation.
C) output grew and the unemployment rate fell.
D) the government engaged in expansionary fiscal and monetary policies.
Question
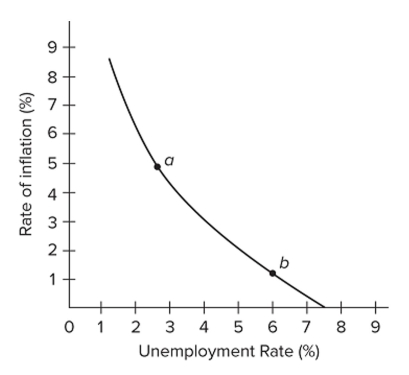 Refer to the diagram for a specific economy. An increase in aggregate demand will
A) shift this curve to the right.
B) shift this curve to the left.
C) move this economy down and to the right along the curve.
D) move this economy up and to the left along the curve.
Question
 Refer to the diagram and assume that prices and wages are flexible both upward and downward in the economy. In the extended AD-AS model,
A) demand-pull inflation would involve a rightward shift of curve A, followed by a rightward shift of curve C.
B) cost-push inflation would involve a rightward shift of curve A, followed by a leftward shift of curve C.
C) recession would involve a leftward shift of curve A, followed by leftward shifts of curves C and D.
D) recession could be caused by either a leftward shift of curve A or a leftward shift of curve C.
Question
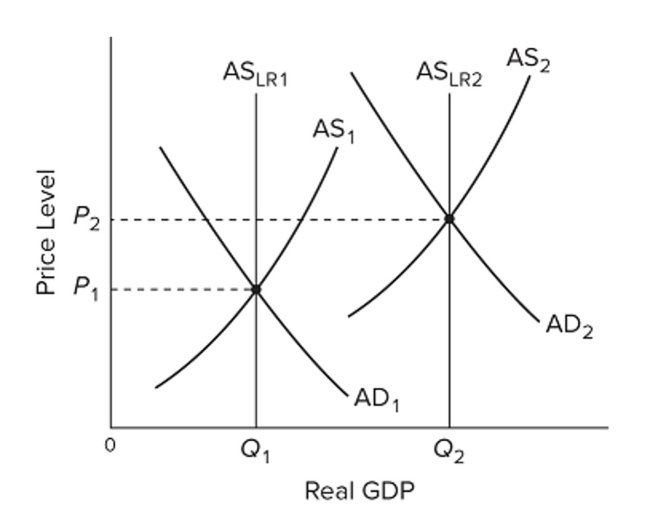 Refer to the graphs, where the subscripts on the labels denote years 1 and 2. From the graphs we can clearly conclude that the economy
A) is not at full employment in either year.
B) is at full employment in year 1 but not in year 2.
C) is at full employment in year 2 but not in year 1.
D) is at full employment in both years.
Question
Question
Question
Question
Question
Question
Question
Question
Question
Question
Question
Question
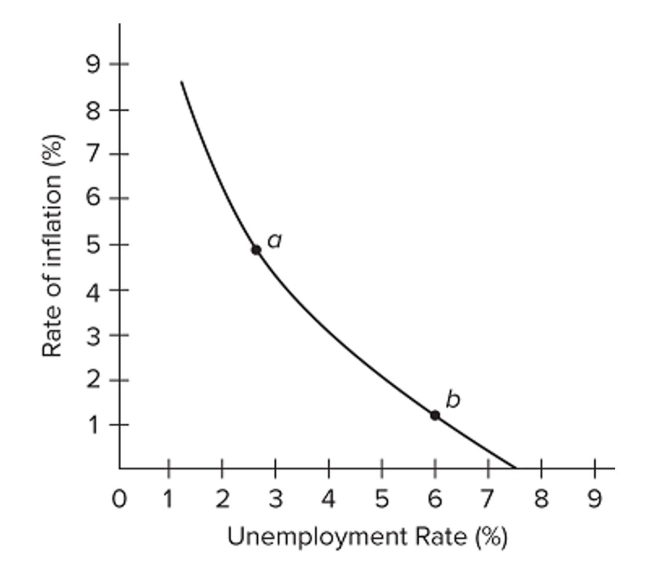 Refer to the diagram for a specific economy. Which of the following best describes a decision by policymakers that moves this economy from point b to point a?
A) Policymakers have instituted an expansionary monetary policy and/or a budgetary deficit, thereby accepting more unemployment to reduce the rate of inflation.
B) Policymakers have instituted a restrictive monetary policy and/or a budgetary surplus, thereby accepting a higher rate of inflation to reduce unemployment.
C) Policymakers have instituted an expansionary monetary policy and/or a budgetary deficit, thereby accepting a higher rate of inflation to reduce unemployment.
D) Policymakers have instituted a restrictive monetary policy and/or a budgetary surplus, thereby accepting more unemployment to reduce the rate of inflation.
Question
Question
Question
Question
Question
 Refer to the diagram for a specific economy. The shape of this curve suggests that
A) the price level rises at a diminishing rate as the level of aggregate demand increases.
B) full employment and price stability are compatible goals only when aggregate demand is falling.
C) each successive unit of decline in the unemployment rate is accompanied by a smaller increase in the rate of inflation.
D) each successive unit of decline in the unemployment rate is accompanied by a larger increase in the rate of inflation.
Question
Question
Question

Unlock Deck
Sign up to unlock the cards in this deck!
Unlock Deck
Unlock Deck
1/268
Play
Full screen (f)
Deck 18: Extending the Analysis of Aggregate Supply
1
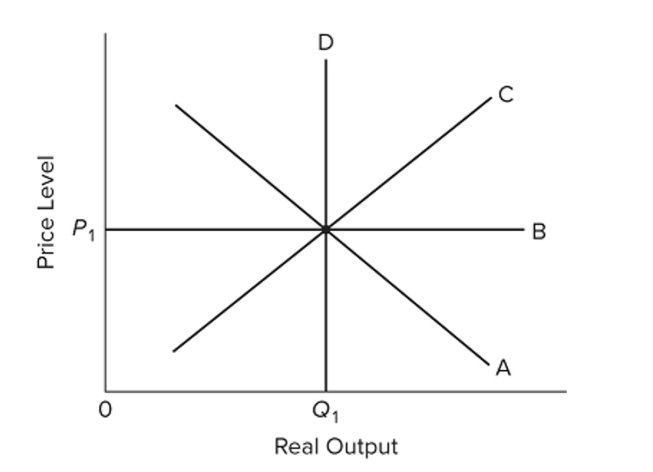
Which of the following statements is true?
A) The short-run aggregate supply curve is downsloping.
B) The short-run aggregate supply curve is vertical.
C) The long-run aggregate supply curve is vertical.
D) The long-run aggregate supply curve is upsloping.
A) The short-run aggregate supply curve is downsloping.
B) The short-run aggregate supply curve is vertical.
C) The long-run aggregate supply curve is vertical.
D) The long-run aggregate supply curve is upsloping.
The long-run aggregate supply curve is vertical.
2
Suppose the full employment level of real output (Q) for a hypothetical economy is $500, the price level (P) initially is 100, and prices and wages are flexible both upward and downward. Refer to theAccompanying short-run aggregate supply schedules. In the long run, an increase in the price level
From 100 to 125 will
A) increase real output from $500 to $560.
B) decrease real output from $500 to $440.
C) change the aggregate supply schedule from (a) to (c) and result in an equilibrium level of real output of $560.
D) change the aggregate supply schedule from (a) to (b) and result in an equilibrium level of real output of $500.
change the aggregate supply schedule from (a) to (b) and result in an equilibrium level of real output of $500.
3
Suppose the full employment level of real output (Q) for a hypothetical economy is $500, the price level (P) initially is 100, and prices and wages are flexible both upward and downward. Refer to theAccompanying short-run aggregate supply schedules. In the long run, a fall in the price level from
100 to 75 will
A) decrease real output from $500 to $440.
B) increase real output from $500 to $620.
C) change the aggregate supply schedule from (a) to (c) and produce an equilibrium level of real output of $500.
D) change the aggregate supply schedule from (a) to (b) and produce an equilibrium level of real output of $500.
change the aggregate supply schedule from (a) to (c) and produce an equilibrium level of real output of $500.
4
A) increase real output from
B) change aggregate supply from A
C) decrease real output from
D) move the economy from b to d.
Unlock Deck
Unlock for access to all 268 flashcards in this deck.
Unlock Deck
k this deck
5
A) change aggregate supply from A
B) increase real output from
C) change aggregate supply from A
D) increase real output from
Unlock Deck
Unlock for access to all 268 flashcards in this deck.
Unlock Deck
k this deck
6
Refer to the diagram. Assume that nominal wages initially are set based on the price level P2 and that the economy initially is operating at its full-employment level of output Qf. In the short run, costpush inflation could best be shown as
A) a leftward shift of aggregate supply from A
B) a move from b to c on A
C) a move from b to c to d.
D) a move from b to f to d.
Unlock Deck
Unlock for access to all 268 flashcards in this deck.
Unlock Deck
k this deck
7
Suppose the full employment level of real output (Q) for a hypothetical economy is $500, the price level (P) initially is 100, and prices and wages are flexible both upward and downward. Refer to theAccompanying short-run aggregate supply schedules. If the price level unexpectedly declines from
100 to 75, the level of real output in the short run will
A) rise from $500 to $560.
B) fall from $500 to $440.
C) fall from $560 to $500.
D) rise from $440 to $500.
Unlock Deck
Unlock for access to all 268 flashcards in this deck.
Unlock Deck
k this deck
8
Other things equal, the short-run aggregate supply curve shifts positions when
A) the price level changes.
B) the rate of inflation changes.
C) nominal wages and other input prices change.
D) aggregate demand changes.
A) the price level changes.
B) the rate of inflation changes.
C) nominal wages and other input prices change.
D) aggregate demand changes.
Unlock Deck
Unlock for access to all 268 flashcards in this deck.
Unlock Deck
k this deck
9
Other things equal, a decrease in the price level will
A) shift the aggregate supply curve to the left.
B) shift the aggregate demand curve to the left.
C) cause a movement up a short-run aggregate supply curve.
D) cause a movement down an aggregate supply curve.
A) shift the aggregate supply curve to the left.
B) shift the aggregate demand curve to the left.
C) cause a movement up a short-run aggregate supply curve.
D) cause a movement down an aggregate supply curve.
Unlock Deck
Unlock for access to all 268 flashcards in this deck.
Unlock Deck
k this deck
10
In terms of aggregate supply, the short run is a period in which
A) the price level is constant.
B) employment is constant.
C) real output is constant.
D) nominal wages and other resource prices are unresponsive to price-level changes.
A) the price level is constant.
B) employment is constant.
C) real output is constant.
D) nominal wages and other resource prices are unresponsive to price-level changes.
Unlock Deck
Unlock for access to all 268 flashcards in this deck.
Unlock Deck
k this deck
11
Refer to the diagram. Assume that nominal wages initially are set based on the price level P2 and that the economy initially is operating at its full-employment level of output Qf. In the long run, demand-pull inflation could best be shown as
A) a move from b to c on A
B) a move from b to f to d.
C) a change of aggregate supply from A
D) a move from b to d.
Unlock Deck
Unlock for access to all 268 flashcards in this deck.
Unlock Deck
k this deck
12
In terms of aggregate supply, a period in which nominal wages and other resource prices are unresponsive to price-level changes is called the
A) long run.
B) short run.
C) immediate market period.
D) very long run.
A) long run.
B) short run.
C) immediate market period.
D) very long run.
Unlock Deck
Unlock for access to all 268 flashcards in this deck.
Unlock Deck
k this deck
13
In terms of aggregate supply, a period in which nominal wages and other resource prices are fully responsive to price-level changes is called the
A) long run.
B) short run.
C) immediate market period.
D) very long run.
A) long run.
B) short run.
C) immediate market period.
D) very long run.
Unlock Deck
Unlock for access to all 268 flashcards in this deck.
Unlock Deck
k this deck
14
Suppose the full employment level of real output (Q) for a hypothetical economy is $500, the price level (P) initially is 100, and prices and wages are flexible both upward and downward. Refer to theAccompanying short-run aggregate supply schedules. If the price level unexpectedly increases from
100 to 125, the level of real output in the short run will
A) rise from $500 to $560.
B) fall from $500 to $440.
C) fall from $560 to $500.
D) rise from $440 to $500.
Unlock Deck
Unlock for access to all 268 flashcards in this deck.
Unlock Deck
k this deck
15
Refer to the diagram. Assume that nominal wages initially are set based on the price level P2 and that the economy initially is operating at its full-employment level of output Qf. In terms of this diagram, the long-run aggregate supply curve
A)
B) is a vertical line extending from upward through e, b, and d.
C) may be either A depending on whether the price level is
D) is a horizontal line extending from rightward through f, b, and g.
Unlock Deck
Unlock for access to all 268 flashcards in this deck.
Unlock Deck
k this deck
16
In terms of aggregate supply, the difference between the long run and the short run is that in the long run,
A) the price level is variable.
B) employment is variable.
C) real output is variable.
D) nominal wages and other input prices are fully responsive to price-level changes.
A) the price level is variable.
B) employment is variable.
C) real output is variable.
D) nominal wages and other input prices are fully responsive to price-level changes.
Unlock Deck
Unlock for access to all 268 flashcards in this deck.
Unlock Deck
k this deck
17
In the extended analysis of aggregate supply, the short-run aggregate supply curve is
A) vertical and the long-run aggregate supply curve is horizontal.
B) horizontal and the long-run aggregate supply curve is vertical.
C) upsloping and the long-run aggregate supply curve is vertical.
D) horizontal and the long-run aggregate supply curve is upsloping.
A) vertical and the long-run aggregate supply curve is horizontal.
B) horizontal and the long-run aggregate supply curve is vertical.
C) upsloping and the long-run aggregate supply curve is vertical.
D) horizontal and the long-run aggregate supply curve is upsloping.
Unlock Deck
Unlock for access to all 268 flashcards in this deck.
Unlock Deck
k this deck
18
The long-run aggregate supply curve is vertical
A) because the rate of inflation is steady in the long run.
B) because resource prices eventually rise and fall with product prices.
C) because product prices tend to increase at a faster rate than resource prices.
D) only when the money supply increases at the same rate as real GDP.
A) because the rate of inflation is steady in the long run.
B) because resource prices eventually rise and fall with product prices.
C) because product prices tend to increase at a faster rate than resource prices.
D) only when the money supply increases at the same rate as real GDP.
Unlock Deck
Unlock for access to all 268 flashcards in this deck.
Unlock Deck
k this deck
19
The short-run aggregate supply curve is upsloping because higher price levels
A) lower interest rates and encourage firms to invest and produce more.
B) create incentives to expand output when resource prices are unresponsive to price-level changes.
C) encourage importation of foreign goods.
D) create an expectation among producers of still higher price levels.
A) lower interest rates and encourage firms to invest and produce more.
B) create incentives to expand output when resource prices are unresponsive to price-level changes.
C) encourage importation of foreign goods.
D) create an expectation among producers of still higher price levels.
Unlock Deck
Unlock for access to all 268 flashcards in this deck.
Unlock Deck
k this deck
20
Refer to the diagram. Assume that nominal wages initially are set based on the price level P2 and that the economy initially is operating at its full-employment level of output Qf. In the short run, demand-pull inflation could best be shown as
A) a move from b to c on A
B) a move from b to c to d.
C) a change of aggregate supply from A
D) a move from b to d.
Unlock Deck
Unlock for access to all 268 flashcards in this deck.
Unlock Deck
k this deck
21
The level of potential output and location of the long-run aggregate supply curve are determined by
A) Federal Reserve policy.
B) the price level.
C) the intersection of aggregate demand and short-run aggregate supply.
D) the natural rate of unemployment.
A) Federal Reserve policy.
B) the price level.
C) the intersection of aggregate demand and short-run aggregate supply.
D) the natural rate of unemployment.
Unlock Deck
Unlock for access to all 268 flashcards in this deck.
Unlock Deck
k this deck
22
Refer to the diagram relating to short-run and long-run aggregate supply. TheA) short-run aggregate supply curve is A.
B) short-run aggregate supply curve is B.
C) long-run aggregate supply curve is B.
D) long-run aggregate supply curve is D.
Unlock Deck
Unlock for access to all 268 flashcards in this deck.
Unlock Deck
k this deck
23
If government uses fiscal policy to restrain cost-push inflation, we can expect
A) the inflation rate to rise.
B) the unemployment rate to fall.
C) the aggregate demand curve to shift rightward.
D) tax-rate declines and increases in government spending.
A) the inflation rate to rise.
B) the unemployment rate to fall.
C) the aggregate demand curve to shift rightward.
D) tax-rate declines and increases in government spending.
Unlock Deck
Unlock for access to all 268 flashcards in this deck.
Unlock Deck
k this deck
24
A) a shift of aggregate demand from to , followed by a shift of aggregate supply from to .
B) a move from d to b to a.
C) a shift of aggregate supply from to , followed by a shift of aggregate demand from to
D) a move from a to d.
Unlock Deck
Unlock for access to all 268 flashcards in this deck.
Unlock Deck
k this deck
25
Refer to the diagram. If drawn, the long-run aggregate supply curve would include pointsA) v, w, and u.
B) y, w, and u.
C) t, w, and z.
D) y, w, and x.
Unlock Deck
Unlock for access to all 268 flashcards in this deck.
Unlock Deck
k this deck
26
Refer to the diagram. If the price level rises above because of an increase in aggregate demand,The
A) economy will move up along curve B and output will temporarily increase.
B) long-run aggregate supply curve C will shift upward.
C) short-run aggregate supply curve B will automatically shift to the right.
D) economy's output ?rst will decline, then increase, and ?nally return to
Unlock Deck
Unlock for access to all 268 flashcards in this deck.
Unlock Deck
k this deck
27
A) v.
B) x.
C) t.
D) y.
Unlock Deck
Unlock for access to all 268 flashcards in this deck.
Unlock Deck
k this deck
28
Refer to the diagram. The long-run aggregate supply curve isA) A.
B) B.
C) C.
D) D.
Unlock Deck
Unlock for access to all 268 flashcards in this deck.
Unlock Deck
k this deck
29
The natural rate of unemployment
A) can vary over time and defines the location of the long-run aggregate supply curve.
B) is constant over time and defines the location of the long-run aggregate supply curve.
C) varies over time in response to changes in aggregate demand.
D) is inversely related to the price level.
A) can vary over time and defines the location of the long-run aggregate supply curve.
B) is constant over time and defines the location of the long-run aggregate supply curve.
C) varies over time in response to changes in aggregate demand.
D) is inversely related to the price level.
Unlock Deck
Unlock for access to all 268 flashcards in this deck.
Unlock Deck
k this deck
30
A) leftward shift of the aggregate supply curve from A
B) rightward shift of the aggregate demand curve from AD
C) move from d to b to a.
D) move from d directly to a.
Unlock Deck
Unlock for access to all 268 flashcards in this deck.
Unlock Deck
k this deck
31
In the extended aggregate demand-aggregate supply model,
A) long-run equilibrium occurs wherever the aggregate demand curve intersects the short-run aggregate supply curve.
B) the long-run aggregate supply curve is horizontal.
C) the price level is the same regardless of the location of the aggregate demand curve.
D) long-run equilibrium occurs at the intersection of the aggregate demand curve, the short- run aggregate supply curve, and the long-run aggregate supply curve.
Unlock Deck
Unlock for access to all 268 flashcards in this deck.
Unlock Deck
k this deck
32
A) nominal wages and other input prices are assumed to be ?xed.
B)
C) price level increases produce perfectly offsetting changes in nominal wages and other input prices.
D) higher-than-expected rates of actual in?ation reduce real output only temporarily.
Unlock Deck
Unlock for access to all 268 flashcards in this deck.
Unlock Deck
k this deck
33
A) v.
B) x.
C) t.
D) y.
Unlock Deck
Unlock for access to all 268 flashcards in this deck.
Unlock Deck
k this deck
34
A) a shift of the aggregate demand curve from AD
B) a move from d to b to a.
C) a move directly from d to a.
D) a shift of the aggregate supply curve from A
Unlock Deck
Unlock for access to all 268 flashcards in this deck.
Unlock Deck
k this deck
35
A) v.
B) x.
C) u.
D) y.
Unlock Deck
Unlock for access to all 268 flashcards in this deck.
Unlock Deck
k this deck
36
A) real output will rise above
B) the price level will rise from
C) it is possible that aggregate supply will shift rightward from A because nominal wage
Demands will rise.
D) the price level will rise from
Unlock Deck
Unlock for access to all 268 flashcards in this deck.
Unlock Deck
k this deck
37
Refer to the diagram and assume the economy is operating at equilibrium point w. In the short run, an increase in the price level fromwould move the economy from point w to point
A) v.
B) x.
C) u.
D) z.
Unlock Deck
Unlock for access to all 268 flashcards in this deck.
Unlock Deck
k this deck
38
In the extended aggregate demand-aggregate supply model,
A) long-run equilibrium occurs wherever the aggregate demand curve intersects the short-run aggregate supply curve.
B) the long-run aggregate supply curve is horizontal.
C) the level of real output is the same in the long run regardless of the location of the aggregate demand curve.
D) the short-run aggregate supply curve is downsloping.
Unlock Deck
Unlock for access to all 268 flashcards in this deck.
Unlock Deck
k this deck
39
Refer to the diagram. The initial aggregate demand curve is AD1, and the initial aggregate supply curve is AS1. Assuming no change in aggregate demand, the long-run response to a recession caused by cost-push inflation is best depicted as a
A) move from a to d along the long-run aggregate supply curve.
B) rightward shift of the aggregate supply curve from A
C) move from a to c to d.
D) leftward shift of the aggregate supply curve from A
Unlock Deck
Unlock for access to all 268 flashcards in this deck.
Unlock Deck
k this deck
40
If government uses its stabilization policies to maintain full employment under conditions of cost- push inflation,
A) a deflationary spiral is likely to occur.
B) an inflationary spiral is likely to occur.
C) stagflation is likely to occur.
D) the Phillips Curve is likely to shift inward.
A) a deflationary spiral is likely to occur.
B) an inflationary spiral is likely to occur.
C) stagflation is likely to occur.
D) the Phillips Curve is likely to shift inward.
Unlock Deck
Unlock for access to all 268 flashcards in this deck.
Unlock Deck
k this deck
41
Refer to the graphs, where the subscripts on the labels denote years 1 and 2. In year 1 the economyA) is in long-run equilibrium at output
B) is in short-run equilibrium at output , but not in long-run equilibrium.
C) cannot be in long-run equilibrium because output changes in period 2.
D) is in a recession, based on output being below output
Unlock Deck
Unlock for access to all 268 flashcards in this deck.
Unlock Deck
k this deck
42
In the absence of unexpected shocks, the economy will tend to experience
A) positive, noninflationary growth.
B) no changes in output or prices.
C) positive growth with mild amounts of deflation.
D) positive growth with mild amounts of inflation.
A) positive, noninflationary growth.
B) no changes in output or prices.
C) positive growth with mild amounts of deflation.
D) positive growth with mild amounts of inflation.
Unlock Deck
Unlock for access to all 268 flashcards in this deck.
Unlock Deck
k this deck
43
Refer to the diagram and assume that prices and wages are flexible both upward and downward in the economy. In the extended AD-AS model,A) demand-pull inflation would involve a rightward shift of curve A, followed by a rightward shift of curve C.
B) cost-push inflation would involve a rightward shift of curve A, followed by a leftward shift of curve C.
C) recession would involve a leftward shift of curve A, followed by a rightward shift of curve C.
D) recession would involve a rightward shift of curve D, followed by leftward shifts of curves A and C.
Unlock Deck
Unlock for access to all 268 flashcards in this deck.
Unlock Deck
k this deck
44
The basic problem portrayed by the traditional Phillips Curve is
A) that a level of aggregate demand sufficiently high to result in full employment may also cause inflation.
B) that changes in the composition of total labor demand tend to be deflationary.
C) that unemployment rises at the same time the general price level is rising.
D) the possibility that automation will increase the level of noncyclical unemployment.
Unlock Deck
Unlock for access to all 268 flashcards in this deck.
Unlock Deck
k this deck
45
Refer to the diagram for a specific economy. A reduction in structural unemployment or bottleneck problems in labor markets willA) shift this curve to the right.
B) shift this curve to the left.
C) move this economy southeast along the curve.
D) move this economy northwest along the curve.
Unlock Deck
Unlock for access to all 268 flashcards in this deck.
Unlock Deck
k this deck
46
Refer to the diagram and assume that prices and wages are flexible both upward and downward in the economy. In the extended AD-AS model,A) demand-pull inflation would involve a rightward shift of curve A, followed by a rightward shift of curve C.
B) cost-push inflation would involve first a leftward shift of curve C, then a rightward shift of curve C.
C) recession would involve a leftward shift of curve A, followed by a leftward shift of curve C.
D) recession would involve a rightward shift of curve D, followed by leftward shifts of curves A and C.
Unlock Deck
Unlock for access to all 268 flashcards in this deck.
Unlock Deck
k this deck
47
Refer to the diagram. Assume both upward and downward price and wage flexibility in the economy. In the extended AD-AS model,A) demand-pull inflation would involve a rightward shift of curve A, followed by a rightward shift of curve C.
B) cost-push inflation would involve a leftward shift of curve C, followed by an upward shift of curve B.
C) recession would involve a leftward shift of curve A.
D) a rightward shift of curve D would be equivalent to an outward shift of the nation's production possibilities curve.
Unlock Deck
Unlock for access to all 268 flashcards in this deck.
Unlock Deck
k this deck
48
Inflation in the U.S. economy tends to be
A) a finite, one-time event resulting from a shock.
B) ongoing, as increases in aggregate demand generally exceed the increases in aggregate supply.
C) a finite, one-time event, as the Fed actively works to eliminate all inflation.
D) ongoing, as aggregate supply is continually shifting to the left.
Unlock Deck
Unlock for access to all 268 flashcards in this deck.
Unlock Deck
k this deck
49
The traditional Phillips Curve suggests a trade-off between
A) price stability and income equality.
B) the level of unemployment and inflation.
C) unemployment and income equality.
D) economic growth and full employment.
A) price stability and income equality.
B) the level of unemployment and inflation.
C) unemployment and income equality.
D) economic growth and full employment.
Unlock Deck
Unlock for access to all 268 flashcards in this deck.
Unlock Deck
k this deck
50
Refer to the graphs. Growth of production capacity is shown byA) the shift from AB to CD only.
B) the shift from X to Y only.
C) both the shift from AB to CD and the shift from X to Y.
D) both the shift from AB to CD and the shift from Y to X.
Unlock Deck
Unlock for access to all 268 flashcards in this deck.
Unlock Deck
k this deck
51
Refer to the graphs. An increase in the economy's human capital would shift curveA) AB to CD and curve Y to X.
B) CD to AB and curve X to Y.
C) X to Y, while leaving curve AB in place.
D) AB to CD and curve X to Y.
Unlock Deck
Unlock for access to all 268 flashcards in this deck.
Unlock Deck
k this deck
52
The traditional Phillips Curve suggests that, if government uses an expansionary fiscal policy to stimulate output and employment,
A) unemployment may actually increase because of the crowding-out effect.
B) tax revenues may increase even though tax rates have been reduced.
C) the inflation rate will increase.
D) the natural rate of unemployment may fall.
A) unemployment may actually increase because of the crowding-out effect.
B) tax revenues may increase even though tax rates have been reduced.
C) the inflation rate will increase.
D) the natural rate of unemployment may fall.
Unlock Deck
Unlock for access to all 268 flashcards in this deck.
Unlock Deck
k this deck
53
Refer to the diagram for a specific economy. Which of the following best describes the relationship shown by this curve?A) The demand for labor is large when the rate of inflation is low.
B) When the rate of unemployment is high, the rate of inflation is high.
C) The rate of inflation and the rate of unemployment are inversely related.
D) The rate of inflation and the rate of unemployment are directly related.
Unlock Deck
Unlock for access to all 268 flashcards in this deck.
Unlock Deck
k this deck
54
Refer to the diagram for a specific economy. The curve on this graph is known as aA) Laffer Curve.
B) Phillips Curve.
C) labor demand curve.
D) production possibilities curve.
Unlock Deck
Unlock for access to all 268 flashcards in this deck.
Unlock Deck
k this deck
55
Refer to the diagram and assume that prices and wages are flexible both upward and downward in the economy. In the extended AD-AS model,A) demand-pull inflation would involve a rightward shift of curve A, followed by a leftward shift of curve C.
B) cost-push inflation would involve a rightward shift of curve A, followed by a leftward shift of curve C.
C) recession would involve a leftward shift of curve A, followed by a leftward shift of curve C.
D) recession would involve a rightward shift of curve D, followed by leftward shifts of curves A and C.
Unlock Deck
Unlock for access to all 268 flashcards in this deck.
Unlock Deck
k this deck
56
Refer to the graphs. An increase in an economy's labor productivity would shift curveA) AB to CD and shift curve Y to X.
B) CD to AB and shift curve X to Y.
C) AB to CD and shift curve X to Y.
D) X to Y, while leaving curve AB in place.
Unlock Deck
Unlock for access to all 268 flashcards in this deck.
Unlock Deck
k this deck
57
Refer to the graphs, where the subscripts on the labels denote years 1 and 2. From the graphs we can conclude that from year 1 to year 2,A) the economy recovered from a recession.
B) the economy experienced economic growth and inflation.
C) output grew and the unemployment rate fell.
D) the government engaged in expansionary fiscal and monetary policies.
Unlock Deck
Unlock for access to all 268 flashcards in this deck.
Unlock Deck
k this deck
58
Refer to the diagram for a specific economy. An increase in aggregate demand willA) shift this curve to the right.
B) shift this curve to the left.
C) move this economy down and to the right along the curve.
D) move this economy up and to the left along the curve.
Unlock Deck
Unlock for access to all 268 flashcards in this deck.
Unlock Deck
k this deck
59
Refer to the diagram and assume that prices and wages are flexible both upward and downward in the economy. In the extended AD-AS model,A) demand-pull inflation would involve a rightward shift of curve A, followed by a rightward shift of curve C.
B) cost-push inflation would involve a rightward shift of curve A, followed by a leftward shift of curve C.
C) recession would involve a leftward shift of curve A, followed by leftward shifts of curves C and D.
D) recession could be caused by either a leftward shift of curve A or a leftward shift of curve C.
Unlock Deck
Unlock for access to all 268 flashcards in this deck.
Unlock Deck
k this deck
60
Refer to the graphs, where the subscripts on the labels denote years 1 and 2. From the graphs we can clearly conclude that the economyA) is not at full employment in either year.
B) is at full employment in year 1 but not in year 2.
C) is at full employment in year 2 but not in year 1.
D) is at full employment in both years.
Unlock Deck
Unlock for access to all 268 flashcards in this deck.
Unlock Deck
k this deck
61
An adverse aggregate supply shock could result from
A) a sharp rise in productivity.
B) a rapid rise in oil prices.
C) a decline in wages.
D) an appreciation of the dollar.
A) a sharp rise in productivity.
B) a rapid rise in oil prices.
C) a decline in wages.
D) an appreciation of the dollar.
Unlock Deck
Unlock for access to all 268 flashcards in this deck.
Unlock Deck
k this deck
62
Which of the following allegedly contributed to the stagflation in the mid-1970s?
A) appreciation of the dollar
B) a sharp drop in the prices of farm products
C) a dramatic increase in oil prices
D) rising productivity in manufacturing
A) appreciation of the dollar
B) a sharp drop in the prices of farm products
C) a dramatic increase in oil prices
D) rising productivity in manufacturing
Unlock Deck
Unlock for access to all 268 flashcards in this deck.
Unlock Deck
k this deck
63
An adverse aggregate supply shock
A) automatically shifts the aggregate demand curve rightward.
B) causes the Phillips Curve to shift leftward and downward.
C) can be caused by a boost in the rate of growth of productivity.
D) can cause stagflation.
A) automatically shifts the aggregate demand curve rightward.
B) causes the Phillips Curve to shift leftward and downward.
C) can be caused by a boost in the rate of growth of productivity.
D) can cause stagflation.
Unlock Deck
Unlock for access to all 268 flashcards in this deck.
Unlock Deck
k this deck
64
Rightward and upward shifts of the Phillips Curve in the 1970s and early 1980s were caused by
A) adverse shocks to aggregate supply.
B) adverse shocks to aggregate demand.
C) an increase in the misery index.
D) the Vietnam War.
A) adverse shocks to aggregate supply.
B) adverse shocks to aggregate demand.
C) an increase in the misery index.
D) the Vietnam War.
Unlock Deck
Unlock for access to all 268 flashcards in this deck.
Unlock Deck
k this deck
65
In the last half of the 1990s, the usual short-run trade-off between inflation and unemployment did not arise because
A) the Fed held interest rates constant.
B) the federal government balanced its budget.
C) the U.S. personal savings rate rose.
D) productivity (and thus aggregate supply) grew faster than previously.
A) the Fed held interest rates constant.
B) the federal government balanced its budget.
C) the U.S. personal savings rate rose.
D) productivity (and thus aggregate supply) grew faster than previously.
Unlock Deck
Unlock for access to all 268 flashcards in this deck.
Unlock Deck
k this deck
66
As distinct from reductions in the price level, reductions in the rate of inflation are referred to as
A) dollar depreciation.
B) stagflation.
C) deflation.
D) disinflation.
A) dollar depreciation.
B) stagflation.
C) deflation.
D) disinflation.
Unlock Deck
Unlock for access to all 268 flashcards in this deck.
Unlock Deck
k this deck
67
The last few years of the 1990s in the United States were characterized by
A) low inflation and high unemployment.
B) stagflation.
C) low inflation and low unemployment.
D) a high misery index.
A) low inflation and high unemployment.
B) stagflation.
C) low inflation and low unemployment.
D) a high misery index.
Unlock Deck
Unlock for access to all 268 flashcards in this deck.
Unlock Deck
k this deck
68
A rightward shift of the traditional Phillips Curve would suggest that
A) the productivity of labor increased.
B) the rate of inflation is now higher at each rate of unemployment.
C) cost-push inflation decreased.
D) the rate of inflation is now lower at each rate of unemployment.
A) the productivity of labor increased.
B) the rate of inflation is now higher at each rate of unemployment.
C) cost-push inflation decreased.
D) the rate of inflation is now lower at each rate of unemployment.
Unlock Deck
Unlock for access to all 268 flashcards in this deck.
Unlock Deck
k this deck
69
Which of the following is a true statement?
A) Under normal conditions, there is a short-run trade-off between inflation and unemployment.
B) There is a long-run trade-off between inflation and unemployment.
C) The short-run Phillips Curve is vertical.
D) The long-run Phillips Curve is horizontal.
A) Under normal conditions, there is a short-run trade-off between inflation and unemployment.
B) There is a long-run trade-off between inflation and unemployment.
C) The short-run Phillips Curve is vertical.
D) The long-run Phillips Curve is horizontal.
Unlock Deck
Unlock for access to all 268 flashcards in this deck.
Unlock Deck
k this deck
70
Disinflation occurs when
A) the price level is falling.
B) investment plans exceed saving.
C) a speculative investment "bubble" is bursting.
D) the inflation rate is declining.
A) the price level is falling.
B) investment plans exceed saving.
C) a speculative investment "bubble" is bursting.
D) the inflation rate is declining.
Unlock Deck
Unlock for access to all 268 flashcards in this deck.
Unlock Deck
k this deck
71
Which of the following is a true statement?
A) There is a long-run trade-off between inflation and unemployment.
B) There is no trade-off between inflation and unemployment in the short-run.
C) The short-run Phillips Curve is horizontal.
D) The long-run Phillips Curve is vertical.
A) There is a long-run trade-off between inflation and unemployment.
B) There is no trade-off between inflation and unemployment in the short-run.
C) The short-run Phillips Curve is horizontal.
D) The long-run Phillips Curve is vertical.
Unlock Deck
Unlock for access to all 268 flashcards in this deck.
Unlock Deck
k this deck
72
Refer to the diagram for a specific economy. Which of the following best describes a decision by policymakers that moves this economy from point b to point a?A) Policymakers have instituted an expansionary monetary policy and/or a budgetary deficit, thereby accepting more unemployment to reduce the rate of inflation.
B) Policymakers have instituted a restrictive monetary policy and/or a budgetary surplus, thereby accepting a higher rate of inflation to reduce unemployment.
C) Policymakers have instituted an expansionary monetary policy and/or a budgetary deficit, thereby accepting a higher rate of inflation to reduce unemployment.
D) Policymakers have instituted a restrictive monetary policy and/or a budgetary surplus, thereby accepting more unemployment to reduce the rate of inflation.
Unlock Deck
Unlock for access to all 268 flashcards in this deck.
Unlock Deck
k this deck
73
Which of the following is a true statement?
A) There is a long-run trade-off between inflation and unemployment.
B) There is no trade-off between inflation and unemployment in the long run.
C) The short-run Phillips Curve is horizontal.
D) The long-run Phillips Curve is horizontal.
A) There is a long-run trade-off between inflation and unemployment.
B) There is no trade-off between inflation and unemployment in the long run.
C) The short-run Phillips Curve is horizontal.
D) The long-run Phillips Curve is horizontal.
Unlock Deck
Unlock for access to all 268 flashcards in this deck.
Unlock Deck
k this deck
74
Inflation accompanied by falling real output and employment is known as
A) Laffer's law.
B) Okun's law.
C) stagflation.
D) the Phillips Curve.
A) Laffer's law.
B) Okun's law.
C) stagflation.
D) the Phillips Curve.
Unlock Deck
Unlock for access to all 268 flashcards in this deck.
Unlock Deck
k this deck
75
Statistical data for the 1970s and 1980s suggest that
A) the Phillips Curve was stable.
B) the Phillips Curve was unstable.
C) low levels of unemployment were consistently associated with high rates of inflation.
D) the inflation rate was highly stable.
A) the Phillips Curve was stable.
B) the Phillips Curve was unstable.
C) low levels of unemployment were consistently associated with high rates of inflation.
D) the inflation rate was highly stable.
Unlock Deck
Unlock for access to all 268 flashcards in this deck.
Unlock Deck
k this deck
76
Suppose that the Consumer Price Index for a particular economy rose from 110 to 120 in year 1, 120 to 130 in year 2, and 130 to 140 in year 3. We could conclude that this economy is experiencing
A) accelerating inflation.
B) deflation.
C) disinflation.
D) a constant rate of inflation.
A) accelerating inflation.
B) deflation.
C) disinflation.
D) a constant rate of inflation.
Unlock Deck
Unlock for access to all 268 flashcards in this deck.
Unlock Deck
k this deck
77
Refer to the diagram for a specific economy. The shape of this curve suggests thatA) the price level rises at a diminishing rate as the level of aggregate demand increases.
B) full employment and price stability are compatible goals only when aggregate demand is falling.
C) each successive unit of decline in the unemployment rate is accompanied by a smaller increase in the rate of inflation.
D) each successive unit of decline in the unemployment rate is accompanied by a larger increase in the rate of inflation.
Unlock Deck
Unlock for access to all 268 flashcards in this deck.
Unlock Deck
k this deck
78
When the actual rate of inflation is less than the expected rate,
A) the unemployment rate will temporarily rise.
B) firms will increase their output to recoup their falling profits.
C) the unemployment rate will temporarily fall.
D) firms will experience rising profits and thus increase their employment.
A) the unemployment rate will temporarily rise.
B) firms will increase their output to recoup their falling profits.
C) the unemployment rate will temporarily fall.
D) firms will experience rising profits and thus increase their employment.
Unlock Deck
Unlock for access to all 268 flashcards in this deck.
Unlock Deck
k this deck
79
Since the Great Recession of 2007-2009
A) the misery index has increased.
B) the misery index has remained stable.
C) the movement of the unemployment rate and inflation rate has been inconsistent with a stable Phillips Curve.
D) the movement of the unemployment rate and inflation rate has been consistent with a stable Phillips Curve.
A) the misery index has increased.
B) the misery index has remained stable.
C) the movement of the unemployment rate and inflation rate has been inconsistent with a stable Phillips Curve.
D) the movement of the unemployment rate and inflation rate has been consistent with a stable Phillips Curve.
Unlock Deck
Unlock for access to all 268 flashcards in this deck.
Unlock Deck
k this deck
80
Stagflation refers to
A) an increase in inflation accompanied by decreases in real output and employment.
B) a decline in the price level accompanied by increases in real output and employment.
C) a simultaneous increase in real output and the price level.
D) a simultaneous reduction in real output and the price level.
A) an increase in inflation accompanied by decreases in real output and employment.
B) a decline in the price level accompanied by increases in real output and employment.
C) a simultaneous increase in real output and the price level.
D) a simultaneous reduction in real output and the price level.
Unlock Deck
Unlock for access to all 268 flashcards in this deck.
Unlock Deck
k this deck
Unlock Deck
Unlock for access to all 268 flashcards in this deck.


