Deck 14: Yield Curve Strategies
Full screen (f)
Question
Question
Question
Question
Question
Question
Question
Question
Question
Question
Question
Question
Question
Question
Question
Question
Question
Question
Question
Question
Question
The following information relates to Questions
Katsuko Zhao and Johan Flander are portfolio managers with cowiler investments, a uS-
based company. They are assessing the effect of their yield curve forecasts on their bond port-
folios. The yield curve is currently upward sloping.
Zhao's portfolio is currently invested in uS treasury securities. Zhao forecasts an instanta-
neous parallel downward shift in the yield curve. Zhao considers two alternatives to reposition
her current portfolio given her yield curve forecast and assesses the trade-off between convexity
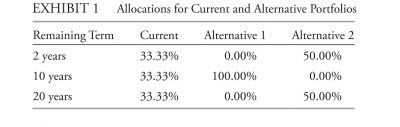
and yield. exhibit 1 presents allocations for the current and two alternative portfolios. The
durations of the current and alternative portfolios are closely matched.
Determine which portfolio in exhibit 2 will most likely have the best performance over the
next 12 months given Flander's yield curve forecast. Justify your response.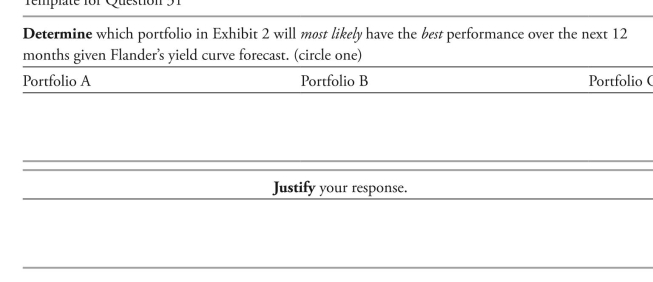 Flander evaluates a new bullet portfolio and a new barbell portfolio, each with a 12-month
time horizon, using zero-coupon notes issued by the australian government. Flander pro-
jects that over the next 12 months, the australian zero-coupon yield curve will experience a
downward parallel shift of 60 bps. The australian dollar is projected to remain stable relative
to the uS dollar. exhibit 3 presents the data for the two portfolios.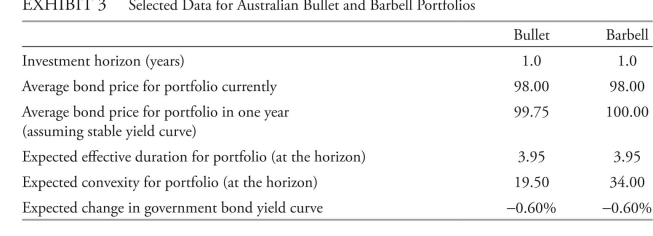
Katsuko Zhao and Johan Flander are portfolio managers with cowiler investments, a uS-
based company. They are assessing the effect of their yield curve forecasts on their bond port-
folios. The yield curve is currently upward sloping.
Zhao's portfolio is currently invested in uS treasury securities. Zhao forecasts an instanta-
neous parallel downward shift in the yield curve. Zhao considers two alternatives to reposition
her current portfolio given her yield curve forecast and assesses the trade-off between convexity
and yield. exhibit 1 presents allocations for the current and two alternative portfolios. The
durations of the current and alternative portfolios are closely matched.
Determine which portfolio in exhibit 2 will most likely have the best performance over the
next 12 months given Flander's yield curve forecast. Justify your response.
Flander evaluates a new bullet portfolio and a new barbell portfolio, each with a 12-monthtime horizon, using zero-coupon notes issued by the australian government. Flander pro-
jects that over the next 12 months, the australian zero-coupon yield curve will experience a
downward parallel shift of 60 bps. The australian dollar is projected to remain stable relative
to the uS dollar. exhibit 3 presents the data for the two portfolios.
Question
Question
Question
The following information relates to Questions
Katsuko Zhao and Johan Flander are portfolio managers with cowiler investments, a uS-
based company. They are assessing the effect of their yield curve forecasts on their bond port-
folios. The yield curve is currently upward sloping.
Zhao's portfolio is currently invested in uS treasury securities. Zhao forecasts an instanta-
neous parallel downward shift in the yield curve. Zhao considers two alternatives to reposition
her current portfolio given her yield curve forecast and assesses the trade-off between convexity
and yield. exhibit 1 presents allocations for the current and two alternative portfolios. The
durations of the current and alternative portfolios are closely matched.
Calculate the total expected return for the bullet and barbell portfolios presented in ex-
hibit 3. Show your calculations. Identify the component factor that contributes most of
the outperformance of the higher-performing portfolio.
template for Question 32
Calculate the total expected return for the bullet and barbell portfolios presented in exhibit 3. Show
your calculations.
Identify the component factor that contributes most of the outperformance of the higher-performing
portfolio.
Question
Question
Question
Question
The following information relates to Questions
Katsuko Zhao and Johan Flander are portfolio managers with cowiler investments, a uS-
based company. They are assessing the effect of their yield curve forecasts on their bond port-
folios. The yield curve is currently upward sloping.
Zhao's portfolio is currently invested in uS treasury securities. Zhao forecasts an instanta-
neous parallel downward shift in the yield curve. Zhao considers two alternatives to reposition
her current portfolio given her yield curve forecast and assesses the trade-off between convexity
and yield. exhibit 1 presents allocations for the current and two alternative portfolios. The
durations of the current and alternative portfolios are closely matched.
Determine which investment would be most appropriate for Zhao given her yield curve
forecast. Justify your response.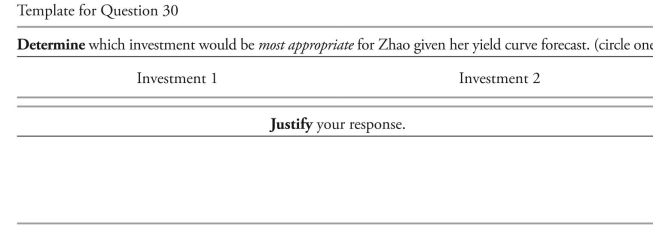 Flander forecasts that the yield curve will steepen over the next 12 months, with long rates
remaining the same and short and intermediate rates falling. Flander evaluates the effect of
these interest rate changes on his three bond portfolios. The partial or key rate price value of a
basis point (PvbP) data for Flander's three portfolios is presented in exhibit 2.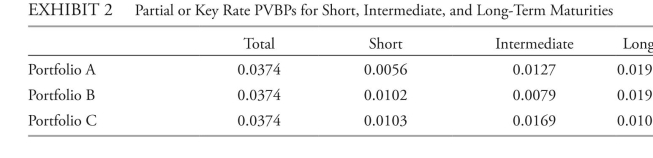
Katsuko Zhao and Johan Flander are portfolio managers with cowiler investments, a uS-
based company. They are assessing the effect of their yield curve forecasts on their bond port-
folios. The yield curve is currently upward sloping.
Zhao's portfolio is currently invested in uS treasury securities. Zhao forecasts an instanta-
neous parallel downward shift in the yield curve. Zhao considers two alternatives to reposition
her current portfolio given her yield curve forecast and assesses the trade-off between convexity
and yield. exhibit 1 presents allocations for the current and two alternative portfolios. The
durations of the current and alternative portfolios are closely matched.
Determine which investment would be most appropriate for Zhao given her yield curve
forecast. Justify your response.
Flander forecasts that the yield curve will steepen over the next 12 months, with long ratesremaining the same and short and intermediate rates falling. Flander evaluates the effect of
these interest rate changes on his three bond portfolios. The partial or key rate price value of a
basis point (PvbP) data for Flander's three portfolios is presented in exhibit 2.
Question
The following information relates to Questions
Katsuko Zhao and Johan Flander are portfolio managers with cowiler investments, a uS-
based company. They are assessing the effect of their yield curve forecasts on their bond port-
folios. The yield curve is currently upward sloping.
Zhao's portfolio is currently invested in uS treasury securities. Zhao forecasts an instanta-
neous parallel downward shift in the yield curve. Zhao considers two alternatives to reposition
her current portfolio given her yield curve forecast and assesses the trade-off between convexity
and yield. exhibit 1 presents allocations for the current and two alternative portfolios. The
durations of the current and alternative portfolios are closely matched.
Determine which alternative portfolio in exhibit 1 would be most appropriate for Zhao
given her yield curve forecast. Justify your selection.
template for Question 29
Determine which alternative portfolio in exhibit 1 would be most appropriate for Zhao, given her yield
curve forecast. (circle one)
alternative 1 alternative 2
Justify your selection.
based on Zhao's forecast of an instantaneous parallel downward shift in the yield curve,
she also considers selling a portion of the uS treasury securities in her portfolio and buying
one of the following two investments:
investment 1 a mortgage-backed security (MbS)
investment 2 a near-the-money call option on 20-year treasury bond futures
The effective duration of the resulting portfolio will be closely matched to Zhao's current
portfolio.
Question
Question
Question

Unlock Deck
Sign up to unlock the cards in this deck!
Unlock Deck
Unlock Deck
1/32
Play
Full screen (f)
Deck 14: Yield Curve Strategies
1
The following information relates to Questions
Silvia abram and Walter edgarton are analysts with cefrino investments, which sponsorsthe cefrino Sovereign bond Fund (the Fund). abram and edgarton recently attended an investment committee meeting where interest rate expectations for the next 12 months were discussed. The Fund's mandate allows its duration to fluctuate ±0.30 per year from the bench- mark duration. The Fund's duration is currently equal to its benchmark. although the Fund is presently invested entirely in annual coupon sovereign bonds, its investment policy also allows investments in mortgage-backed securities (MbS) and call options on government bond fu- tures. The Fund's current holdings of on-the-run bonds are presented in exhibit 1.
over the next 12 months, abram expects a stable yield curve; however, edgarton expects
a steepening yield curve, with short-term yields rising by 1.00% and long-term yields rising
by more than 1.00%.
two alternative portfolio scenarios based on her own yield curve outlook:
Scenario 1 Sell all bonds in the Fund except the 2-year and 30-year bonds, and increase
positions in these two bonds while keeping duration neutral to the benchmark.
Scenario 2 construct a condor to benefit from less curvature in the 5-year to 10-year area
of the yield curve. The condor will utilize the same 1-year, 5-year, 10-year, and
30-year bonds held in the Fund. The maximum allowable position in the 30-year
bond in the condor is $17 million, and the bonds must have equal (absolute
value) money duration.
edgarton evaluates the Fund's positions from exhibit 1 along with two of his pro forma
portfolios, which are summarized in exhibit 2: last, edgarton reviews a separate account for cefrino's uS clients that invest in australian
government bonds. he expects a stable australian yield curve over the next 12 months. he
evaluates the return from buying and holding a 1-year australian government bond versus
buying the 2-year australian government bond and selling it in one year. based on her yield curve forecast, abram recommends to her supervisor changes to the
Fund's holdings using the following three strategies:
Strategy 1 Sell the 3-year bonds, and use the proceeds to buy 10-year bonds.
Strategy 2 Sell the 5-year bonds, and use the proceeds to buy 30-year MbS with an
effective duration of 4.75.
Strategy 3 Sell the 10-year bonds, and buy call options on 10-year government bond
futures.
abram's supervisor disagrees with abram's yield curve outlook. The supervisor develops
-based on exhibit 1 and abram's expectation for the yield curve over the next 12 months, the strategy most likely to improve the Fund's return relative to the benchmark is to:
A) buy and hold.
B) increase convexity.
C) ride the yield curve.
ride the yield curve.
2
The following information relates to Questions
Sanober hirji is a junior analyst with Northco Securities, which is based in canada. Theinstitutional clients of Northco are active investors in canadian coupon-bearing government
bonds. client portfolios are benchmarked to a canadian government bond index, which is a
diverse maturity index portfolio. after reviewing the portfolio of a French institutional client,hirji evaluates yield curve strategies for canadian government bond portfolios under various interest rate scenarios. hirji's supervisor, Éliane Prégent, forecasts that canadian long-term rates will rise and short-term rates will fall over the next 12 months. Northco's chief economist forecasts that canadian interest rates will increase or decrease by 100 basis points over the next 12 months. based on the chief economist's forecast, hirji suggests increasing the convexity of the French institutional client's portfolio by selling 10- year bonds and investing the proceeds in a duration-matched barbell position of canadian government 3-year and long-term bonds. She notes that the duration of the 10-year bonds,
along with the durations of the other portfolio bonds, aligns the portfolio's effective duration with that of the benchmark. Selected data on canadian government bonds are presented inexhibit 1. * There is no single convention for how convexity numbers are
presented; for example, bloomberg has historically followed a
convention of dividing the "raw" convexity number by 100
(as presented here). however, it is important to use the raw
convexity number when estimating returns.
hirji then considers a strategy to sell some long-term bonds from the French institutional
client's portfolio and purchase short maturity at-the-money options on long-term bond fu-
tures. The portfolio's duration would remain unchanged. Prégent asks:
"how would portfolio performance be affected by this strategy if the yield curve were
to remain stable?"
hirji also proposes the following duration-neutral trades for the French institutional client:
• long/short trade on 1-year and 3-year canadian government bonds
• Short/long trade on 10-year and long-term canadian government bonds
Six months later, hirji reviews canadian government bonds for a Malaysian institutional
client. Prégent and hirji expect changes in the curvature of the yield curve but are not sure
whether curvature will increase or decrease. hirji first analyzes positions that would profit from
an increase in the curvature of the yield curve. The positions must be duration neutral, and the
maximum position that the Malaysian client can take in long-term bonds is c$150 million.
hirji notes that interest rates have increased by 100 basis points over the past six months. Se-
lected data for on-the-run canadian government bonds are shown in exhibit 2. hirji then considers the scenario where the yield curve will lose curvature for the Malay-
sian institutional client. She notes that a 7-year canadian government bond is also available
in the market. hirji proposes a duration-neutral portfolio comprised of 47% in 5-year bonds
and 53% in 7-year bonds.
Finally, hirji uses the components of expected returns to compare the performance of a
bullet portfolio and a barbell portfolio for a british institutional client. characteristics of these
portfolios are shown in exhibit 3.
-based on exhibit 2, the amount that hirji should allocate to the 2-year bond position is closest to:
A) c$331 million.
B) c$615 million.
C) c$1,492 million.
c$1,492 million.
3
The following information relates to Questions
amy Mclaughlin is a fixed-income portfolio manager at uK-based delphi investments. one year ago, given her expectations of a stable yield curve over the coming 12 months and noting that the yield curve was upward sloping, Mclaughlin elected to position her portfolio solely in 20-year uS treasury bonds with a coupon rate of 4% and a price of 101.7593, with the expectation of selling the bonds in one year at a price of 109.0629. Mclaughlin expected the uS dollar to depreciate relative to the british pound by 1.50% during the year. Mclaughlin chose the 20-year treasury bonds because they were on the steepest part of the yield curve. Mclaughlin and Michaela donaldson, a junior analyst at delphi, are now discussing how to reposition the portfolio in light of Mclaughlin's expectations about interest rates over the next 12 months. She expects interest rate volatility to be high and the yield curve to experience an increase in the 2s/10s/30s butterfly spread, with the 30-year yield remaining unchanged. Selected yields on the treasury yield curve, and Mclaughlin's expected changes in yields over the next 12 months, are presented in exhibit 1.
-The portfolio strategy implemented by Mclaughlin last year is mostly likely to be described as:
A) a carry trade.
B) a barbell structure.
C) riding the yield curve.
riding the yield curve.
4
The following information relates to Questions
amy Mclaughlin is a fixed-income portfolio manager at uK-based delphi investments. one year ago, given her expectations of a stable yield curve over the coming 12 months and noting that the yield curve was upward sloping, Mclaughlin elected to position her portfolio solely in 20-year uS treasury bonds with a coupon rate of 4% and a price of 101.7593, with the expectation of selling the bonds in one year at a price of 109.0629. Mclaughlin expected the uS dollar to depreciate relative to the british pound by 1.50% during the year. Mclaughlin chose the 20-year treasury bonds because they were on the steepest part of the yield curve. Mclaughlin and Michaela donaldson, a junior analyst at delphi, are now discussing how to reposition the portfolio in light of Mclaughlin's expectations about interest rates over the next 12 months. She expects interest rate volatility to be high and the yield curve to experience an increase in the 2s/10s/30s butterfly spread, with the 30-year yield remaining unchanged. Selected yields on the treasury yield curve, and Mclaughlin's expected changes in yields over the next 12 months, are presented in exhibit 1.
-at the start of last year, the expected return on the portfolio strategy implemented by Mclaughlin was closest to:
A) 9.61%.
B) 9.68%.
C) 12.61%.
Unlock Deck
Unlock for access to all 32 flashcards in this deck.
Unlock Deck
k this deck
5
The following information relates to Questions
Silvia abram and Walter edgarton are analysts with cefrino investments, which sponsorsthe cefrino Sovereign bond Fund (the Fund). abram and edgarton recently attended an investment committee meeting where interest rate expectations for the next 12 months were discussed. The Fund's mandate allows its duration to fluctuate ±0.30 per year from the bench- mark duration. The Fund's duration is currently equal to its benchmark. although the Fund is presently invested entirely in annual coupon sovereign bonds, its investment policy also allows investments in mortgage-backed securities (MbS) and call options on government bond fu- tures. The Fund's current holdings of on-the-run bonds are presented in exhibit 1.
over the next 12 months, abram expects a stable yield curve; however, edgarton expects
a steepening yield curve, with short-term yields rising by 1.00% and long-term yields rising
by more than 1.00%.
two alternative portfolio scenarios based on her own yield curve outlook:
Scenario 1 Sell all bonds in the Fund except the 2-year and 30-year bonds, and increase
positions in these two bonds while keeping duration neutral to the benchmark.
Scenario 2 construct a condor to benefit from less curvature in the 5-year to 10-year area
of the yield curve. The condor will utilize the same 1-year, 5-year, 10-year, and
30-year bonds held in the Fund. The maximum allowable position in the 30-year
bond in the condor is $17 million, and the bonds must have equal (absolute
value) money duration.
edgarton evaluates the Fund's positions from exhibit 1 along with two of his pro forma
portfolios, which are summarized in exhibit 2: last, edgarton reviews a separate account for cefrino's uS clients that invest in australian
government bonds. he expects a stable australian yield curve over the next 12 months. he
evaluates the return from buying and holding a 1-year australian government bond versus
buying the 2-year australian government bond and selling it in one year. based on her yield curve forecast, abram recommends to her supervisor changes to the
Fund's holdings using the following three strategies:
Strategy 1 Sell the 3-year bonds, and use the proceeds to buy 10-year bonds.
Strategy 2 Sell the 5-year bonds, and use the proceeds to buy 30-year MbS with an
effective duration of 4.75.
Strategy 3 Sell the 10-year bonds, and buy call options on 10-year government bond
futures.
abram's supervisor disagrees with abram's yield curve outlook. The supervisor develops
-based on exhibits 1 and 2, which of the following portfolios is most likely to have the best performance given edgarton's yield curve expectations?
A) current Portfolio
B) Pro Forma Portfolio 1
C) Pro Forma Portfolio 2
Unlock Deck
Unlock for access to all 32 flashcards in this deck.
Unlock Deck
k this deck
6
The following information relates to Questions
Sanober hirji is a junior analyst with Northco Securities, which is based in canada. Theinstitutional clients of Northco are active investors in canadian coupon-bearing government
bonds. client portfolios are benchmarked to a canadian government bond index, which is a
diverse maturity index portfolio. after reviewing the portfolio of a French institutional client,hirji evaluates yield curve strategies for canadian government bond portfolios under various interest rate scenarios. hirji's supervisor, Éliane Prégent, forecasts that canadian long-term rates will rise and short-term rates will fall over the next 12 months. Northco's chief economist forecasts that canadian interest rates will increase or decrease by 100 basis points over the next 12 months. based on the chief economist's forecast, hirji suggests increasing the convexity of the French institutional client's portfolio by selling 10- year bonds and investing the proceeds in a duration-matched barbell position of canadian government 3-year and long-term bonds. She notes that the duration of the 10-year bonds,
along with the durations of the other portfolio bonds, aligns the portfolio's effective duration with that of the benchmark. Selected data on canadian government bonds are presented inexhibit 1. * There is no single convention for how convexity numbers are
presented; for example, bloomberg has historically followed a
convention of dividing the "raw" convexity number by 100
(as presented here). however, it is important to use the raw
convexity number when estimating returns.
hirji then considers a strategy to sell some long-term bonds from the French institutional
client's portfolio and purchase short maturity at-the-money options on long-term bond fu-
tures. The portfolio's duration would remain unchanged. Prégent asks:
"how would portfolio performance be affected by this strategy if the yield curve were
to remain stable?"
hirji also proposes the following duration-neutral trades for the French institutional client:
• long/short trade on 1-year and 3-year canadian government bonds
• Short/long trade on 10-year and long-term canadian government bonds
Six months later, hirji reviews canadian government bonds for a Malaysian institutional
client. Prégent and hirji expect changes in the curvature of the yield curve but are not sure
whether curvature will increase or decrease. hirji first analyzes positions that would profit from
an increase in the curvature of the yield curve. The positions must be duration neutral, and the
maximum position that the Malaysian client can take in long-term bonds is c$150 million.
hirji notes that interest rates have increased by 100 basis points over the past six months. Se-
lected data for on-the-run canadian government bonds are shown in exhibit 2. hirji then considers the scenario where the yield curve will lose curvature for the Malay-
sian institutional client. She notes that a 7-year canadian government bond is also available
in the market. hirji proposes a duration-neutral portfolio comprised of 47% in 5-year bonds
and 53% in 7-year bonds.
Finally, hirji uses the components of expected returns to compare the performance of a
bullet portfolio and a barbell portfolio for a british institutional client. characteristics of these
portfolios are shown in exhibit 3.
-based on exhibit 1, the gain in convexity from hirji's suggestion is closest to:
A) 0.423.
B) 1.124.
C) 1.205.
Unlock Deck
Unlock for access to all 32 flashcards in this deck.
Unlock Deck
k this deck
7
The following information relates to Questions
Sanober hirji is a junior analyst with Northco Securities, which is based in canada. Theinstitutional clients of Northco are active investors in canadian coupon-bearing government
bonds. client portfolios are benchmarked to a canadian government bond index, which is a
diverse maturity index portfolio. after reviewing the portfolio of a French institutional client,hirji evaluates yield curve strategies for canadian government bond portfolios under various interest rate scenarios. hirji's supervisor, Éliane Prégent, forecasts that canadian long-term rates will rise and short-term rates will fall over the next 12 months. Northco's chief economist forecasts that canadian interest rates will increase or decrease by 100 basis points over the next 12 months. based on the chief economist's forecast, hirji suggests increasing the convexity of the French institutional client's portfolio by selling 10- year bonds and investing the proceeds in a duration-matched barbell position of canadian government 3-year and long-term bonds. She notes that the duration of the 10-year bonds,
along with the durations of the other portfolio bonds, aligns the portfolio's effective duration with that of the benchmark. Selected data on canadian government bonds are presented inexhibit 1. * There is no single convention for how convexity numbers are
presented; for example, bloomberg has historically followed a
convention of dividing the "raw" convexity number by 100
(as presented here). however, it is important to use the raw
convexity number when estimating returns.
hirji then considers a strategy to sell some long-term bonds from the French institutional
client's portfolio and purchase short maturity at-the-money options on long-term bond fu-
tures. The portfolio's duration would remain unchanged. Prégent asks:
"how would portfolio performance be affected by this strategy if the yield curve were
to remain stable?"
hirji also proposes the following duration-neutral trades for the French institutional client:
• long/short trade on 1-year and 3-year canadian government bonds
• Short/long trade on 10-year and long-term canadian government bonds
Six months later, hirji reviews canadian government bonds for a Malaysian institutional
client. Prégent and hirji expect changes in the curvature of the yield curve but are not sure
whether curvature will increase or decrease. hirji first analyzes positions that would profit from
an increase in the curvature of the yield curve. The positions must be duration neutral, and the
maximum position that the Malaysian client can take in long-term bonds is c$150 million.
hirji notes that interest rates have increased by 100 basis points over the past six months. Se-
lected data for on-the-run canadian government bonds are shown in exhibit 2. hirji then considers the scenario where the yield curve will lose curvature for the Malay-
sian institutional client. She notes that a 7-year canadian government bond is also available
in the market. hirji proposes a duration-neutral portfolio comprised of 47% in 5-year bonds
and 53% in 7-year bonds.
Finally, hirji uses the components of expected returns to compare the performance of a
bullet portfolio and a barbell portfolio for a british institutional client. characteristics of these
portfolios are shown in exhibit 3.
-based on exhibit 3, the total expected return of hirji's barbell portfolio is closest to:
A) −2.30%.
B) 0.07%.
C) 4.60%.
Unlock Deck
Unlock for access to all 32 flashcards in this deck.
Unlock Deck
k this deck
8
The following information relates to Questions
Sanober hirji is a junior analyst with Northco Securities, which is based in canada. Theinstitutional clients of Northco are active investors in canadian coupon-bearing government
bonds. client portfolios are benchmarked to a canadian government bond index, which is a
diverse maturity index portfolio. after reviewing the portfolio of a French institutional client,hirji evaluates yield curve strategies for canadian government bond portfolios under various interest rate scenarios. hirji's supervisor, Éliane Prégent, forecasts that canadian long-term rates will rise and short-term rates will fall over the next 12 months. Northco's chief economist forecasts that canadian interest rates will increase or decrease by 100 basis points over the next 12 months. based on the chief economist's forecast, hirji suggests increasing the convexity of the French institutional client's portfolio by selling 10- year bonds and investing the proceeds in a duration-matched barbell position of canadian government 3-year and long-term bonds. She notes that the duration of the 10-year bonds,
along with the durations of the other portfolio bonds, aligns the portfolio's effective duration with that of the benchmark. Selected data on canadian government bonds are presented inexhibit 1. * There is no single convention for how convexity numbers are
presented; for example, bloomberg has historically followed a
convention of dividing the "raw" convexity number by 100
(as presented here). however, it is important to use the raw
convexity number when estimating returns.
hirji then considers a strategy to sell some long-term bonds from the French institutional
client's portfolio and purchase short maturity at-the-money options on long-term bond fu-
tures. The portfolio's duration would remain unchanged. Prégent asks:
"how would portfolio performance be affected by this strategy if the yield curve were
to remain stable?"
hirji also proposes the following duration-neutral trades for the French institutional client:
• long/short trade on 1-year and 3-year canadian government bonds
• Short/long trade on 10-year and long-term canadian government bonds
Six months later, hirji reviews canadian government bonds for a Malaysian institutional
client. Prégent and hirji expect changes in the curvature of the yield curve but are not sure
whether curvature will increase or decrease. hirji first analyzes positions that would profit from
an increase in the curvature of the yield curve. The positions must be duration neutral, and the
maximum position that the Malaysian client can take in long-term bonds is c$150 million.
hirji notes that interest rates have increased by 100 basis points over the past six months. Se-
lected data for on-the-run canadian government bonds are shown in exhibit 2. hirji then considers the scenario where the yield curve will lose curvature for the Malay-
sian institutional client. She notes that a 7-year canadian government bond is also available
in the market. hirji proposes a duration-neutral portfolio comprised of 47% in 5-year bonds
and 53% in 7-year bonds.
Finally, hirji uses the components of expected returns to compare the performance of a
bullet portfolio and a barbell portfolio for a british institutional client. characteristics of these
portfolios are shown in exhibit 3.
-Which yield curve forecast will most likely result in the highest profit for hirji's proposed duration-neutral trades?
A) increase in curvature
B) decrease in curvature
C) Parallel downward shift
Unlock Deck
Unlock for access to all 32 flashcards in this deck.
Unlock Deck
k this deck
9
The following information relates to Questions
Sanober hirji is a junior analyst with Northco Securities, which is based in canada. Theinstitutional clients of Northco are active investors in canadian coupon-bearing government
bonds. client portfolios are benchmarked to a canadian government bond index, which is a
diverse maturity index portfolio. after reviewing the portfolio of a French institutional client,hirji evaluates yield curve strategies for canadian government bond portfolios under various interest rate scenarios. hirji's supervisor, Éliane Prégent, forecasts that canadian long-term rates will rise and short-term rates will fall over the next 12 months. Northco's chief economist forecasts that canadian interest rates will increase or decrease by 100 basis points over the next 12 months. based on the chief economist's forecast, hirji suggests increasing the convexity of the French institutional client's portfolio by selling 10- year bonds and investing the proceeds in a duration-matched barbell position of canadian government 3-year and long-term bonds. She notes that the duration of the 10-year bonds,
along with the durations of the other portfolio bonds, aligns the portfolio's effective duration with that of the benchmark. Selected data on canadian government bonds are presented inexhibit 1. * There is no single convention for how convexity numbers are
presented; for example, bloomberg has historically followed a
convention of dividing the "raw" convexity number by 100
(as presented here). however, it is important to use the raw
convexity number when estimating returns.
hirji then considers a strategy to sell some long-term bonds from the French institutional
client's portfolio and purchase short maturity at-the-money options on long-term bond fu-
tures. The portfolio's duration would remain unchanged. Prégent asks:
"how would portfolio performance be affected by this strategy if the yield curve were
to remain stable?"
hirji also proposes the following duration-neutral trades for the French institutional client:
• long/short trade on 1-year and 3-year canadian government bonds
• Short/long trade on 10-year and long-term canadian government bonds
Six months later, hirji reviews canadian government bonds for a Malaysian institutional
client. Prégent and hirji expect changes in the curvature of the yield curve but are not sure
whether curvature will increase or decrease. hirji first analyzes positions that would profit from
an increase in the curvature of the yield curve. The positions must be duration neutral, and the
maximum position that the Malaysian client can take in long-term bonds is c$150 million.
hirji notes that interest rates have increased by 100 basis points over the past six months. Se-
lected data for on-the-run canadian government bonds are shown in exhibit 2. hirji then considers the scenario where the yield curve will lose curvature for the Malay-
sian institutional client. She notes that a 7-year canadian government bond is also available
in the market. hirji proposes a duration-neutral portfolio comprised of 47% in 5-year bonds
and 53% in 7-year bonds.
Finally, hirji uses the components of expected returns to compare the performance of a
bullet portfolio and a barbell portfolio for a british institutional client. characteristics of these
portfolios are shown in exhibit 3.
-relative to the canadian government bond index, the portfolio that hirji proposes for the Malaysian client will most likely:
A) underperform.
B) remain stable.
C) outperform.
Unlock Deck
Unlock for access to all 32 flashcards in this deck.
Unlock Deck
k this deck
10
The following information relates to Questions
Silvia abram and Walter edgarton are analysts with cefrino investments, which sponsorsthe cefrino Sovereign bond Fund (the Fund). abram and edgarton recently attended an investment committee meeting where interest rate expectations for the next 12 months were discussed. The Fund's mandate allows its duration to fluctuate ±0.30 per year from the bench- mark duration. The Fund's duration is currently equal to its benchmark. although the Fund is presently invested entirely in annual coupon sovereign bonds, its investment policy also allows investments in mortgage-backed securities (MbS) and call options on government bond fu- tures. The Fund's current holdings of on-the-run bonds are presented in exhibit 1.
over the next 12 months, abram expects a stable yield curve; however, edgarton expects
a steepening yield curve, with short-term yields rising by 1.00% and long-term yields rising
by more than 1.00%.
two alternative portfolio scenarios based on her own yield curve outlook:
Scenario 1 Sell all bonds in the Fund except the 2-year and 30-year bonds, and increase
positions in these two bonds while keeping duration neutral to the benchmark.
Scenario 2 construct a condor to benefit from less curvature in the 5-year to 10-year area
of the yield curve. The condor will utilize the same 1-year, 5-year, 10-year, and
30-year bonds held in the Fund. The maximum allowable position in the 30-year
bond in the condor is $17 million, and the bonds must have equal (absolute
value) money duration.
edgarton evaluates the Fund's positions from exhibit 1 along with two of his pro forma
portfolios, which are summarized in exhibit 2: last, edgarton reviews a separate account for cefrino's uS clients that invest in australian
government bonds. he expects a stable australian yield curve over the next 12 months. he
evaluates the return from buying and holding a 1-year australian government bond versus
buying the 2-year australian government bond and selling it in one year. based on her yield curve forecast, abram recommends to her supervisor changes to the
Fund's holdings using the following three strategies:
Strategy 1 Sell the 3-year bonds, and use the proceeds to buy 10-year bonds.
Strategy 2 Sell the 5-year bonds, and use the proceeds to buy 30-year MbS with an
effective duration of 4.75.
Strategy 3 Sell the 10-year bonds, and buy call options on 10-year government bond
futures.
abram's supervisor disagrees with abram's yield curve outlook. The supervisor develops
-The yield curve expectation that abram's supervisor targets with Scenario 1 is most likely a:
A) flattening yield curve.
B) reduction in yield curve curvature.
C) 100 bps parallel shift downward of the yield curve.
Unlock Deck
Unlock for access to all 32 flashcards in this deck.
Unlock Deck
k this deck
11
The following information relates to Questions
Silvia abram and Walter edgarton are analysts with cefrino investments, which sponsorsthe cefrino Sovereign bond Fund (the Fund). abram and edgarton recently attended an investment committee meeting where interest rate expectations for the next 12 months were discussed. The Fund's mandate allows its duration to fluctuate ±0.30 per year from the bench- mark duration. The Fund's duration is currently equal to its benchmark. although the Fund is presently invested entirely in annual coupon sovereign bonds, its investment policy also allows investments in mortgage-backed securities (MbS) and call options on government bond fu- tures. The Fund's current holdings of on-the-run bonds are presented in exhibit 1.
over the next 12 months, abram expects a stable yield curve; however, edgarton expects
a steepening yield curve, with short-term yields rising by 1.00% and long-term yields rising
by more than 1.00%.
two alternative portfolio scenarios based on her own yield curve outlook:
Scenario 1 Sell all bonds in the Fund except the 2-year and 30-year bonds, and increase
positions in these two bonds while keeping duration neutral to the benchmark.
Scenario 2 construct a condor to benefit from less curvature in the 5-year to 10-year area
of the yield curve. The condor will utilize the same 1-year, 5-year, 10-year, and
30-year bonds held in the Fund. The maximum allowable position in the 30-year
bond in the condor is $17 million, and the bonds must have equal (absolute
value) money duration.
edgarton evaluates the Fund's positions from exhibit 1 along with two of his pro forma
portfolios, which are summarized in exhibit 2: last, edgarton reviews a separate account for cefrino's uS clients that invest in australian
government bonds. he expects a stable australian yield curve over the next 12 months. he
evaluates the return from buying and holding a 1-year australian government bond versus
buying the 2-year australian government bond and selling it in one year. based on her yield curve forecast, abram recommends to her supervisor changes to the
Fund's holdings using the following three strategies:
Strategy 1 Sell the 3-year bonds, and use the proceeds to buy 10-year bonds.
Strategy 2 Sell the 5-year bonds, and use the proceeds to buy 30-year MbS with an
effective duration of 4.75.
Strategy 3 Sell the 10-year bonds, and buy call options on 10-year government bond
futures.
abram's supervisor disagrees with abram's yield curve outlook. The supervisor develops
-based on exhibit 1, which short position is most likely to be included in the condor out-lined in Scenario 2?
A) 1-year $338 million
B) 5-year $71 million
C) 10-year $38 million
Unlock Deck
Unlock for access to all 32 flashcards in this deck.
Unlock Deck
k this deck
12
The following information relates to Questions
amy Mclaughlin is a fixed-income portfolio manager at uK-based delphi investments. one year ago, given her expectations of a stable yield curve over the coming 12 months and noting that the yield curve was upward sloping, Mclaughlin elected to position her portfolio solely in 20-year uS treasury bonds with a coupon rate of 4% and a price of 101.7593, with the expectation of selling the bonds in one year at a price of 109.0629. Mclaughlin expected the uS dollar to depreciate relative to the british pound by 1.50% during the year. Mclaughlin chose the 20-year treasury bonds because they were on the steepest part of the yield curve. Mclaughlin and Michaela donaldson, a junior analyst at delphi, are now discussing how to reposition the portfolio in light of Mclaughlin's expectations about interest rates over the next 12 months. She expects interest rate volatility to be high and the yield curve to experience an increase in the 2s/10s/30s butterfly spread, with the 30-year yield remaining unchanged. Selected yields on the treasury yield curve, and Mclaughlin's expected changes in yields over the next 12 months, are presented in exhibit 1.
-given Mclaughlin's interest rate expectations over the next 12 months, which long/short structure would be most appropriate?
A) condor: short wings, long body
B) butterfly: short barbell, long bullet
C) butterfly: long barbell, short bullet
Unlock Deck
Unlock for access to all 32 flashcards in this deck.
Unlock Deck
k this deck
13
The following information relates to Questions
amy Mclaughlin is a fixed-income portfolio manager at uK-based delphi investments. one year ago, given her expectations of a stable yield curve over the coming 12 months and noting that the yield curve was upward sloping, Mclaughlin elected to position her portfolio solely in 20-year uS treasury bonds with a coupon rate of 4% and a price of 101.7593, with the expectation of selling the bonds in one year at a price of 109.0629. Mclaughlin expected the uS dollar to depreciate relative to the british pound by 1.50% during the year. Mclaughlin chose the 20-year treasury bonds because they were on the steepest part of the yield curve. Mclaughlin and Michaela donaldson, a junior analyst at delphi, are now discussing how to reposition the portfolio in light of Mclaughlin's expectations about interest rates over the next 12 months. She expects interest rate volatility to be high and the yield curve to experience an increase in the 2s/10s/30s butterfly spread, with the 30-year yield remaining unchanged. Selected yields on the treasury yield curve, and Mclaughlin's expected changes in yields over the next 12 months, are presented in exhibit 1.
-using the yield curve forecast shown in exhibit 1, which portfolio strategy should don- aldson recommend for the year ahead?
A) The bullet portfolio
B) The barbell portfolio
C) The laddered portfolio
Unlock Deck
Unlock for access to all 32 flashcards in this deck.
Unlock Deck
k this deck
14
The following information relates to Questions
amy Mclaughlin is a fixed-income portfolio manager at uK-based delphi investments. one year ago, given her expectations of a stable yield curve over the coming 12 months and noting that the yield curve was upward sloping, Mclaughlin elected to position her portfolio solely in 20-year uS treasury bonds with a coupon rate of 4% and a price of 101.7593, with the expectation of selling the bonds in one year at a price of 109.0629. Mclaughlin expected the uS dollar to depreciate relative to the british pound by 1.50% during the year. Mclaughlin chose the 20-year treasury bonds because they were on the steepest part of the yield curve. Mclaughlin and Michaela donaldson, a junior analyst at delphi, are now discussing how to reposition the portfolio in light of Mclaughlin's expectations about interest rates over the next 12 months. She expects interest rate volatility to be high and the yield curve to experience an increase in the 2s/10s/30s butterfly spread, with the 30-year yield remaining unchanged. Selected yields on the treasury yield curve, and Mclaughlin's expected changes in yields over the next 12 months, are presented in exhibit 1.
-Which of donaldson's statements is correct?
A) only Statement 1
B) only Statement 2
C) both Statements 1 and 2
Unlock Deck
Unlock for access to all 32 flashcards in this deck.
Unlock Deck
k this deck
15
The following information relates to Questions
Silvia abram and Walter edgarton are analysts with cefrino investments, which sponsorsthe cefrino Sovereign bond Fund (the Fund). abram and edgarton recently attended an investment committee meeting where interest rate expectations for the next 12 months were discussed. The Fund's mandate allows its duration to fluctuate ±0.30 per year from the bench- mark duration. The Fund's duration is currently equal to its benchmark. although the Fund is presently invested entirely in annual coupon sovereign bonds, its investment policy also allows investments in mortgage-backed securities (MbS) and call options on government bond fu- tures. The Fund's current holdings of on-the-run bonds are presented in exhibit 1.
over the next 12 months, abram expects a stable yield curve; however, edgarton expects
a steepening yield curve, with short-term yields rising by 1.00% and long-term yields rising
by more than 1.00%.
two alternative portfolio scenarios based on her own yield curve outlook:
Scenario 1 Sell all bonds in the Fund except the 2-year and 30-year bonds, and increase
positions in these two bonds while keeping duration neutral to the benchmark.
Scenario 2 construct a condor to benefit from less curvature in the 5-year to 10-year area
of the yield curve. The condor will utilize the same 1-year, 5-year, 10-year, and
30-year bonds held in the Fund. The maximum allowable position in the 30-year
bond in the condor is $17 million, and the bonds must have equal (absolute
value) money duration.
edgarton evaluates the Fund's positions from exhibit 1 along with two of his pro forma
portfolios, which are summarized in exhibit 2: last, edgarton reviews a separate account for cefrino's uS clients that invest in australian
government bonds. he expects a stable australian yield curve over the next 12 months. he
evaluates the return from buying and holding a 1-year australian government bond versus
buying the 2-year australian government bond and selling it in one year. based on her yield curve forecast, abram recommends to her supervisor changes to the
Fund's holdings using the following three strategies:
Strategy 1 Sell the 3-year bonds, and use the proceeds to buy 10-year bonds.
Strategy 2 Sell the 5-year bonds, and use the proceeds to buy 30-year MbS with an
effective duration of 4.75.
Strategy 3 Sell the 10-year bonds, and buy call options on 10-year government bond
futures.
abram's supervisor disagrees with abram's yield curve outlook. The supervisor develops
-based on edgarton's expectation for the yield curve over the next 12 months, the Fund's return relative to the benchmark would most likely increase by:
A) riding the yield curve.
B) implementing a barbell structure.
C) shortening the portfolio duration relative to the benchmark.
Unlock Deck
Unlock for access to all 32 flashcards in this deck.
Unlock Deck
k this deck
16
The following information relates to Questions
Sanober hirji is a junior analyst with Northco Securities, which is based in canada. Theinstitutional clients of Northco are active investors in canadian coupon-bearing government
bonds. client portfolios are benchmarked to a canadian government bond index, which is a
diverse maturity index portfolio. after reviewing the portfolio of a French institutional client,hirji evaluates yield curve strategies for canadian government bond portfolios under various interest rate scenarios. hirji's supervisor, Éliane Prégent, forecasts that canadian long-term rates will rise and short-term rates will fall over the next 12 months. Northco's chief economist forecasts that canadian interest rates will increase or decrease by 100 basis points over the next 12 months. based on the chief economist's forecast, hirji suggests increasing the convexity of the French institutional client's portfolio by selling 10- year bonds and investing the proceeds in a duration-matched barbell position of canadian government 3-year and long-term bonds. She notes that the duration of the 10-year bonds,
along with the durations of the other portfolio bonds, aligns the portfolio's effective duration with that of the benchmark. Selected data on canadian government bonds are presented inexhibit 1. * There is no single convention for how convexity numbers are
presented; for example, bloomberg has historically followed a
convention of dividing the "raw" convexity number by 100
(as presented here). however, it is important to use the raw
convexity number when estimating returns.
hirji then considers a strategy to sell some long-term bonds from the French institutional
client's portfolio and purchase short maturity at-the-money options on long-term bond fu-
tures. The portfolio's duration would remain unchanged. Prégent asks:
"how would portfolio performance be affected by this strategy if the yield curve were
to remain stable?"
hirji also proposes the following duration-neutral trades for the French institutional client:
• long/short trade on 1-year and 3-year canadian government bonds
• Short/long trade on 10-year and long-term canadian government bonds
Six months later, hirji reviews canadian government bonds for a Malaysian institutional
client. Prégent and hirji expect changes in the curvature of the yield curve but are not sure
whether curvature will increase or decrease. hirji first analyzes positions that would profit from
an increase in the curvature of the yield curve. The positions must be duration neutral, and the
maximum position that the Malaysian client can take in long-term bonds is c$150 million.
hirji notes that interest rates have increased by 100 basis points over the past six months. Se-
lected data for on-the-run canadian government bonds are shown in exhibit 2. hirji then considers the scenario where the yield curve will lose curvature for the Malay-
sian institutional client. She notes that a 7-year canadian government bond is also available
in the market. hirji proposes a duration-neutral portfolio comprised of 47% in 5-year bonds
and 53% in 7-year bonds.
Finally, hirji uses the components of expected returns to compare the performance of a
bullet portfolio and a barbell portfolio for a british institutional client. characteristics of these
portfolios are shown in exhibit 3.
-based on Prégent's interest rate forecast over the next 12 months, the yield curve strategy that would most likely realize the highest profit is:
A) a carry trade.
B) a bullet structure.
C) duration management by buying long-term canadian bonds.
Unlock Deck
Unlock for access to all 32 flashcards in this deck.
Unlock Deck
k this deck
17
The following information relates to Questions
Sanober hirji is a junior analyst with Northco Securities, which is based in canada. Theinstitutional clients of Northco are active investors in canadian coupon-bearing government
bonds. client portfolios are benchmarked to a canadian government bond index, which is a
diverse maturity index portfolio. after reviewing the portfolio of a French institutional client,hirji evaluates yield curve strategies for canadian government bond portfolios under various interest rate scenarios. hirji's supervisor, Éliane Prégent, forecasts that canadian long-term rates will rise and short-term rates will fall over the next 12 months. Northco's chief economist forecasts that canadian interest rates will increase or decrease by 100 basis points over the next 12 months. based on the chief economist's forecast, hirji suggests increasing the convexity of the French institutional client's portfolio by selling 10- year bonds and investing the proceeds in a duration-matched barbell position of canadian government 3-year and long-term bonds. She notes that the duration of the 10-year bonds,
along with the durations of the other portfolio bonds, aligns the portfolio's effective duration with that of the benchmark. Selected data on canadian government bonds are presented inexhibit 1. * There is no single convention for how convexity numbers are
presented; for example, bloomberg has historically followed a
convention of dividing the "raw" convexity number by 100
(as presented here). however, it is important to use the raw
convexity number when estimating returns.
hirji then considers a strategy to sell some long-term bonds from the French institutional
client's portfolio and purchase short maturity at-the-money options on long-term bond fu-
tures. The portfolio's duration would remain unchanged. Prégent asks:
"how would portfolio performance be affected by this strategy if the yield curve were
to remain stable?"
hirji also proposes the following duration-neutral trades for the French institutional client:
• long/short trade on 1-year and 3-year canadian government bonds
• Short/long trade on 10-year and long-term canadian government bonds
Six months later, hirji reviews canadian government bonds for a Malaysian institutional
client. Prégent and hirji expect changes in the curvature of the yield curve but are not sure
whether curvature will increase or decrease. hirji first analyzes positions that would profit from
an increase in the curvature of the yield curve. The positions must be duration neutral, and the
maximum position that the Malaysian client can take in long-term bonds is c$150 million.
hirji notes that interest rates have increased by 100 basis points over the past six months. Se-
lected data for on-the-run canadian government bonds are shown in exhibit 2. hirji then considers the scenario where the yield curve will lose curvature for the Malay-
sian institutional client. She notes that a 7-year canadian government bond is also available
in the market. hirji proposes a duration-neutral portfolio comprised of 47% in 5-year bonds
and 53% in 7-year bonds.
Finally, hirji uses the components of expected returns to compare the performance of a
bullet portfolio and a barbell portfolio for a british institutional client. characteristics of these
portfolios are shown in exhibit 3.
-The answer to Prégent's question is that the portfolio would most likely experience:
A) a loss.
B) no change.
C) a gain.
Unlock Deck
Unlock for access to all 32 flashcards in this deck.
Unlock Deck
k this deck
18
The following information relates to Questions
amy Mclaughlin is a fixed-income portfolio manager at uK-based delphi investments. one year ago, given her expectations of a stable yield curve over the coming 12 months and noting that the yield curve was upward sloping, Mclaughlin elected to position her portfolio solely in 20-year uS treasury bonds with a coupon rate of 4% and a price of 101.7593, with the expectation of selling the bonds in one year at a price of 109.0629. Mclaughlin expected the uS dollar to depreciate relative to the british pound by 1.50% during the year. Mclaughlin chose the 20-year treasury bonds because they were on the steepest part of the yield curve. Mclaughlin and Michaela donaldson, a junior analyst at delphi, are now discussing how to reposition the portfolio in light of Mclaughlin's expectations about interest rates over the next 12 months. She expects interest rate volatility to be high and the yield curve to experience an increase in the 2s/10s/30s butterfly spread, with the 30-year yield remaining unchanged. Selected yields on the treasury yield curve, and Mclaughlin's expected changes in yields over the next 12 months, are presented in exhibit 1.
-given Mclaughlin's interest rate expectations over the next 12 months, one way that donaldson and Mclaughlin could alter convexity to enhance expected return would be
To:
A) sell call options on bonds held in the portfolio.
B) buy call options on long-maturity government bond futures.
C) sell put options on bonds they would be willing to own in the portfolio.
Unlock Deck
Unlock for access to all 32 flashcards in this deck.
Unlock Deck
k this deck
19
The following information relates to Questions
Sanober hirji is a junior analyst with Northco Securities, which is based in canada. Theinstitutional clients of Northco are active investors in canadian coupon-bearing government
bonds. client portfolios are benchmarked to a canadian government bond index, which is a
diverse maturity index portfolio. after reviewing the portfolio of a French institutional client,hirji evaluates yield curve strategies for canadian government bond portfolios under various interest rate scenarios. hirji's supervisor, Éliane Prégent, forecasts that canadian long-term rates will rise and short-term rates will fall over the next 12 months. Northco's chief economist forecasts that canadian interest rates will increase or decrease by 100 basis points over the next 12 months. based on the chief economist's forecast, hirji suggests increasing the convexity of the French institutional client's portfolio by selling 10- year bonds and investing the proceeds in a duration-matched barbell position of canadian government 3-year and long-term bonds. She notes that the duration of the 10-year bonds,
along with the durations of the other portfolio bonds, aligns the portfolio's effective duration with that of the benchmark. Selected data on canadian government bonds are presented inexhibit 1. * There is no single convention for how convexity numbers are
presented; for example, bloomberg has historically followed a
convention of dividing the "raw" convexity number by 100
(as presented here). however, it is important to use the raw
convexity number when estimating returns.
hirji then considers a strategy to sell some long-term bonds from the French institutional
client's portfolio and purchase short maturity at-the-money options on long-term bond fu-
tures. The portfolio's duration would remain unchanged. Prégent asks:
"how would portfolio performance be affected by this strategy if the yield curve were
to remain stable?"
hirji also proposes the following duration-neutral trades for the French institutional client:
• long/short trade on 1-year and 3-year canadian government bonds
• Short/long trade on 10-year and long-term canadian government bonds
Six months later, hirji reviews canadian government bonds for a Malaysian institutional
client. Prégent and hirji expect changes in the curvature of the yield curve but are not sure
whether curvature will increase or decrease. hirji first analyzes positions that would profit from
an increase in the curvature of the yield curve. The positions must be duration neutral, and the
maximum position that the Malaysian client can take in long-term bonds is c$150 million.
hirji notes that interest rates have increased by 100 basis points over the past six months. Se-
lected data for on-the-run canadian government bonds are shown in exhibit 2. hirji then considers the scenario where the yield curve will lose curvature for the Malay-
sian institutional client. She notes that a 7-year canadian government bond is also available
in the market. hirji proposes a duration-neutral portfolio comprised of 47% in 5-year bonds
and 53% in 7-year bonds.
Finally, hirji uses the components of expected returns to compare the performance of a
bullet portfolio and a barbell portfolio for a british institutional client. characteristics of these
portfolios are shown in exhibit 3.
-based on exhibit 3, the difference in the rolling yield between hirji's bullet portfolio and barbell portfolio is:
A) −8 basis points.
B) −6 basis points.
C) 2 basis points.
Unlock Deck
Unlock for access to all 32 flashcards in this deck.
Unlock Deck
k this deck
20
The following information relates to Questions
Silvia abram and Walter edgarton are analysts with cefrino investments, which sponsorsthe cefrino Sovereign bond Fund (the Fund). abram and edgarton recently attended an investment committee meeting where interest rate expectations for the next 12 months were discussed. The Fund's mandate allows its duration to fluctuate ±0.30 per year from the bench- mark duration. The Fund's duration is currently equal to its benchmark. although the Fund is presently invested entirely in annual coupon sovereign bonds, its investment policy also allows investments in mortgage-backed securities (MbS) and call options on government bond fu- tures. The Fund's current holdings of on-the-run bonds are presented in exhibit 1.
over the next 12 months, abram expects a stable yield curve; however, edgarton expects
a steepening yield curve, with short-term yields rising by 1.00% and long-term yields rising
by more than 1.00%.
two alternative portfolio scenarios based on her own yield curve outlook:
Scenario 1 Sell all bonds in the Fund except the 2-year and 30-year bonds, and increase
positions in these two bonds while keeping duration neutral to the benchmark.
Scenario 2 construct a condor to benefit from less curvature in the 5-year to 10-year area
of the yield curve. The condor will utilize the same 1-year, 5-year, 10-year, and
30-year bonds held in the Fund. The maximum allowable position in the 30-year
bond in the condor is $17 million, and the bonds must have equal (absolute
value) money duration.
edgarton evaluates the Fund's positions from exhibit 1 along with two of his pro forma
portfolios, which are summarized in exhibit 2: last, edgarton reviews a separate account for cefrino's uS clients that invest in australian
government bonds. he expects a stable australian yield curve over the next 12 months. he
evaluates the return from buying and holding a 1-year australian government bond versus
buying the 2-year australian government bond and selling it in one year. based on her yield curve forecast, abram recommends to her supervisor changes to the
Fund's holdings using the following three strategies:
Strategy 1 Sell the 3-year bonds, and use the proceeds to buy 10-year bonds.
Strategy 2 Sell the 5-year bonds, and use the proceeds to buy 30-year MbS with an
effective duration of 4.75.
Strategy 3 Sell the 10-year bonds, and buy call options on 10-year government bond
futures.
abram's supervisor disagrees with abram's yield curve outlook. The supervisor develops
-based on exhibit 1 and abram's interest rate expectations, which of the following strate- gies is expected to perform best over the next 12 months?
A) Strategy 1
B) Strategy 2
C) Strategy 3
Unlock Deck
Unlock for access to all 32 flashcards in this deck.
Unlock Deck
k this deck
21
The following information relates to Questions
Katsuko Zhao and Johan Flander are portfolio managers with cowiler investments, a uS-
based company. They are assessing the effect of their yield curve forecasts on their bond port-
folios. The yield curve is currently upward sloping.
Zhao's portfolio is currently invested in uS treasury securities. Zhao forecasts an instanta-
neous parallel downward shift in the yield curve. Zhao considers two alternatives to reposition
her current portfolio given her yield curve forecast and assesses the trade-off between convexity
and yield. exhibit 1 presents allocations for the current and two alternative portfolios. The
durations of the current and alternative portfolios are closely matched.
Determine which portfolio in exhibit 2 will most likely have the best performance over the
next 12 months given Flander's yield curve forecast. Justify your response. Flander evaluates a new bullet portfolio and a new barbell portfolio, each with a 12-month
time horizon, using zero-coupon notes issued by the australian government. Flander pro-
jects that over the next 12 months, the australian zero-coupon yield curve will experience a
downward parallel shift of 60 bps. The australian dollar is projected to remain stable relative
to the uS dollar. exhibit 3 presents the data for the two portfolios.
Katsuko Zhao and Johan Flander are portfolio managers with cowiler investments, a uS-
based company. They are assessing the effect of their yield curve forecasts on their bond port-
folios. The yield curve is currently upward sloping.
Zhao's portfolio is currently invested in uS treasury securities. Zhao forecasts an instanta-
neous parallel downward shift in the yield curve. Zhao considers two alternatives to reposition
her current portfolio given her yield curve forecast and assesses the trade-off between convexity
and yield. exhibit 1 presents allocations for the current and two alternative portfolios. The
durations of the current and alternative portfolios are closely matched.
Determine which portfolio in exhibit 2 will most likely have the best performance over the
next 12 months given Flander's yield curve forecast. Justify your response.
Flander evaluates a new bullet portfolio and a new barbell portfolio, each with a 12-monthtime horizon, using zero-coupon notes issued by the australian government. Flander pro-
jects that over the next 12 months, the australian zero-coupon yield curve will experience a
downward parallel shift of 60 bps. The australian dollar is projected to remain stable relative
to the uS dollar. exhibit 3 presents the data for the two portfolios.
Unlock Deck
Unlock for access to all 32 flashcards in this deck.
Unlock Deck
k this deck
22
The following information relates to Questions
Susan Winslow manages bond funds denominated in uS dollars, euros, and british pounds.each fund invests in sovereign bonds and related derivatives. each fund can invest a portion of its assets outside its base currency market with or without hedging the currency exposure, but to
date Winslow has not utilized this capacity. She believes she can also hedge bonds into curren- cies other than a portfolio's base currency when she expects doing so will add value. however, the legal department has not yet confirmed this interpretation. if the lawyers disagree, Winslow will be limited to either unhedged positions or hedging into each portfolio's base currency.
given the historically low rates available in the uS, euro, and uK markets, Winslow has decided to look for inter-market opportunities. With that in mind, she gathered observations about such trades from various sources. Winslow's notes with respect to carry trades include these statements:
i. carry trades may or may not involve a maturity mismatch.
ii. carry trades require two yield curves with substantially different slopes.
iii. inter-market carry trades just break even if both yield curves move to the forward rates.
regarding inter-market trades in general her notes indicate:
iv. inter-market trades should be assessed based on currency-hedged returns.
v. anticipated changes in yield spreads are the primary driver of inter-market trades.
vi. Whether a bond offers a relatively attractive return depends on both the portfolio's base
currency and the currency in which the bond is denominated. Winslow thinks the Mexican and greek markets may offer attractive opportunities to en- hance returns. Yields in these markets are given in exhibit 1, along with those for the base cur- rencies of her portfolios. The greek rates are for euro-denominated government bonds priced at par. in the other markets, the yields apply to par sovereign bonds as well as to the fixed side of
swaps versus six-month libor (i.e., swap spreads are zero in each market). The six-month libor
rates also represent the rates at which investors can borrow or lend in each currency. Winslow
observes that the five-year treasury-note and the five-year german government note are the
cheapest to deliver against their respective futures contracts expiring in six months.
Winslow expects yields in the uS, euro, uK, and greek markets to remain stable over the
next six months. She expects Mexican yields to decline to 7.0% at all maturities. Meanwhile,
she projects that the Mexican peso will depreciate by 2% against the euro, the uS dollar will
depreciate by 1% against the euro, and the british pound will remain stable versus the euro.
Winslow believes bonds of the same maturity may be viewed as having the same duration for purposes of identifying the most attractive positions. based on these views, Winslow is considering three types of trades. First, she is looking at carry trades, with or without taking currency exposure, among her three base currency
markets. each such trade will involve extending duration (e.g., lend long/borrow short) in no more than one market. Second, assuming the legal department confirms her interpretation of permissible currency hedging, she wants to identify the most attractive five-year bond and
currency exposure for each of her three portfolios from among the five markets shown in exhibit 1. Third, she wants to identify the most attractive five-year bond and hedging decision
for each portfolio if she is only allowed to hedge into the portfolio's base currency.
-if Winslow is allowed to hedge into any of the currencies, she can obtain the highest ex- pected returns by
A) buying the greek 5-year in each portfolio and hedging it into pesos.
B) buying the greek 5-year in each portfolio and hedging it into uSd.
C) buying the Mexican 5-year in each portfolio and not hedging the currency.
Unlock Deck
Unlock for access to all 32 flashcards in this deck.
Unlock Deck
k this deck
23
The following information relates to Questions
Silvia abram and Walter edgarton are analysts with cefrino investments, which sponsorsthe cefrino Sovereign bond Fund (the Fund). abram and edgarton recently attended an investment committee meeting where interest rate expectations for the next 12 months were discussed. The Fund's mandate allows its duration to fluctuate ±0.30 per year from the bench- mark duration. The Fund's duration is currently equal to its benchmark. although the Fund is presently invested entirely in annual coupon sovereign bonds, its investment policy also allows investments in mortgage-backed securities (MbS) and call options on government bond fu- tures. The Fund's current holdings of on-the-run bonds are presented in exhibit 1.
over the next 12 months, abram expects a stable yield curve; however, edgarton expects
a steepening yield curve, with short-term yields rising by 1.00% and long-term yields rising
by more than 1.00%.
two alternative portfolio scenarios based on her own yield curve outlook:
Scenario 1 Sell all bonds in the Fund except the 2-year and 30-year bonds, and increase
positions in these two bonds while keeping duration neutral to the benchmark.
Scenario 2 construct a condor to benefit from less curvature in the 5-year to 10-year area
of the yield curve. The condor will utilize the same 1-year, 5-year, 10-year, and
30-year bonds held in the Fund. The maximum allowable position in the 30-year
bond in the condor is $17 million, and the bonds must have equal (absolute
value) money duration.
edgarton evaluates the Fund's positions from exhibit 1 along with two of his pro forma
portfolios, which are summarized in exhibit 2: last, edgarton reviews a separate account for cefrino's uS clients that invest in australian
government bonds. he expects a stable australian yield curve over the next 12 months. he
evaluates the return from buying and holding a 1-year australian government bond versus
buying the 2-year australian government bond and selling it in one year. based on her yield curve forecast, abram recommends to her supervisor changes to the
Fund's holdings using the following three strategies:
Strategy 1 Sell the 3-year bonds, and use the proceeds to buy 10-year bonds.
Strategy 2 Sell the 5-year bonds, and use the proceeds to buy 30-year MbS with an
effective duration of 4.75.
Strategy 3 Sell the 10-year bonds, and buy call options on 10-year government bond
futures.
abram's supervisor disagrees with abram's yield curve outlook. The supervisor develops
-based on exhibit 3, the implied australian dollar (a$) 1-year rate, 1-year forward is closest to:
A) 0.15%.
B) 1.95%.
C) 2.10%.
Unlock Deck
Unlock for access to all 32 flashcards in this deck.
Unlock Deck
k this deck
24
The following information relates to Questions
Katsuko Zhao and Johan Flander are portfolio managers with cowiler investments, a uS-
based company. They are assessing the effect of their yield curve forecasts on their bond port-
folios. The yield curve is currently upward sloping.
Zhao's portfolio is currently invested in uS treasury securities. Zhao forecasts an instanta-
neous parallel downward shift in the yield curve. Zhao considers two alternatives to reposition
her current portfolio given her yield curve forecast and assesses the trade-off between convexity
and yield. exhibit 1 presents allocations for the current and two alternative portfolios. The
durations of the current and alternative portfolios are closely matched.
Calculate the total expected return for the bullet and barbell portfolios presented in ex-
hibit 3. Show your calculations. Identify the component factor that contributes most of
the outperformance of the higher-performing portfolio.
template for Question 32
Calculate the total expected return for the bullet and barbell portfolios presented in exhibit 3. Show
your calculations.
Identify the component factor that contributes most of the outperformance of the higher-performing
portfolio.
Unlock Deck
Unlock for access to all 32 flashcards in this deck.
Unlock Deck
k this deck
25
The following information relates to Questions
Susan Winslow manages bond funds denominated in uS dollars, euros, and british pounds.each fund invests in sovereign bonds and related derivatives. each fund can invest a portion of its assets outside its base currency market with or without hedging the currency exposure, but to
date Winslow has not utilized this capacity. She believes she can also hedge bonds into curren- cies other than a portfolio's base currency when she expects doing so will add value. however, the legal department has not yet confirmed this interpretation. if the lawyers disagree, Winslow will be limited to either unhedged positions or hedging into each portfolio's base currency.
given the historically low rates available in the uS, euro, and uK markets, Winslow has decided to look for inter-market opportunities. With that in mind, she gathered observations about such trades from various sources. Winslow's notes with respect to carry trades include these statements:
i. carry trades may or may not involve a maturity mismatch.
ii. carry trades require two yield curves with substantially different slopes.
iii. inter-market carry trades just break even if both yield curves move to the forward rates.
regarding inter-market trades in general her notes indicate:
iv. inter-market trades should be assessed based on currency-hedged returns.
v. anticipated changes in yield spreads are the primary driver of inter-market trades.
vi. Whether a bond offers a relatively attractive return depends on both the portfolio's base
currency and the currency in which the bond is denominated. Winslow thinks the Mexican and greek markets may offer attractive opportunities to en- hance returns. Yields in these markets are given in exhibit 1, along with those for the base cur- rencies of her portfolios. The greek rates are for euro-denominated government bonds priced at par. in the other markets, the yields apply to par sovereign bonds as well as to the fixed side of
swaps versus six-month libor (i.e., swap spreads are zero in each market). The six-month libor
rates also represent the rates at which investors can borrow or lend in each currency. Winslow
observes that the five-year treasury-note and the five-year german government note are the
cheapest to deliver against their respective futures contracts expiring in six months.
Winslow expects yields in the uS, euro, uK, and greek markets to remain stable over the
next six months. She expects Mexican yields to decline to 7.0% at all maturities. Meanwhile,
she projects that the Mexican peso will depreciate by 2% against the euro, the uS dollar will
depreciate by 1% against the euro, and the british pound will remain stable versus the euro.
Winslow believes bonds of the same maturity may be viewed as having the same duration for purposes of identifying the most attractive positions. based on these views, Winslow is considering three types of trades. First, she is looking at carry trades, with or without taking currency exposure, among her three base currency
markets. each such trade will involve extending duration (e.g., lend long/borrow short) in no more than one market. Second, assuming the legal department confirms her interpretation of permissible currency hedging, she wants to identify the most attractive five-year bond and
currency exposure for each of her three portfolios from among the five markets shown in exhibit 1. Third, she wants to identify the most attractive five-year bond and hedging decision
for each portfolio if she is only allowed to hedge into the portfolio's base currency.
-among the carry trades available in the uS, euro, and uK markets, the highest expected return for the uSd-denominated portfolio over the next 6 months is closest to:
A) 0.275%.
B) 0.85%.
C) 0.90%.
Unlock Deck
Unlock for access to all 32 flashcards in this deck.
Unlock Deck
k this deck
26
The following information relates to Questions
Susan Winslow manages bond funds denominated in uS dollars, euros, and british pounds.each fund invests in sovereign bonds and related derivatives. each fund can invest a portion of its assets outside its base currency market with or without hedging the currency exposure, but to
date Winslow has not utilized this capacity. She believes she can also hedge bonds into curren- cies other than a portfolio's base currency when she expects doing so will add value. however, the legal department has not yet confirmed this interpretation. if the lawyers disagree, Winslow will be limited to either unhedged positions or hedging into each portfolio's base currency.
given the historically low rates available in the uS, euro, and uK markets, Winslow has decided to look for inter-market opportunities. With that in mind, she gathered observations about such trades from various sources. Winslow's notes with respect to carry trades include these statements:
i. carry trades may or may not involve a maturity mismatch.
ii. carry trades require two yield curves with substantially different slopes.
iii. inter-market carry trades just break even if both yield curves move to the forward rates.
regarding inter-market trades in general her notes indicate:
iv. inter-market trades should be assessed based on currency-hedged returns.
v. anticipated changes in yield spreads are the primary driver of inter-market trades.
vi. Whether a bond offers a relatively attractive return depends on both the portfolio's base
currency and the currency in which the bond is denominated. Winslow thinks the Mexican and greek markets may offer attractive opportunities to en- hance returns. Yields in these markets are given in exhibit 1, along with those for the base cur- rencies of her portfolios. The greek rates are for euro-denominated government bonds priced at par. in the other markets, the yields apply to par sovereign bonds as well as to the fixed side of
swaps versus six-month libor (i.e., swap spreads are zero in each market). The six-month libor
rates also represent the rates at which investors can borrow or lend in each currency. Winslow
observes that the five-year treasury-note and the five-year german government note are the
cheapest to deliver against their respective futures contracts expiring in six months.
Winslow expects yields in the uS, euro, uK, and greek markets to remain stable over the
next six months. She expects Mexican yields to decline to 7.0% at all maturities. Meanwhile,
she projects that the Mexican peso will depreciate by 2% against the euro, the uS dollar will
depreciate by 1% against the euro, and the british pound will remain stable versus the euro.
Winslow believes bonds of the same maturity may be viewed as having the same duration for purposes of identifying the most attractive positions. based on these views, Winslow is considering three types of trades. First, she is looking at carry trades, with or without taking currency exposure, among her three base currency
markets. each such trade will involve extending duration (e.g., lend long/borrow short) in no more than one market. Second, assuming the legal department confirms her interpretation of permissible currency hedging, she wants to identify the most attractive five-year bond and
currency exposure for each of her three portfolios from among the five markets shown in exhibit 1. Third, she wants to identify the most attractive five-year bond and hedging decision
for each portfolio if she is only allowed to hedge into the portfolio's base currency.
-if Winslow is limited to unhedged positions or hedging into each portfolio's base curren- cy, she can obtain the highest expected returns by
A) buying the Mexican 5-year in each of the portfolios and hedging it into the base cur- rency of the portfolio.
B) buying the greek 5-year in each of the portfolios, hedging the currency in the gbP- based portfolio, and leaving the currency unhedged in the dollar-based portfolio.
C) buying the greek 5-year in the euro-denominated portfolio, buying the Mexican 5-year in the gbP- and uSd-denominated portfolios, and leaving the currency un-
Hedged in each case.
Unlock Deck
Unlock for access to all 32 flashcards in this deck.
Unlock Deck
k this deck
27
The following information relates to Questions
Susan Winslow manages bond funds denominated in uS dollars, euros, and british pounds.each fund invests in sovereign bonds and related derivatives. each fund can invest a portion of its assets outside its base currency market with or without hedging the currency exposure, but to
date Winslow has not utilized this capacity. She believes she can also hedge bonds into curren- cies other than a portfolio's base currency when she expects doing so will add value. however, the legal department has not yet confirmed this interpretation. if the lawyers disagree, Winslow will be limited to either unhedged positions or hedging into each portfolio's base currency.
given the historically low rates available in the uS, euro, and uK markets, Winslow has decided to look for inter-market opportunities. With that in mind, she gathered observations about such trades from various sources. Winslow's notes with respect to carry trades include these statements:
i. carry trades may or may not involve a maturity mismatch.
ii. carry trades require two yield curves with substantially different slopes.
iii. inter-market carry trades just break even if both yield curves move to the forward rates.
regarding inter-market trades in general her notes indicate:
iv. inter-market trades should be assessed based on currency-hedged returns.
v. anticipated changes in yield spreads are the primary driver of inter-market trades.
vi. Whether a bond offers a relatively attractive return depends on both the portfolio's base
currency and the currency in which the bond is denominated. Winslow thinks the Mexican and greek markets may offer attractive opportunities to en- hance returns. Yields in these markets are given in exhibit 1, along with those for the base cur- rencies of her portfolios. The greek rates are for euro-denominated government bonds priced at par. in the other markets, the yields apply to par sovereign bonds as well as to the fixed side of
swaps versus six-month libor (i.e., swap spreads are zero in each market). The six-month libor
rates also represent the rates at which investors can borrow or lend in each currency. Winslow
observes that the five-year treasury-note and the five-year german government note are the
cheapest to deliver against their respective futures contracts expiring in six months.
Winslow expects yields in the uS, euro, uK, and greek markets to remain stable over the
next six months. She expects Mexican yields to decline to 7.0% at all maturities. Meanwhile,
she projects that the Mexican peso will depreciate by 2% against the euro, the uS dollar will
depreciate by 1% against the euro, and the british pound will remain stable versus the euro.
Winslow believes bonds of the same maturity may be viewed as having the same duration for purposes of identifying the most attractive positions. based on these views, Winslow is considering three types of trades. First, she is looking at carry trades, with or without taking currency exposure, among her three base currency
markets. each such trade will involve extending duration (e.g., lend long/borrow short) in no more than one market. Second, assuming the legal department confirms her interpretation of permissible currency hedging, she wants to identify the most attractive five-year bond and
currency exposure for each of her three portfolios from among the five markets shown in exhibit 1. Third, she wants to identify the most attractive five-year bond and hedging decision
for each portfolio if she is only allowed to hedge into the portfolio's base currency.
-Which of Winslow's statements about inter-market trades is incorrect?
A) Statement iv
B) Statement v
C) Statement vi
Unlock Deck
Unlock for access to all 32 flashcards in this deck.
Unlock Deck
k this deck
28
The following information relates to Questions
Katsuko Zhao and Johan Flander are portfolio managers with cowiler investments, a uS-
based company. They are assessing the effect of their yield curve forecasts on their bond port-
folios. The yield curve is currently upward sloping.
Zhao's portfolio is currently invested in uS treasury securities. Zhao forecasts an instanta-
neous parallel downward shift in the yield curve. Zhao considers two alternatives to reposition
her current portfolio given her yield curve forecast and assesses the trade-off between convexity
and yield. exhibit 1 presents allocations for the current and two alternative portfolios. The
durations of the current and alternative portfolios are closely matched.
Determine which investment would be most appropriate for Zhao given her yield curve
forecast. Justify your response. Flander forecasts that the yield curve will steepen over the next 12 months, with long rates
remaining the same and short and intermediate rates falling. Flander evaluates the effect of
these interest rate changes on his three bond portfolios. The partial or key rate price value of a
basis point (PvbP) data for Flander's three portfolios is presented in exhibit 2.
Katsuko Zhao and Johan Flander are portfolio managers with cowiler investments, a uS-
based company. They are assessing the effect of their yield curve forecasts on their bond port-
folios. The yield curve is currently upward sloping.
Zhao's portfolio is currently invested in uS treasury securities. Zhao forecasts an instanta-
neous parallel downward shift in the yield curve. Zhao considers two alternatives to reposition
her current portfolio given her yield curve forecast and assesses the trade-off between convexity
and yield. exhibit 1 presents allocations for the current and two alternative portfolios. The
durations of the current and alternative portfolios are closely matched.
Determine which investment would be most appropriate for Zhao given her yield curve
forecast. Justify your response.
Flander forecasts that the yield curve will steepen over the next 12 months, with long ratesremaining the same and short and intermediate rates falling. Flander evaluates the effect of
these interest rate changes on his three bond portfolios. The partial or key rate price value of a
basis point (PvbP) data for Flander's three portfolios is presented in exhibit 2.
Unlock Deck
Unlock for access to all 32 flashcards in this deck.
Unlock Deck
k this deck
29
The following information relates to Questions
Katsuko Zhao and Johan Flander are portfolio managers with cowiler investments, a uS-
based company. They are assessing the effect of their yield curve forecasts on their bond port-
folios. The yield curve is currently upward sloping.
Zhao's portfolio is currently invested in uS treasury securities. Zhao forecasts an instanta-
neous parallel downward shift in the yield curve. Zhao considers two alternatives to reposition
her current portfolio given her yield curve forecast and assesses the trade-off between convexity
and yield. exhibit 1 presents allocations for the current and two alternative portfolios. The
durations of the current and alternative portfolios are closely matched.
Determine which alternative portfolio in exhibit 1 would be most appropriate for Zhao
given her yield curve forecast. Justify your selection.
template for Question 29
Determine which alternative portfolio in exhibit 1 would be most appropriate for Zhao, given her yield
curve forecast. (circle one)
alternative 1 alternative 2
Justify your selection.
based on Zhao's forecast of an instantaneous parallel downward shift in the yield curve,
she also considers selling a portion of the uS treasury securities in her portfolio and buying
one of the following two investments:
investment 1 a mortgage-backed security (MbS)
investment 2 a near-the-money call option on 20-year treasury bond futures
The effective duration of the resulting portfolio will be closely matched to Zhao's current
portfolio.
Unlock Deck
Unlock for access to all 32 flashcards in this deck.
Unlock Deck
k this deck
30
The following information relates to Questions
Susan Winslow manages bond funds denominated in uS dollars, euros, and british pounds.each fund invests in sovereign bonds and related derivatives. each fund can invest a portion of its assets outside its base currency market with or without hedging the currency exposure, but to
date Winslow has not utilized this capacity. She believes she can also hedge bonds into curren- cies other than a portfolio's base currency when she expects doing so will add value. however, the legal department has not yet confirmed this interpretation. if the lawyers disagree, Winslow will be limited to either unhedged positions or hedging into each portfolio's base currency.
given the historically low rates available in the uS, euro, and uK markets, Winslow has decided to look for inter-market opportunities. With that in mind, she gathered observations about such trades from various sources. Winslow's notes with respect to carry trades include these statements:
i. carry trades may or may not involve a maturity mismatch.
ii. carry trades require two yield curves with substantially different slopes.
iii. inter-market carry trades just break even if both yield curves move to the forward rates.
regarding inter-market trades in general her notes indicate:
iv. inter-market trades should be assessed based on currency-hedged returns.
v. anticipated changes in yield spreads are the primary driver of inter-market trades.
vi. Whether a bond offers a relatively attractive return depends on both the portfolio's base
currency and the currency in which the bond is denominated. Winslow thinks the Mexican and greek markets may offer attractive opportunities to en- hance returns. Yields in these markets are given in exhibit 1, along with those for the base cur- rencies of her portfolios. The greek rates are for euro-denominated government bonds priced at par. in the other markets, the yields apply to par sovereign bonds as well as to the fixed side of
swaps versus six-month libor (i.e., swap spreads are zero in each market). The six-month libor
rates also represent the rates at which investors can borrow or lend in each currency. Winslow
observes that the five-year treasury-note and the five-year german government note are the
cheapest to deliver against their respective futures contracts expiring in six months.
Winslow expects yields in the uS, euro, uK, and greek markets to remain stable over the
next six months. She expects Mexican yields to decline to 7.0% at all maturities. Meanwhile,
she projects that the Mexican peso will depreciate by 2% against the euro, the uS dollar will
depreciate by 1% against the euro, and the british pound will remain stable versus the euro.
Winslow believes bonds of the same maturity may be viewed as having the same duration for purposes of identifying the most attractive positions. based on these views, Winslow is considering three types of trades. First, she is looking at carry trades, with or without taking currency exposure, among her three base currency
markets. each such trade will involve extending duration (e.g., lend long/borrow short) in no more than one market. Second, assuming the legal department confirms her interpretation of permissible currency hedging, she wants to identify the most attractive five-year bond and
currency exposure for each of her three portfolios from among the five markets shown in exhibit 1. Third, she wants to identify the most attractive five-year bond and hedging decision
for each portfolio if she is only allowed to hedge into the portfolio's base currency.
-considering only the uS, uK, and euro markets, the most attractive duration-neutral, currency-neutral carry trade could be implemented as:
A) buy 3-year uK gilts, Sell 3-year german notes, and enter a 6-month Fx forward contract to pay eur/receive gbP.
B) receive fixed/pay floating on a 3-year gbP interest rate swap and receive floating/pay fixed on a 3-year eur interest rate swap.
C) buy the t-note futures contract and sell the german note futures contract for delivery in six months.
Unlock Deck
Unlock for access to all 32 flashcards in this deck.
Unlock Deck
k this deck
31
The following information relates to Questions
Susan Winslow manages bond funds denominated in uS dollars, euros, and british pounds.each fund invests in sovereign bonds and related derivatives. each fund can invest a portion of its assets outside its base currency market with or without hedging the currency exposure, but to
date Winslow has not utilized this capacity. She believes she can also hedge bonds into curren- cies other than a portfolio's base currency when she expects doing so will add value. however, the legal department has not yet confirmed this interpretation. if the lawyers disagree, Winslow will be limited to either unhedged positions or hedging into each portfolio's base currency.
given the historically low rates available in the uS, euro, and uK markets, Winslow has decided to look for inter-market opportunities. With that in mind, she gathered observations about such trades from various sources. Winslow's notes with respect to carry trades include these statements:
i. carry trades may or may not involve a maturity mismatch.
ii. carry trades require two yield curves with substantially different slopes.
iii. inter-market carry trades just break even if both yield curves move to the forward rates.
regarding inter-market trades in general her notes indicate:
iv. inter-market trades should be assessed based on currency-hedged returns.
v. anticipated changes in yield spreads are the primary driver of inter-market trades.
vi. Whether a bond offers a relatively attractive return depends on both the portfolio's base
currency and the currency in which the bond is denominated. Winslow thinks the Mexican and greek markets may offer attractive opportunities to en- hance returns. Yields in these markets are given in exhibit 1, along with those for the base cur- rencies of her portfolios. The greek rates are for euro-denominated government bonds priced at par. in the other markets, the yields apply to par sovereign bonds as well as to the fixed side of
swaps versus six-month libor (i.e., swap spreads are zero in each market). The six-month libor
rates also represent the rates at which investors can borrow or lend in each currency. Winslow
observes that the five-year treasury-note and the five-year german government note are the
cheapest to deliver against their respective futures contracts expiring in six months.
Winslow expects yields in the uS, euro, uK, and greek markets to remain stable over the
next six months. She expects Mexican yields to decline to 7.0% at all maturities. Meanwhile,
she projects that the Mexican peso will depreciate by 2% against the euro, the uS dollar will
depreciate by 1% against the euro, and the british pound will remain stable versus the euro.
Winslow believes bonds of the same maturity may be viewed as having the same duration for purposes of identifying the most attractive positions. based on these views, Winslow is considering three types of trades. First, she is looking at carry trades, with or without taking currency exposure, among her three base currency
markets. each such trade will involve extending duration (e.g., lend long/borrow short) in no more than one market. Second, assuming the legal department confirms her interpretation of permissible currency hedging, she wants to identify the most attractive five-year bond and
currency exposure for each of her three portfolios from among the five markets shown in exhibit 1. Third, she wants to identify the most attractive five-year bond and hedging decision
for each portfolio if she is only allowed to hedge into the portfolio's base currency.
-Which of Winslow's statements about carry trades is correct?
A) Statement i
B) Statement ii
C) Statement iii
Unlock Deck
Unlock for access to all 32 flashcards in this deck.
Unlock Deck
k this deck
32
The following information relates to Questions
Silvia abram and Walter edgarton are analysts with cefrino investments, which sponsorsthe cefrino Sovereign bond Fund (the Fund). abram and edgarton recently attended an investment committee meeting where interest rate expectations for the next 12 months were discussed. The Fund's mandate allows its duration to fluctuate ±0.30 per year from the bench- mark duration. The Fund's duration is currently equal to its benchmark. although the Fund is presently invested entirely in annual coupon sovereign bonds, its investment policy also allows investments in mortgage-backed securities (MbS) and call options on government bond fu- tures. The Fund's current holdings of on-the-run bonds are presented in exhibit 1.
over the next 12 months, abram expects a stable yield curve; however, edgarton expects
a steepening yield curve, with short-term yields rising by 1.00% and long-term yields rising
by more than 1.00%.
two alternative portfolio scenarios based on her own yield curve outlook:
Scenario 1 Sell all bonds in the Fund except the 2-year and 30-year bonds, and increase
positions in these two bonds while keeping duration neutral to the benchmark.
Scenario 2 construct a condor to benefit from less curvature in the 5-year to 10-year area
of the yield curve. The condor will utilize the same 1-year, 5-year, 10-year, and
30-year bonds held in the Fund. The maximum allowable position in the 30-year
bond in the condor is $17 million, and the bonds must have equal (absolute
value) money duration.
edgarton evaluates the Fund's positions from exhibit 1 along with two of his pro forma
portfolios, which are summarized in exhibit 2: last, edgarton reviews a separate account for cefrino's uS clients that invest in australian
government bonds. he expects a stable australian yield curve over the next 12 months. he
evaluates the return from buying and holding a 1-year australian government bond versus
buying the 2-year australian government bond and selling it in one year. based on her yield curve forecast, abram recommends to her supervisor changes to the
Fund's holdings using the following three strategies:
Strategy 1 Sell the 3-year bonds, and use the proceeds to buy 10-year bonds.
Strategy 2 Sell the 5-year bonds, and use the proceeds to buy 30-year MbS with an
effective duration of 4.75.
Strategy 3 Sell the 10-year bonds, and buy call options on 10-year government bond
futures.
abram's supervisor disagrees with abram's yield curve outlook. The supervisor develops
-based on exhibit 3, the 1-year expected return of the buy and hold Portfolio for the cefrino australian government bond portfolio is closest to:
A) 0.83%.
B) 1.08%.
C) 2.22%.
Unlock Deck
Unlock for access to all 32 flashcards in this deck.
Unlock Deck
k this deck
Unlock Deck
Unlock for access to all 32 flashcards in this deck.


