Deck 3: Tables and Graphs for Summarizing Data
Full screen (f)
Question
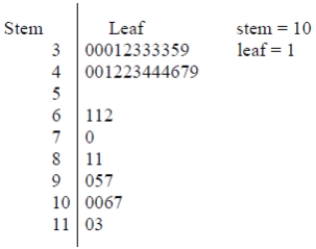 The shape of the data set summarized in the stem-and-leaf diagram is best described as:
A) symmetric.
B) bimodal.
C) negatively skewed.
D) positively skewed.
Question
Question
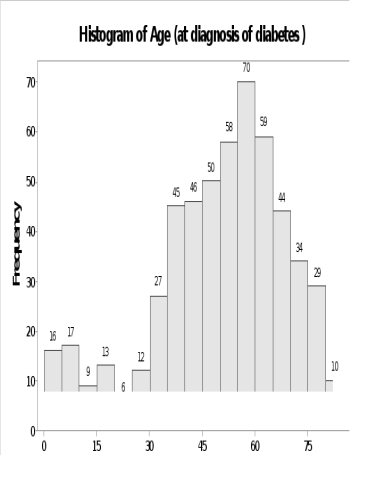 This histogram shows the age at which 548 patients were first diagnosed with diabetes.The shape of this histogram is best described as:
A) symmetric.
B) bimodal.
C) monomodal.
D) positively skewed.
Question
Question
Question
Question
A student counted the number of candies of each color in a bag of 57 Reese's Pieces.The results are shown in the bar graph.  How many of the candies were colored orange?
A) 12
B) 51
C) 29
D) More information is needed.
How many of the candies were colored orange?A) 12
B) 51
C) 29
D) More information is needed.
Question
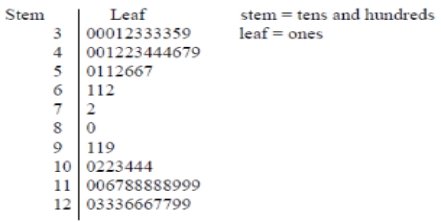 Judging from this stem-and-leaf display, the data set appears to be:
A) skewed.
B) uniform.
C) symmetric.
D) centered at 100.
Question
Question
Question
Question
Question
Question
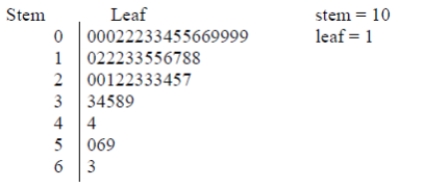
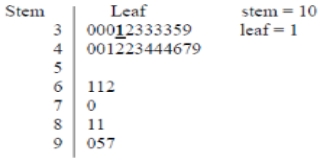 What data value is represented by the bold and underlined "1" in the stem-and-leaf diagram? (Note: It is bold and underlined for emphasis only.)
A) 31
B) 30001
C) 3001
D) 1
Question
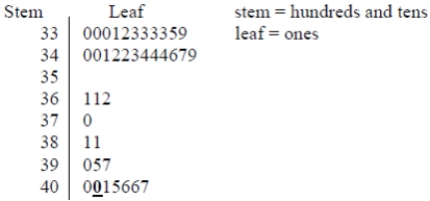 What data value is represented by the bold and underlined "0" in the stem-and-leaf diagram? (Note: It is bold and underlined for emphasis only.)
A) 4000
B) 400
C) 40
D) 4
Question
Question
Question
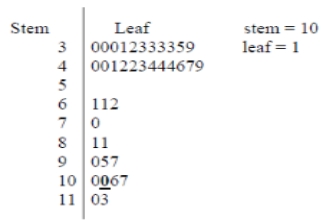 What is the value of the data point represented by the bold and underlined "0" in the stem-and-leaf diagram? (Note: It is bold and underlined for emphasis only.)
A) 1
B) 10
C) 100
D) 1000
Question
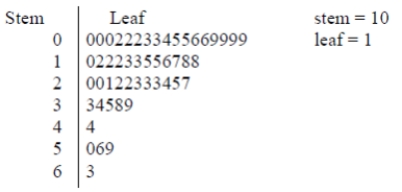 This stem-and-leaf plot shows the lengths of reigns (in years) of the British monarchs.According to the plot, how many British rulers had reigns that lasted less than a full year?
A) 1
B) 3
C) 17
D) Need more information to answer the question
Question
Question
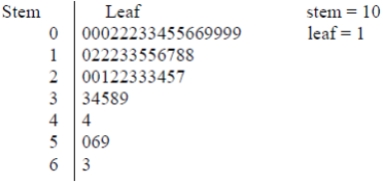 This stem-and-leaf plot shows the lengths of reigns (in years) of the British monarchs.According to the plot, how many British rulers had reigns that lasted 32 years?
A) 0
B) 1
C) 2
D) 3
Question
This table summarizes the responses to a nationwide telephone survey conducted by the Pew Foundation in October 2010.U.S.adults ages 18 and older were asked, "Some people say there is only one true love for each person.Do you agree or disagree?" Some of the table values are purposely missing.What was the frequency of the "Don't Know" responses? 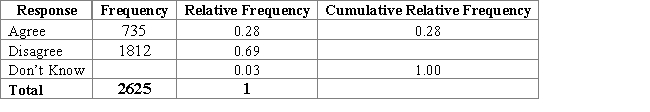
A) 78
B) 787
C) 813
D) Need more information to answer the question
A) 78
B) 787
C) 813
D) Need more information to answer the question
Question
A student counted the number of candies of each color in a bag of 57 Reese's Pieces.The results are shown in the bar graph. 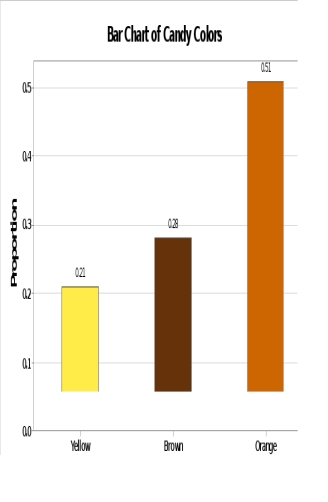 What percentage of the candies were not colored orange?
A) 21%
B) 28%
C) 49%
D) 51%
What percentage of the candies were not colored orange?A) 21%
B) 28%
C) 49%
D) 51%
Question
Question
 This stem-and-leaf plot shows the lengths of reigns (in years) of the British monarchs.The shape of this plot is best described as:
A) symmetric.
B) bimodal.
C) negatively skewed.
D) positively skewed.
Question
Question
Question

Unlock Deck
Sign up to unlock the cards in this deck!
Unlock Deck
Unlock Deck
1/28
Play
Full screen (f)
Deck 3: Tables and Graphs for Summarizing Data
1
The shape of the data set summarized in the stem-and-leaf diagram is best described as:A) symmetric.
B) bimodal.
C) negatively skewed.
D) positively skewed.
positively skewed.
2
The sum of all the relative frequencies of classes up to and including a particular class is defined as the:
A) relative frequency (RF).
B) boundary frequency (BF).
C) cumulative relative frequency (CRF).
D) frequency modulation (FM).
A) relative frequency (RF).
B) boundary frequency (BF).
C) cumulative relative frequency (CRF).
D) frequency modulation (FM).
cumulative relative frequency (CRF).
3
This histogram shows the age at which 548 patients were first diagnosed with diabetes.The shape of this histogram is best described as:A) symmetric.
B) bimodal.
C) monomodal.
D) positively skewed.
bimodal.
4
A distribution with only one peak is called:
A) single peaking.
B) multimodal.
C) bimodal.
D) unimodal.
A) single peaking.
B) multimodal.
C) bimodal.
D) unimodal.
Unlock Deck
Unlock for access to all 28 flashcards in this deck.
Unlock Deck
k this deck
5
To assure prompt service, the city metro routinely records wait times at its various bus stops.The length of time a customer must wait for a bus is recorded to the nearest second.What type of data are these?
A) Qualitative
B) Discrete
C) Continuous
D) Multivariate
A) Qualitative
B) Discrete
C) Continuous
D) Multivariate
Unlock Deck
Unlock for access to all 28 flashcards in this deck.
Unlock Deck
k this deck
6
If there are more than two observations on the same person, the data set is:
A) bivariate.
B) multivariate.
C) random.
D) univariate.
A) bivariate.
B) multivariate.
C) random.
D) univariate.
Unlock Deck
Unlock for access to all 28 flashcards in this deck.
Unlock Deck
k this deck
7
A student counted the number of candies of each color in a bag of 57 Reese's Pieces.The results are shown in the bar graph. How many of the candies were colored orange?
A) 12
B) 51
C) 29
D) More information is needed.
How many of the candies were colored orange?A) 12
B) 51
C) 29
D) More information is needed.
Unlock Deck
Unlock for access to all 28 flashcards in this deck.
Unlock Deck
k this deck
8
Judging from this stem-and-leaf display, the data set appears to be:A) skewed.
B) uniform.
C) symmetric.
D) centered at 100.
Unlock Deck
Unlock for access to all 28 flashcards in this deck.
Unlock Deck
k this deck
9
A student wants to use a curve to represent the number of students in each class over the school day.The student's friend says a bar chart should be used.Who is correct, and why?
A) The student; the curve is a more accurate representation.
B) The friend; the data on class sizes are discrete but a curve implies the data are continuous.
C) Both; either form of the graph gives the same information.
D) Neither; the graph should present the cumulative frequency.
A) The student; the curve is a more accurate representation.
B) The friend; the data on class sizes are discrete but a curve implies the data are continuous.
C) Both; either form of the graph gives the same information.
D) Neither; the graph should present the cumulative frequency.
Unlock Deck
Unlock for access to all 28 flashcards in this deck.
Unlock Deck
k this deck
10
Concerning qualitative data, the ______________ of a particular class is the frequency of the class divided by the total number of observations.
A) relative frequency
B) numeric center
C) frequency
D) None of the above.
A) relative frequency
B) numeric center
C) frequency
D) None of the above.
Unlock Deck
Unlock for access to all 28 flashcards in this deck.
Unlock Deck
k this deck
11
Concerning univariate data, a _____________ or ______________ data set consists of non-numerical observations that may be placed in categories.
A) categorical; qualitative
B) categorical; quantitative
C) numerical; quantitative
D) numerical; qualitative
A) categorical; qualitative
B) categorical; quantitative
C) numerical; quantitative
D) numerical; qualitative
Unlock Deck
Unlock for access to all 28 flashcards in this deck.
Unlock Deck
k this deck
12
A survey records the number of U.S.states each person has visited.This is an example of what type of data?
A) Categorical
B) Continuous
C) Discrete
D) Qualitative
A) Categorical
B) Continuous
C) Discrete
D) Qualitative
Unlock Deck
Unlock for access to all 28 flashcards in this deck.
Unlock Deck
k this deck
13
Concerning qualitative data, the _____________ of a particular class is the count for that class.
A) relative frequency
B) distribution
C) frequency
D) probability
A) relative frequency
B) distribution
C) frequency
D) probability
Unlock Deck
Unlock for access to all 28 flashcards in this deck.
Unlock Deck
k this deck
14
What data value is represented by the bold and underlined "1" in the stem-and-leaf diagram? (Note: It is bold and underlined for emphasis only.)A) 31
B) 30001
C) 3001
D) 1
Unlock Deck
Unlock for access to all 28 flashcards in this deck.
Unlock Deck
k this deck
15
What data value is represented by the bold and underlined "0" in the stem-and-leaf diagram? (Note: It is bold and underlined for emphasis only.)A) 4000
B) 400
C) 40
D) 4
Unlock Deck
Unlock for access to all 28 flashcards in this deck.
Unlock Deck
k this deck
16
A survey records a person's smoking status as either "yes" or "no." This survey is recording what kind of data?
A) Categorical/qualitative
B) Categorical/quantitative
C) Numerical/quantitative
D) Numerical/qualitative
A) Categorical/qualitative
B) Categorical/quantitative
C) Numerical/quantitative
D) Numerical/qualitative
Unlock Deck
Unlock for access to all 28 flashcards in this deck.
Unlock Deck
k this deck
17
Two statistics students are arguing over which type of bar graph to use.One insists that a bar graph that displays the relative frequency will be better for displaying the overall shape of the data.The other holds that only a frequency bar graph will suffice.You happen along and hear their conversation.What advice do you give them?
A) The relative frequency bar graph is superior at displaying the overall shape of the data.
B) The frequency bar graph is superior at displaying the overall shape of the data.
C) A pie chart would be needed here to display the overall shape of the data.
D) Either bar graph would suffice, as they differ only in scale.The shape will be the same.
Unlock Deck
Unlock for access to all 28 flashcards in this deck.
Unlock Deck
k this deck
18
What is the value of the data point represented by the bold and underlined "0" in the stem-and-leaf diagram? (Note: It is bold and underlined for emphasis only.)A) 1
B) 10
C) 100
D) 1000
Unlock Deck
Unlock for access to all 28 flashcards in this deck.
Unlock Deck
k this deck
19
This stem-and-leaf plot shows the lengths of reigns (in years) of the British monarchs.According to the plot, how many British rulers had reigns that lasted less than a full year?A) 1
B) 3
C) 17
D) Need more information to answer the question
Unlock Deck
Unlock for access to all 28 flashcards in this deck.
Unlock Deck
k this deck
20
Relative frequency is best suited to describing __________________ data.
A) continuous
B) quantitative
C) multivariate
D) qualitative
A) continuous
B) quantitative
C) multivariate
D) qualitative
Unlock Deck
Unlock for access to all 28 flashcards in this deck.
Unlock Deck
k this deck
21
This stem-and-leaf plot shows the lengths of reigns (in years) of the British monarchs.According to the plot, how many British rulers had reigns that lasted 32 years?A) 0
B) 1
C) 2
D) 3
Unlock Deck
Unlock for access to all 28 flashcards in this deck.
Unlock Deck
k this deck
22
This table summarizes the responses to a nationwide telephone survey conducted by the Pew Foundation in October 2010.U.S.adults ages 18 and older were asked, "Some people say there is only one true love for each person.Do you agree or disagree?" Some of the table values are purposely missing.What was the frequency of the "Don't Know" responses?
A) 78
B) 787
C) 813
D) Need more information to answer the question
A) 78
B) 787
C) 813
D) Need more information to answer the question
Unlock Deck
Unlock for access to all 28 flashcards in this deck.
Unlock Deck
k this deck
23
A student counted the number of candies of each color in a bag of 57 Reese's Pieces.The results are shown in the bar graph. What percentage of the candies were not colored orange?
A) 21%
B) 28%
C) 49%
D) 51%
What percentage of the candies were not colored orange?A) 21%
B) 28%
C) 49%
D) 51%
Unlock Deck
Unlock for access to all 28 flashcards in this deck.
Unlock Deck
k this deck
24
A numeric data set is __________________ if the set of all possible values is any number within an interval of numbers.
A) continuous
B) discrete
C) qualitative
D) categorical
A) continuous
B) discrete
C) qualitative
D) categorical
Unlock Deck
Unlock for access to all 28 flashcards in this deck.
Unlock Deck
k this deck
25
This stem-and-leaf plot shows the lengths of reigns (in years) of the British monarchs.The shape of this plot is best described as:A) symmetric.
B) bimodal.
C) negatively skewed.
D) positively skewed.
Unlock Deck
Unlock for access to all 28 flashcards in this deck.
Unlock Deck
k this deck
26
A numerical data set is ___________ if the set of all possible values is finite, or countably infinite.
A) quantitative
B) discrete
C) qualitative
D) categorical
A) quantitative
B) discrete
C) qualitative
D) categorical
Unlock Deck
Unlock for access to all 28 flashcards in this deck.
Unlock Deck
k this deck
27
Concerning univariate data, a ______________ or ________________ data set consists of observations that are numbers.
A) categorical; qualitative
B) categorical; quantitative
C) numerical; quantitative
D) numerical; qualitative
A) categorical; qualitative
B) categorical; quantitative
C) numerical; quantitative
D) numerical; qualitative
Unlock Deck
Unlock for access to all 28 flashcards in this deck.
Unlock Deck
k this deck
28
A particular advantage of a stem-and-leaf plot over a histogram or bar chart is that:
A) the stem-and-leaf plot can accommodate large amounts of data.
B) the shape of the stem-and-leaf plot is similar to the bar graph.
C) the actual data values are preserved in the stem-and-leaf plot.
D) the grouping of the data in a stem-and-leaf plot is uniform.
A) the stem-and-leaf plot can accommodate large amounts of data.
B) the shape of the stem-and-leaf plot is similar to the bar graph.
C) the actual data values are preserved in the stem-and-leaf plot.
D) the grouping of the data in a stem-and-leaf plot is uniform.
Unlock Deck
Unlock for access to all 28 flashcards in this deck.
Unlock Deck
k this deck
Unlock Deck
Unlock for access to all 28 flashcards in this deck.


