Deck 11: Confidence Intervals and Hypothesis Tests Based on Two Samples or Treatments
Full screen (f)
Question
Question
Question
Question
Which of the following options would serve as an intuitive estimate of the parameter  ?
?
A)
B)
C)
D)
?A)
B)
C)
D)
Question
If the underlying populations are normally distributed and both population variances are equal, the test statistic 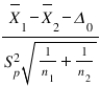
Follows a:
A) standard normal distribution if both samples are large.
B) Student's t distribution with degrees of freedom.
C) standard normal distribution with degrees of freedom.
D) Student's t distribution with degrees of freedom.
Follows a:
A) standard normal distribution if both samples are large.
B) Student's t distribution with
degrees of freedom.C) standard normal distribution with
degrees of freedom.D) Student's t distribution with
degrees of freedom. Question
Question
In developing a confidence interval estimate for the difference between two population means when the population variances are known, a decrease in the difference  will result in:
A) a wider confidence interval.
B) a narrower confidence interval.
C) a smaller z critical value.
D) the same confidence interval of the same width.
will result in:A) a wider confidence interval.
B) a narrower confidence interval.
C) a smaller z critical value.
D) the same confidence interval of the same width.
Question
Question
Question
A psychologist is studying the effect of belly stars on Sneetches.A random sample of four Sneetches is drawn, and a test of self-image is given to each Sneetch before and after having the belly star status changed.(If the Sneetch initially had a star, it was removed; if it did not have a star, one was created on the Sneetch using the patented "Star-off/Star-on" procedure.) From the following sample data, construct a 98% confidence interval on the population mean change in self-image associated with a star status change. 
A) (-26.7977, -4.20232)
B) (-23.4535, -7.5465)
C) (-30.7625, -0.2375)
D) (-37.5519, 6.5519)
A) (-26.7977, -4.20232)
B) (-23.4535, -7.5465)
C) (-30.7625, -0.2375)
D) (-37.5519, 6.5519)
Question
Question
Question
Question
The pooled estimate for the common variance,  is the weighted average of the two sample variances, where the weights are determined by:
A) the sample standard deviations.
B) the sample variances.
C) the sample sizes.
D) the sample means.
is the weighted average of the two sample variances, where the weights are determined by:A) the sample standard deviations.
B) the sample variances.
C) the sample sizes.
D) the sample means.
Question
In 1993, Toyota introduced the Supra sports car, which was designed to have 320 horsepower in stock configuration.A computer chip modification for the fuel injection system was later introduced that was claimed to increase horsepower.To check whether the chip actually does increase horsepower, we sample six stock 1993 Supras and record each vehicle's horsepower (the results appear below). 
Next, technicians install the computer chip in each of the six vehicles' electronic injection systems and then record the horsepower of each (the results appear below).

Find a 95% confidence interval on the population mean horsepower difference associated with the chip modification.
A) (-6.0150, -0.3183)
B) (-5.3384, -0.9949)
C) (-5.3994, -0.9339)
D) (-5.6055, -0.7279)
Next, technicians install the computer chip in each of the six vehicles' electronic injection systems and then record the horsepower of each (the results appear below).
Find a 95% confidence interval on the population mean horsepower difference associated with the chip modification.
A) (-6.0150, -0.3183)
B) (-5.3384, -0.9949)
C) (-5.3994, -0.9339)
D) (-5.6055, -0.7279)
Question
Which of the following options would serve as an intuitive estimate of the parameter  ?
?
A)
B)
C)
D)
?A)
B)
C)
D)
Question
Concerning inference on two independent population means, which of the following assumptions must be met for the pooled variance estimate to be appropriate?
A) Both and
and  .
.
B)
C)
D) Both populations are normally distributed.
A) Both
and .B)
C)
D) Both populations are normally distributed.
Question
The test statistic 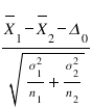
Follows a standard normal distribution if:
A) and the samples are dependent.
B) and the samples are dependent.
C) both and
and  and the samples are dependent.
D) both and
and  and the samples are independent.
Follows a standard normal distribution if:
A)
and the samples are dependent.B)
and the samples are dependent.C) both
and and the samples are dependent.D) both
and and the samples are independent. Question
Question
Concerning inference on two population proportions, it is appropriate to use the pooled or combined estimate of the common population proportion  when:
when:
A) .
.
B) .
.
C) ; that is,
  .
.
D) anytime .
.
when:A)
.B)
.C)
; that is, .D) anytime
. Question
Question
Question
Question
Which of the following options would serve as an intuitive estimate of the parameter  ?
?
A)
B)
C)
D)
?A)
B)
C)
D)
Question
Question
The estimator  is unbiased for the parameter
  .This means that:
A) .
.
B)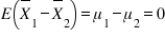 .
.
C) The value will always be the same as the value
  .
.
D)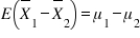 .
.
is unbiased for the parameter .This means that:A)
.B)
.C) The value
will always be the same as the value .D)
. Question
Question
In 1993, Toyota introduced the Supra sports car, which was designed to have 320 horsepower in stock configuration.A computer chip modification for the fuel injection system was later introduced that was claimed to increase horsepower.To check whether the chip actually does increase horsepower, we sample six stock 1993 Supras and record each vehicle's horsepower (the results appear below). 
Next, technicians install the computer chip in each of the six vehicles' electronic injection systems and then record the horsepower of each (the results appear below).

Does it appear that there is an average horsepower increase associated with the chip modification? Select the appropriate critical value (CV), test statistic (TS), and decision.(Use α = 0.05).
A) CV = -2.0150; TS = -2.86; reject H₀
B) CV = 2.0150; TS = -2.86; fail to reject H₀
C) CV = -1.8125; TS = -1.72; fail to reject H₀
D) CV = -2.1318; TS = 2.29; reject H₀
Next, technicians install the computer chip in each of the six vehicles' electronic injection systems and then record the horsepower of each (the results appear below).
Does it appear that there is an average horsepower increase associated with the chip modification? Select the appropriate critical value (CV), test statistic (TS), and decision.(Use α = 0.05).
A) CV = -2.0150; TS = -2.86; reject H₀
B) CV = 2.0150; TS = -2.86; fail to reject H₀
C) CV = -1.8125; TS = -1.72; fail to reject H₀
D) CV = -2.1318; TS = 2.29; reject H₀
Question
A researcher wants to know if students who do not plan to apply for financial aid have more variability on the SAT math test than those who do.Random samples of 25 students who do not plan to apply for aid (sample 1) as well as 30 who do (sample 2) are summarized below: 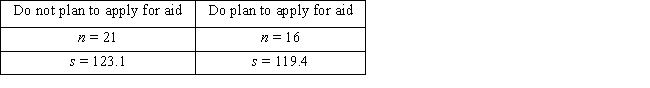
Does it appear that students who do not plan to apply for financial aid are less consistent on the SAT math test than those who do plan to apply for aid? Select the appropriate critical value (CV), test statistic (TS), and decision and state the alternative hypothesis.(Use α = 0.01).
A) CV = 3.37; TS = 1.0310; fail to reject H₀; states that students who do not apply for aid have scores that vary just as much as those who do apply for aid.
B) CV = 3.37; TS = 1.0629; fail to reject H₀; states that students who do not apply for aid have more variable scores than those who do apply for aid.
C) CV = 0.2967; TS = 1.0310; reject H₀; states that students who do not apply for aid have scores that vary just as much as those who do apply for aid.
D) CV = -3.26; TS = -1.0154; reject H₀; states that students who do not apply for aid have scores that vary just as much as those who do apply for aid.
Does it appear that students who do not plan to apply for financial aid are less consistent on the SAT math test than those who do plan to apply for aid? Select the appropriate critical value (CV), test statistic (TS), and decision and state the alternative hypothesis.(Use α = 0.01).
A) CV = 3.37; TS = 1.0310; fail to reject H₀;
states that students who do not apply for aid have scores that vary just as much as those who do apply for aid.B) CV = 3.37; TS = 1.0629; fail to reject H₀;
states that students who do not apply for aid have more variable scores than those who do apply for aid.C) CV = 0.2967; TS = 1.0310; reject H₀;
states that students who do not apply for aid have scores that vary just as much as those who do apply for aid.D) CV = -3.26; TS = -1.0154; reject H₀;
states that students who do not apply for aid have scores that vary just as much as those who do apply for aid. Question
Concerning inference on two independent population means, the pooled variance estimate is:
A) a way of estimating variance that relies on the information provided by only one of the samples.
B) an unbiased estimator of the parameter .
.
C) a combined (using a weighted average) estimate for the unknown variance of two populations.
D) a less efficient but easier way of estimating population variances as compared to using two separate variance estimates (one for each population).
A) a way of estimating variance that relies on the information provided by only one of the samples.
B) an unbiased estimator of the parameter
.C) a combined (using a weighted average) estimate for the unknown variance of two populations.
D) a less efficient but easier way of estimating population variances as compared to using two separate variance estimates (one for each population).
Question
Question
Question
Concerning the statement of the null hypothesis, 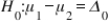 ,
,  is always:
A) equal to 0.
B) greater than 0.
C) less than 0.
D) some fixed real number.
, is always:A) equal to 0.
B) greater than 0.
C) less than 0.
D) some fixed real number.
Question
Question
Question
The relationship  may be equivalently expressed as:
A) .
.
B) .
.
C) .
.
D) .
.
may be equivalently expressed as:A)
.B)
.C)
.D)
. Question
The symbol  refers to:
A) the mean difference in the pairs of observations taken from two dependent samples.
B) the mean difference in the pairs of observations taken from two independent samples.
C) the difference in the means of two dependent samples.
D) the difference in the means of two independent samples.
refers to:A) the mean difference in the pairs of observations taken from two dependent samples.
B) the mean difference in the pairs of observations taken from two independent samples.
C) the difference in the means of two dependent samples.
D) the difference in the means of two independent samples.
Question
Question
Hypothesis testing on two means from dependent samples cannot be conducted using the same methods appropriate for independent sample analysis.The main reason for this is because:
A) there is no unbiased estimator that can be calculated from dependent samples.
B) the variance of must account for the dependence.
C) the power of the estimation equation is no longer defined.
D) sample averages can be calculated only from independent samples.
A) there is no unbiased estimator that can be calculated from dependent samples.
B) the variance of
must account for the dependence.C) the power of the estimation equation is no longer defined.
D) sample averages can be calculated only from independent samples.
Question
Question
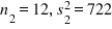
Construct a 98% confidence interval on the ratio of population variances based on the following samples from two normally distributed populations. 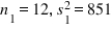
A) (0.2585, 4.4790)
B) (0.3102, 4.4790)
C) (0.2643, 5.2569)
D) (0.2585, 5.3747)
A) (0.2585, 4.4790)
B) (0.3102, 4.4790)
C) (0.2643, 5.2569)
D) (0.2585, 5.3747)
Question
Question
A psychologist is studying the effect of belly stars on Sneetches.A random sample of four Sneetches is drawn, and a test of self-image is given to each Sneetch before and after having the belly star status changed.(If the Sneetch initially had a star, it was removed; if it did not have a star, one was created on the Sneetch using the patented "Star-off/Star-on" procedure.) From the following sample data, does it appear that changing belly star status increases the average self-image of Sneetches? Select the appropriate critical value (CV), test statistic (TS), and decision.(Use α = 0.10). 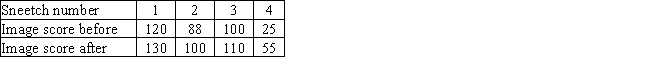
A) CV = -1.6377; TS = -3.19; reject H₀
B) CV = -4.5407; TS = -6.38; reject H₀
C) CV = -1.3968; TS = -15.50; reject H₀
D) CV = -2.8965; TS = -6.38; fail to reject H₀
A) CV = -1.6377; TS = -3.19; reject H₀
B) CV = -4.5407; TS = -6.38; reject H₀
C) CV = -1.3968; TS = -15.50; reject H₀
D) CV = -2.8965; TS = -6.38; fail to reject H₀
Question
Question

Unlock Deck
Sign up to unlock the cards in this deck!
Unlock Deck
Unlock Deck
1/45
Play
Full screen (f)
Deck 11: Confidence Intervals and Hypothesis Tests Based on Two Samples or Treatments
1
Two hospitals share responsibility for a very poor area of a major city.Both are required to treat patients regardless of their ability to pay.Hospital 1 claims that its emergency room (ER) treats a higher percentage of nonpaying patients than does hospital 2.In a random sample of 200 ER cases from hospital 1, 122 were unable to pay.An independent sample of 180 ER cases from hospital 2 has 108 that were unable to pay.Construct a 99% confidence interval for the population difference in the proportions of nonpaying patients.
A) (-0.1194, -0.1394)
B) (-0.1068, -0.1268)
C) (-0.0884, 0.1084)
D) (-0.1553, 0.1753)
A) (-0.1194, -0.1394)
B) (-0.1068, -0.1268)
C) (-0.0884, 0.1084)
D) (-0.1553, 0.1753)
(-0.1194, -0.1394)
2
To study the effect of soothing music on a person's blood pressure, two random groups of 220 adults were drawn.One group (sample 1) listened to soothing music for 5 min prior to having their blood pressure taken, while the other group (sample 2) sat in silence.From previous studies, it was found that both populations have a standard deviation of 39.18.The average systolic blood pressure from the music group was 114.5.The average systolic blood pressure from the silence group was 122.8.Does the experiment support the conclusion that soothing music significantly lowers average systolic blood pressure better than silence? Select the correct p-value and decision and state the null hypothesis.Use α = 0.01.
A) p-value = 0.0264; fail to reject H₀; The null hypothesis is that there is no significant difference between the two groups.
B) p-value = 0.0264; reject H₀; The null hypothesis is that is a significant difference between the two groups.
C) p-value = 0.0132; fail to reject H₀; The null hypothesis is that there is no significant difference between the two groups.
D) p-value = 0.9736; fail to reject H₀; The null hypothesis is that there is a significant difference between the two groups.
p-value = 0.0132; fail to reject H₀; The null hypothesis is that there is no significant difference between the two groups.
3
The sampling distribution of the ratio of two sample variances is said to follow an F distribution provided that:
A) the samples are independently drawn from two normal populations.
B) the populations are normal with equal variances.
C) the samples are independent.
D) the samples are independent and the sample sizes are large.
A) the samples are independently drawn from two normal populations.
B) the populations are normal with equal variances.
C) the samples are independent.
D) the samples are independent and the sample sizes are large.
the samples are independently drawn from two normal populations.
4
Which of the following options would serve as an intuitive estimate of the parameter ?
A)
B)
C)
D)
?A)
B)
C)
D)
Unlock Deck
Unlock for access to all 45 flashcards in this deck.
Unlock Deck
k this deck
5
If the underlying populations are normally distributed and both population variances are equal, the test statistic
Follows a:
A) standard normal distribution if both samples are large.
B) Student's t distribution with degrees of freedom.
C) standard normal distribution with degrees of freedom.
D) Student's t distribution with degrees of freedom.
Follows a:
A) standard normal distribution if both samples are large.
B) Student's t distribution with
degrees of freedom.C) standard normal distribution with
degrees of freedom.D) Student's t distribution with
degrees of freedom. Unlock Deck
Unlock for access to all 45 flashcards in this deck.
Unlock Deck
k this deck
6
Which of the following is NOT a property of the F distribution?
A) F distributions are nonsymmetrical.
B) F can assume only positive values.
C) F distributions have n - 1 degrees of freedom.
D) There are many F distributions and each has a different shape.
A) F distributions are nonsymmetrical.
B) F can assume only positive values.
C) F distributions have n - 1 degrees of freedom.
D) There are many F distributions and each has a different shape.
Unlock Deck
Unlock for access to all 45 flashcards in this deck.
Unlock Deck
k this deck
7
In developing a confidence interval estimate for the difference between two population means when the population variances are known, a decrease in the difference will result in:
A) a wider confidence interval.
B) a narrower confidence interval.
C) a smaller z critical value.
D) the same confidence interval of the same width.
will result in:A) a wider confidence interval.
B) a narrower confidence interval.
C) a smaller z critical value.
D) the same confidence interval of the same width.
Unlock Deck
Unlock for access to all 45 flashcards in this deck.
Unlock Deck
k this deck
8
A recent survey of pet owners found that 53% of 100 randomly selected cat owners (population 1) and 63% of 100 independently, randomly selected dog owners (population 2) said they would perform cardiopulmonary resuscitation (CPR) on their pets in the event of a medical emergency.Determine a 95% confidence interval for the difference in the population proportion of pet owners who would provide CPR on their pet in the event of an emergency.
A) (-0.2361, 0.0361)
B) (-0.1430, -0.0570)
C) (-0.0142, 0.2142)
D) (-0.2789, 0.0789)
A) (-0.2361, 0.0361)
B) (-0.1430, -0.0570)
C) (-0.0142, 0.2142)
D) (-0.2789, 0.0789)
Unlock Deck
Unlock for access to all 45 flashcards in this deck.
Unlock Deck
k this deck
9
College admissions administrators at a university are reevaluating their entrance requirements.They believe that the mean GPA for graduating high school seniors has increased dramatically over the last decade.They randomly sample 85 records of graduating seniors from 10 years ago (sample 1) and find an average GPA of 2.68.An independent random sample of 80 current graduating seniors yields an average GPA of 2.94.If the population variance of high school GPAs is 0.2601, find a 95% confidence interval for the difference in population mean GPA over the last decade.
A) (-0.42, -0.10)
B) (-0.29, -0.13)
C) (-0.36, -0.16)
D) (-0.46, -0.05)
A) (-0.42, -0.10)
B) (-0.29, -0.13)
C) (-0.36, -0.16)
D) (-0.46, -0.05)
Unlock Deck
Unlock for access to all 45 flashcards in this deck.
Unlock Deck
k this deck
10
A psychologist is studying the effect of belly stars on Sneetches.A random sample of four Sneetches is drawn, and a test of self-image is given to each Sneetch before and after having the belly star status changed.(If the Sneetch initially had a star, it was removed; if it did not have a star, one was created on the Sneetch using the patented "Star-off/Star-on" procedure.) From the following sample data, construct a 98% confidence interval on the population mean change in self-image associated with a star status change.
A) (-26.7977, -4.20232)
B) (-23.4535, -7.5465)
C) (-30.7625, -0.2375)
D) (-37.5519, 6.5519)
A) (-26.7977, -4.20232)
B) (-23.4535, -7.5465)
C) (-30.7625, -0.2375)
D) (-37.5519, 6.5519)
Unlock Deck
Unlock for access to all 45 flashcards in this deck.
Unlock Deck
k this deck
11
In developing a confidence interval estimate for the difference between two population means when the population variances are known, an increase in the size of the samples will result in:
A) a wider confidence interval.
B) a narrower confidence interval.
C) a smaller z critical value.
D) the same confidence interval.
A) a wider confidence interval.
B) a narrower confidence interval.
C) a smaller z critical value.
D) the same confidence interval.
Unlock Deck
Unlock for access to all 45 flashcards in this deck.
Unlock Deck
k this deck
12
If the process of selecting individuals or objects in sample 1 has no effect on, or no relation to, the selection of individuals or objects in sample 2, the samples are:
A) independent.
B) dependent.
C) discrete.
D) paired.
A) independent.
B) dependent.
C) discrete.
D) paired.
Unlock Deck
Unlock for access to all 45 flashcards in this deck.
Unlock Deck
k this deck
13
Two cosmetics manufacturers produce similar hairspray products.Manufacturer 1 asserts that its hairspray holds longer, on average, than does its competitor's product.To test the claim, we randomly sample 20 hairspray users and have half of them use brand 1 hairspray while the other half use brand 2.The average hold time for brand 1 is 18.5 hr with a standard deviation of 6.28 hr.The average hold time for brand 2 is 17.95 hr with a standard deviation of 8.55 hr.Does the sample support manufacturer 1's assertion? Assume that the populations in question are both normal and have unequal variances.Select the appropriate critical value (CV), test statistic (TS), decision and conclusion.(Use α = 0.10).
A) CV = 1.3368; TS = 0.16; reject H₀; Conclusion: There exists a statistically significant difference in hold.
B) CV = 1.3304; TS = -0.23; fail to reject H₀; Conclusion: There is no statistically significant difference in hold.
C) CV = -2.5835; TS = 0.23; reject H₀; Conclusion: There exists a statistically significant difference in hold.
D) CV = 1.3368; TS = 0.16; fail to reject H₀; Conclusion: There is no statistically significant difference in hold.
Unlock Deck
Unlock for access to all 45 flashcards in this deck.
Unlock Deck
k this deck
14
The pooled estimate for the common variance, is the weighted average of the two sample variances, where the weights are determined by:
A) the sample standard deviations.
B) the sample variances.
C) the sample sizes.
D) the sample means.
is the weighted average of the two sample variances, where the weights are determined by:A) the sample standard deviations.
B) the sample variances.
C) the sample sizes.
D) the sample means.
Unlock Deck
Unlock for access to all 45 flashcards in this deck.
Unlock Deck
k this deck
15
In 1993, Toyota introduced the Supra sports car, which was designed to have 320 horsepower in stock configuration.A computer chip modification for the fuel injection system was later introduced that was claimed to increase horsepower.To check whether the chip actually does increase horsepower, we sample six stock 1993 Supras and record each vehicle's horsepower (the results appear below).
Next, technicians install the computer chip in each of the six vehicles' electronic injection systems and then record the horsepower of each (the results appear below).
Find a 95% confidence interval on the population mean horsepower difference associated with the chip modification.
A) (-6.0150, -0.3183)
B) (-5.3384, -0.9949)
C) (-5.3994, -0.9339)
D) (-5.6055, -0.7279)
Unlock Deck
Unlock for access to all 45 flashcards in this deck.
Unlock Deck
k this deck
16
Which of the following options would serve as an intuitive estimate of the parameter ?
A)
B)
C)
D)
?A)
B)
C)
D)
Unlock Deck
Unlock for access to all 45 flashcards in this deck.
Unlock Deck
k this deck
17
Concerning inference on two independent population means, which of the following assumptions must be met for the pooled variance estimate to be appropriate?
A) Both and .
B)
C)
D) Both populations are normally distributed.
A) Both
and .B)
C)
D) Both populations are normally distributed.
Unlock Deck
Unlock for access to all 45 flashcards in this deck.
Unlock Deck
k this deck
18
The test statistic
Follows a standard normal distribution if:
A) and the samples are dependent.
B) and the samples are dependent.
C) both and and the samples are dependent.
D) both and and the samples are independent.
Follows a standard normal distribution if:
A)
and the samples are dependent.B)
and the samples are dependent.C) both
and and the samples are dependent.D) both
and and the samples are independent. Unlock Deck
Unlock for access to all 45 flashcards in this deck.
Unlock Deck
k this deck
19
If you wish to estimate the difference between two population means and the population variances are known, a 99% confidence interval estimate can be found by using which of the following critical values?
A) 1.615
B) 1.96
C) 2.33
D) 2.575
A) 1.615
B) 1.96
C) 2.33
D) 2.575
Unlock Deck
Unlock for access to all 45 flashcards in this deck.
Unlock Deck
k this deck
20
Concerning inference on two population proportions, it is appropriate to use the pooled or combined estimate of the common population proportion when:
A) .
B) .
C) ; that is, .
D) anytime .
when:A)
.B)
.C)
; that is, .D) anytime
. Unlock Deck
Unlock for access to all 45 flashcards in this deck.
Unlock Deck
k this deck
21
A t test for paired data assumes that:
A) the sample variances are equal.
B) the sample means are different.
C) the populations are approximately normally distributed.
D) None of the above.
A) the sample variances are equal.
B) the sample means are different.
C) the populations are approximately normally distributed.
D) None of the above.
Unlock Deck
Unlock for access to all 45 flashcards in this deck.
Unlock Deck
k this deck
22
If two samples are combined by matching each individual or object in sample 1 with a similar object/individual in sample 2, the resulting single sample is:
A) an independent sample.
B) a paired data set.
C) a combinatorial data set.
D) a qualitative data set.
A) an independent sample.
B) a paired data set.
C) a combinatorial data set.
D) a qualitative data set.
Unlock Deck
Unlock for access to all 45 flashcards in this deck.
Unlock Deck
k this deck
23
Suppose two samples of sizes 25 and 35, respectively, are independently drawn from two populations that are both normally distributed.Also assume the population variances are unknown but equal.What is the number of degrees of freedom that the t test statistic would have?
A) 34
B) 58
C) 59
D) 60
A) 34
B) 58
C) 59
D) 60
Unlock Deck
Unlock for access to all 45 flashcards in this deck.
Unlock Deck
k this deck
24
Which of the following options would serve as an intuitive estimate of the parameter ?
A)
B)
C)
D)
?A)
B)
C)
D)
Unlock Deck
Unlock for access to all 45 flashcards in this deck.
Unlock Deck
k this deck
25
College admissions administrators at a university are reevaluating their entrance requirements.They believe that the mean GPA for graduating high school seniors has increased dramatically over the last decade.They randomly sample 85 records of graduating seniors from 10 years ago (sample 1) and find an average GPA of 2.68.An independent random sample of 80 current graduating seniors yields an average GPA of 2.94.If the population variance of high school GPAs is 0.2601, does it appear that there was an increase in mean GPA over the last decade? Select the correct p-value and decision below.Use α = 0.01.Also, state H₀.
A) p-value = 0.0005; fail to reject H₀; The null hypothesis is that GPA remained the same.
B) p-value = 0.0010; fail to reject H₀; The null hypothesis is that GPA remained the same.
C) p-value = 0.0005; reject H₀; The null hypothesis is that GPA remained the same.
D) p-value = 0.0010; reject H₀; The null hypothesis is that GPA changed over time.
Unlock Deck
Unlock for access to all 45 flashcards in this deck.
Unlock Deck
k this deck
26
The estimator is unbiased for the parameter .This means that:
A) .
B) .
C) The value will always be the same as the value .
D) .
is unbiased for the parameter .This means that:A)
.B)
.C) The value
will always be the same as the value .D)
. Unlock Deck
Unlock for access to all 45 flashcards in this deck.
Unlock Deck
k this deck
27
Two methods for precisely estimating the weights of very large objects are being evaluated for consistency.From 9 measurements using method 1, there is a variance of 1.023; from 14 measurements using method 2, there is a variance of 0.095.Does method 1 appear to have more variability than method 2? Select the appropriate critical value (CV), test statistic (TS), and decision and state the null hypothesis.(Use α = 0.05).
A) CV = 5.049; TS = 10.7684; reject H₀: The difference between methods is not statistically significant.
B) CV = 6.287; TS = 115.9589; reject H₀: The difference between methods is not statistically significant.
C) CV = 5.049; TS = 10.7684; fail to reject H₀: The difference between methods is statistically significant.
D) CV = -6.287; TS = 115.9589; reject H₀: The difference between methods is statistically significant.
Unlock Deck
Unlock for access to all 45 flashcards in this deck.
Unlock Deck
k this deck
28
In 1993, Toyota introduced the Supra sports car, which was designed to have 320 horsepower in stock configuration.A computer chip modification for the fuel injection system was later introduced that was claimed to increase horsepower.To check whether the chip actually does increase horsepower, we sample six stock 1993 Supras and record each vehicle's horsepower (the results appear below).
Next, technicians install the computer chip in each of the six vehicles' electronic injection systems and then record the horsepower of each (the results appear below).
Does it appear that there is an average horsepower increase associated with the chip modification? Select the appropriate critical value (CV), test statistic (TS), and decision.(Use α = 0.05).
A) CV = -2.0150; TS = -2.86; reject H₀
B) CV = 2.0150; TS = -2.86; fail to reject H₀
C) CV = -1.8125; TS = -1.72; fail to reject H₀
D) CV = -2.1318; TS = 2.29; reject H₀
Unlock Deck
Unlock for access to all 45 flashcards in this deck.
Unlock Deck
k this deck
29
A researcher wants to know if students who do not plan to apply for financial aid have more variability on the SAT math test than those who do.Random samples of 25 students who do not plan to apply for aid (sample 1) as well as 30 who do (sample 2) are summarized below:
Does it appear that students who do not plan to apply for financial aid are less consistent on the SAT math test than those who do plan to apply for aid? Select the appropriate critical value (CV), test statistic (TS), and decision and state the alternative hypothesis.(Use α = 0.01).
A) CV = 3.37; TS = 1.0310; fail to reject H₀; states that students who do not apply for aid have scores that vary just as much as those who do apply for aid.
B) CV = 3.37; TS = 1.0629; fail to reject H₀; states that students who do not apply for aid have more variable scores than those who do apply for aid.
C) CV = 0.2967; TS = 1.0310; reject H₀; states that students who do not apply for aid have scores that vary just as much as those who do apply for aid.
D) CV = -3.26; TS = -1.0154; reject H₀; states that students who do not apply for aid have scores that vary just as much as those who do apply for aid.
Does it appear that students who do not plan to apply for financial aid are less consistent on the SAT math test than those who do plan to apply for aid? Select the appropriate critical value (CV), test statistic (TS), and decision and state the alternative hypothesis.(Use α = 0.01).
A) CV = 3.37; TS = 1.0310; fail to reject H₀;
states that students who do not apply for aid have scores that vary just as much as those who do apply for aid.B) CV = 3.37; TS = 1.0629; fail to reject H₀;
states that students who do not apply for aid have more variable scores than those who do apply for aid.C) CV = 0.2967; TS = 1.0310; reject H₀;
states that students who do not apply for aid have scores that vary just as much as those who do apply for aid.D) CV = -3.26; TS = -1.0154; reject H₀;
states that students who do not apply for aid have scores that vary just as much as those who do apply for aid. Unlock Deck
Unlock for access to all 45 flashcards in this deck.
Unlock Deck
k this deck
30
Concerning inference on two independent population means, the pooled variance estimate is:
A) a way of estimating variance that relies on the information provided by only one of the samples.
B) an unbiased estimator of the parameter .
C) a combined (using a weighted average) estimate for the unknown variance of two populations.
D) a less efficient but easier way of estimating population variances as compared to using two separate variance estimates (one for each population).
A) a way of estimating variance that relies on the information provided by only one of the samples.
B) an unbiased estimator of the parameter
.C) a combined (using a weighted average) estimate for the unknown variance of two populations.
D) a less efficient but easier way of estimating population variances as compared to using two separate variance estimates (one for each population).
Unlock Deck
Unlock for access to all 45 flashcards in this deck.
Unlock Deck
k this deck
31
Which of the following is NOT a required assumption for constructing a confidence interval to estimate the difference between two population means when the sample sizes are small (less than 30)?
A) The samples are randomly selected from the population.
B) The population variances are equal to 1.
C) The population variances are equal.
D) The two populations are normally distributed.
A) The samples are randomly selected from the population.
B) The population variances are equal to 1.
C) The population variances are equal.
D) The two populations are normally distributed.
Unlock Deck
Unlock for access to all 45 flashcards in this deck.
Unlock Deck
k this deck
32
A small town claims that it needs rezoning to accommodate its current growth.The town wants to re-designate a current residential area as commercial.To gain approval from the zoning commission, it must show that the commercial taxes paid in this area are significantly higher, on average, than those paid in other residentially zoned areas.A random sample of 16 dwellings in standard residential areas (sample 1) yields an average commercial tax of $25,000 with a standard deviation of $11,000.A sample of 15 dwellings in the "rezoned" area (sample 2) has an average commercial tax of $55,800 with a standard deviation of $2500.Assume that the populations in question are both normal and have unequal variance.Construct a 90% confidence interval on the population mean difference in commercial taxes between the two areas.
A) (-35,882.27, -26,011.70)
B) (-35,588.26, -26,011.70)
C) (-38,320.51, -23,279.50)
D) (-35,746.04, -25,854.00)
A) (-35,882.27, -26,011.70)
B) (-35,588.26, -26,011.70)
C) (-38,320.51, -23,279.50)
D) (-35,746.04, -25,854.00)
Unlock Deck
Unlock for access to all 45 flashcards in this deck.
Unlock Deck
k this deck
33
Concerning the statement of the null hypothesis, , is always:
A) equal to 0.
B) greater than 0.
C) less than 0.
D) some fixed real number.
, is always:A) equal to 0.
B) greater than 0.
C) less than 0.
D) some fixed real number.
Unlock Deck
Unlock for access to all 45 flashcards in this deck.
Unlock Deck
k this deck
34
We wish to conduct a test of hypothesis on two independent population means.The objective of the test is to determine if the means are the same or if they differ.Both populations are assumed to be normal with equal variance.We draw 10 observations for the first sample and 20 observations for the second sample.What would be the appropriate critical value for the test if α = 0.01?
A) 1.3125
B) 2.7633
C) 2.4573
D) 2.4620
A) 1.3125
B) 2.7633
C) 2.4573
D) 2.4620
Unlock Deck
Unlock for access to all 45 flashcards in this deck.
Unlock Deck
k this deck
35
Which of the following statements is true about the F distribution?
A) F0.05, 10, 20 = 1/F0.95, 10, 20
B) F0.05, 10, 20 = 1/F0.05, 20, 10
C) F0.05, 10, 20 = 1/F0.95, 20, 10
D) F0.95, 10,20 = 1/F0.95, 10, 20
A) F0.05, 10, 20 = 1/F0.95, 10, 20
B) F0.05, 10, 20 = 1/F0.05, 20, 10
C) F0.05, 10, 20 = 1/F0.95, 20, 10
D) F0.95, 10,20 = 1/F0.95, 10, 20
Unlock Deck
Unlock for access to all 45 flashcards in this deck.
Unlock Deck
k this deck
36
The relationship may be equivalently expressed as:
A) .
B) .
C) .
D) .
may be equivalently expressed as:A)
.B)
.C)
.D)
. Unlock Deck
Unlock for access to all 45 flashcards in this deck.
Unlock Deck
k this deck
37
The symbol refers to:
A) the mean difference in the pairs of observations taken from two dependent samples.
B) the mean difference in the pairs of observations taken from two independent samples.
C) the difference in the means of two dependent samples.
D) the difference in the means of two independent samples.
refers to:A) the mean difference in the pairs of observations taken from two dependent samples.
B) the mean difference in the pairs of observations taken from two independent samples.
C) the difference in the means of two dependent samples.
D) the difference in the means of two independent samples.
Unlock Deck
Unlock for access to all 45 flashcards in this deck.
Unlock Deck
k this deck
38
When you are testing whether two population means of two normally distributed populations differ and the population variances are both unknown but unequal, the t test statistics will usually have a non-integer number of degrees of freedom v.In this case, you should:
A) round down to the previous integer.
B) round up to the next integer.
C) assume that the population variances are equal and use v = n1 + n2 - 2.
D) change the sample sizes until the number of degrees of freedom is an integer.
A) round down to the previous integer.
B) round up to the next integer.
C) assume that the population variances are equal and use v = n1 + n2 - 2.
D) change the sample sizes until the number of degrees of freedom is an integer.
Unlock Deck
Unlock for access to all 45 flashcards in this deck.
Unlock Deck
k this deck
39
Hypothesis testing on two means from dependent samples cannot be conducted using the same methods appropriate for independent sample analysis.The main reason for this is because:
A) there is no unbiased estimator that can be calculated from dependent samples.
B) the variance of must account for the dependence.
C) the power of the estimation equation is no longer defined.
D) sample averages can be calculated only from independent samples.
A) there is no unbiased estimator that can be calculated from dependent samples.
B) the variance of
must account for the dependence.C) the power of the estimation equation is no longer defined.
D) sample averages can be calculated only from independent samples.
Unlock Deck
Unlock for access to all 45 flashcards in this deck.
Unlock Deck
k this deck
40
Suppose you want to use a paired t test to determine if the population means of before-and-after measurements are different, and you plan to use samples of size 45.What number of degrees of freedom should you use?
A) 90
B) 89
C) 45
D) 44
A) 90
B) 89
C) 45
D) 44
Unlock Deck
Unlock for access to all 45 flashcards in this deck.
Unlock Deck
k this deck
41
Construct a 98% confidence interval on the ratio of population variances based on the following samples from two normally distributed populations.
A) (0.2585, 4.4790)
B) (0.3102, 4.4790)
C) (0.2643, 5.2569)
D) (0.2585, 5.3747)
A) (0.2585, 4.4790)
B) (0.3102, 4.4790)
C) (0.2643, 5.2569)
D) (0.2585, 5.3747)
Unlock Deck
Unlock for access to all 45 flashcards in this deck.
Unlock Deck
k this deck
42
If you wish to test whether two population means are equal using a two-sample t test with a pooled estimate of the common variance, which of the following assumptions is NOT true?
A) The population variances should be equal or nearly equal.
B) The two samples must be independent of each other.
C) The two samples sizes are small and the samples must be randomly selected from the populations.
D) The populations from which the samples are drawn must be t distributed.
A) The population variances should be equal or nearly equal.
B) The two samples must be independent of each other.
C) The two samples sizes are small and the samples must be randomly selected from the populations.
D) The populations from which the samples are drawn must be t distributed.
Unlock Deck
Unlock for access to all 45 flashcards in this deck.
Unlock Deck
k this deck
43
A psychologist is studying the effect of belly stars on Sneetches.A random sample of four Sneetches is drawn, and a test of self-image is given to each Sneetch before and after having the belly star status changed.(If the Sneetch initially had a star, it was removed; if it did not have a star, one was created on the Sneetch using the patented "Star-off/Star-on" procedure.) From the following sample data, does it appear that changing belly star status increases the average self-image of Sneetches? Select the appropriate critical value (CV), test statistic (TS), and decision.(Use α = 0.10).
A) CV = -1.6377; TS = -3.19; reject H₀
B) CV = -4.5407; TS = -6.38; reject H₀
C) CV = -1.3968; TS = -15.50; reject H₀
D) CV = -2.8965; TS = -6.38; fail to reject H₀
A) CV = -1.6377; TS = -3.19; reject H₀
B) CV = -4.5407; TS = -6.38; reject H₀
C) CV = -1.3968; TS = -15.50; reject H₀
D) CV = -2.8965; TS = -6.38; fail to reject H₀
Unlock Deck
Unlock for access to all 45 flashcards in this deck.
Unlock Deck
k this deck
44
At the end of a 52-week study to determine how to help smokers quit, subjects were randomly placed into a nicotine lozenge group or a placebo group.To determine if the randomization was effective, the proportion of males in each group was obtained.The researchers found that 42.9% of the 459 subjects given the nicotine lozenge were males, and 40.2% of the 458 subjects given the placebo were males.Determine the p-value and test decision for determining if the proportion of males in the two groups differed.Use α = 0.05.
A) p-value = 0.601; fail to reject H₀
B) p-value = 0.040; reject H₀
C) p-value = 0.399; reject H₀
D) p-value = 0.399; fail to reject H₀
A) p-value = 0.601; fail to reject H₀
B) p-value = 0.040; reject H₀
C) p-value = 0.399; reject H₀
D) p-value = 0.399; fail to reject H₀
Unlock Deck
Unlock for access to all 45 flashcards in this deck.
Unlock Deck
k this deck
45
To study the effect of soothing music on a person's blood pressure, two random samples of 220 adults were taken.One sample (sample 1) listened to soothing music for 5 min prior to having their blood pressure taken, while the other sample (sample 2) sat in silence.From previous studies, it was found that both populations have a standard deviation of 39.18.The average systolic blood pressure from the music sample was 114.5.The average systolic blood pressure from the silent sample was 122.8.Construct a 98% confidence interval on the difference in population mean blood pressures (music - silent).
A) (-14.4448, -2.1552)
B) (-17.9223, 1.3222)
C) (-16.9903, 0.3903
D) (-15.6219, -0.9781)
A) (-14.4448, -2.1552)
B) (-17.9223, 1.3222)
C) (-16.9903, 0.3903
D) (-15.6219, -0.9781)
Unlock Deck
Unlock for access to all 45 flashcards in this deck.
Unlock Deck
k this deck
Unlock Deck
Unlock for access to all 45 flashcards in this deck.


