Deck 4: Numerical Summary Measures
Full screen (f)
Question
Calculate  for the following sample data set:
A) 11.63
B) 15.1
C) 15.5
D) 9
for the following sample data set: A) 11.63
B) 15.1
C) 15.5
D) 9
Question
Question
The following is an abbreviated list of scores from a recent exam.Which exam score is the 15th percentile? 
A) 98
B) 28
C) 51
D) 56
A) 98
B) 28
C) 51
D) 56
Question
Question
Calculate s2 for the following sample data set: 
A) 4.57
B) 2.14
C) 4.17
D) 5
A) 4.57
B) 2.14
C) 4.17
D) 5
Question
A personnel manager believes that a particular employee produces more defective parts than his peers.The manager records the worker's production over the course of several weeks.Out of 315 parts produced, 11 are defective.Calculate  (the sample proportion) if we define a defective part as a "success."
A) 0.035
B) 11
C) 28.64
D) Need more information
(the sample proportion) if we define a defective part as a "success."A) 0.035
B) 11
C) 28.64
D) Need more information
Question
Question
Question
Marine was a black Labrador retriever that was trained to detect colorectal cancer by smelling the breath of patients with cancer.In one test to determine how well this dog could detect colorectal cancer, Marine correctly identified a bag containing the breath of a patient with colorectal cancer (from about five bags, with four containing the breath of healthy subjects) in 30 out of 33 trials.What is  (the sample proportion) in this situation?
A) 30
B) 33
C) 0.91
D) 0.33
(the sample proportion) in this situation?A) 30
B) 33
C) 0.91
D) 0.33
Question
The lengths of the reigns of 50 British monarchs (in years) are summarized with the following five-number summary:
Xmin = 0, Q1 = 6, = 15.5, Q3 = 24, xmax = 63,
  = 18.92 = 18.92
Based on the five-number summary, the overall shape of the lengths of these reigns appears to be:
A) right-skewed.
B) symmetric.
C) left-skewed.
D) Data shape can be discerned only from visual methods.
Xmin = 0, Q1 = 6,
= 15.5, Q3 = 24, xmax = 63, = 18.92 = 18.92
Based on the five-number summary, the overall shape of the lengths of these reigns appears to be:
A) right-skewed.
B) symmetric.
C) left-skewed.
D) Data shape can be discerned only from visual methods.
Question
Question
The symbol  represents the:
A) population mean.
B) sample mean.
C) geometric mean.
D) sample median.
represents the:A) population mean.
B) sample mean.
C) geometric mean.
D) sample median.
Question
Calculate  for the following sample data set:
A) 5
B) 11.5
C) 9
D) 15.1
for the following sample data set: A) 5
B) 11.5
C) 9
D) 15.1
Question
Question
Question
Question
Question
Question
Question
Question
Question
Question
If  , then:
A) the sample is negatively skewed.
B) the population must be negatively skewed.
C) the sample is positively skewed.
D) the population must be positively skewed.
, then:A) the sample is negatively skewed.
B) the population must be negatively skewed.
C) the sample is positively skewed.
D) the population must be positively skewed.
Question
Question
Question
Question
Calculate the mean for the following sample data set: 
A) 5
B) 151
C) 9
D) 15.1
A) 5
B) 151
C) 9
D) 15.1
Question
Question
Question
A conservationist measures the diameters, in centimeters, of 200 white pine trees in the Allegheny National Forest in Northwest Pennsylvania.The data are summarized with the following five-number summary:
Xmin = 18.23, Q1 = 24.29, = 30.35, Q3 = 36.41, xmax = 42.47
Based on the five-number summary, the overall shape of the tree diameters appears to be:
A) heavily right-skewed.
B) symmetric.
C) heavily left-skewed.
D) Data shape can be discerned only from visual methods.
Xmin = 18.23, Q1 = 24.29,
= 30.35, Q3 = 36.41, xmax = 42.47
Based on the five-number summary, the overall shape of the tree diameters appears to be:
A) heavily right-skewed.
B) symmetric.
C) heavily left-skewed.
D) Data shape can be discerned only from visual methods.
Question
The lengths of the reigns of 50 British monarchs (in years) are summarized with the following five-number summary: xmin = 0, Q1 = 6,  = 15.5, Q3 = 24, xmax = 63,
  = 18.92
If the maximum of 63 years is accidentally recorded as 630 years, how will this affect the mean?
A) The mean will increase.
B) The mean will decrease.
C) The mean will be unchanged.
D) It is impossible to determine without having the complete data set.
= 15.5, Q3 = 24, xmax = 63, = 18.92If the maximum of 63 years is accidentally recorded as 630 years, how will this affect the mean?
A) The mean will increase.
B) The mean will decrease.
C) The mean will be unchanged.
D) It is impossible to determine without having the complete data set.
Question
What is the mode of the following sample data set? 
A) 15.1
B) 9
C) 5
D) 22
A) 15.1
B) 9
C) 5
D) 22
Question
The lengths of the reigns of 50 British monarchs (in years) are summarized with the following five-number summary: xmin = 0, Q1 = 6,  = 15.5, Q3 = 24, xmax = 63
If the maximum of 63 years is accidentally recorded as 630 years, how will this affect the median?
A) The median will increase.
B) The median will decrease.
C) The median will be unchanged.
D) It is impossible to determine without having the complete data set.
= 15.5, Q3 = 24, xmax = 63If the maximum of 63 years is accidentally recorded as 630 years, how will this affect the median?
A) The median will increase.
B) The median will decrease.
C) The median will be unchanged.
D) It is impossible to determine without having the complete data set.
Question
The Roller Coaster Database maintains a website (www.rcdb.com) with data on roller coasters around the world.Some of the data recorded include whether the coaster is made of wood or steel and the maximum speed achieved by the coaster, in miles per hour.The box plots display the distributions of speed by type of coaster for 145 roller coasters in the United States as downloaded from the site in November 2003. 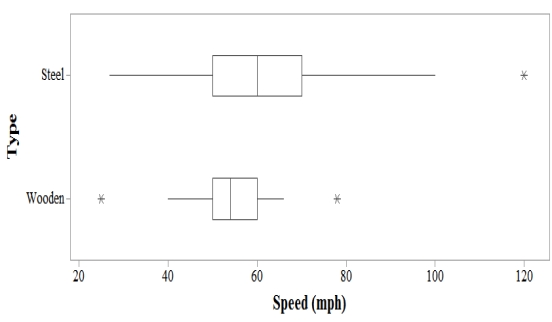 Are there more wooden or steel roller coasters displayed in this plot?
A) Wooden
B) Steel
C) There are an equal number of both types of roller coasters.
D) We cannot tell the sample sizes from a box plot.
Are there more wooden or steel roller coasters displayed in this plot?A) Wooden
B) Steel
C) There are an equal number of both types of roller coasters.
D) We cannot tell the sample sizes from a box plot.

Unlock Deck
Sign up to unlock the cards in this deck!
Unlock Deck
Unlock Deck
1/34
Play
Full screen (f)
Deck 4: Numerical Summary Measures
1
Calculate for the following sample data set:
A) 11.63
B) 15.1
C) 15.5
D) 9
for the following sample data set: A) 11.63
B) 15.1
C) 15.5
D) 9
11.63
2
What is the smallest possible value for a sample standard deviation?
A) -10
B) 0
C) 1
D) There is no smallest value.
A) -10
B) 0
C) 1
D) There is no smallest value.
0
3
The following is an abbreviated list of scores from a recent exam.Which exam score is the 15th percentile?
A) 98
B) 28
C) 51
D) 56
A) 98
B) 28
C) 51
D) 56
28
4
The sample mean is:
A) the same for all distributions.
B) a random variable specific to each distribution (i.e., it varies from sample to sample).
C) an unknowable quantity.
D) a good indicator of the spread of a data set.
A) the same for all distributions.
B) a random variable specific to each distribution (i.e., it varies from sample to sample).
C) an unknowable quantity.
D) a good indicator of the spread of a data set.
Unlock Deck
Unlock for access to all 34 flashcards in this deck.
Unlock Deck
k this deck
5
Calculate s2 for the following sample data set:
A) 4.57
B) 2.14
C) 4.17
D) 5
A) 4.57
B) 2.14
C) 4.17
D) 5
Unlock Deck
Unlock for access to all 34 flashcards in this deck.
Unlock Deck
k this deck
6
A personnel manager believes that a particular employee produces more defective parts than his peers.The manager records the worker's production over the course of several weeks.Out of 315 parts produced, 11 are defective.Calculate (the sample proportion) if we define a defective part as a "success."
A) 0.035
B) 11
C) 28.64
D) Need more information
(the sample proportion) if we define a defective part as a "success."A) 0.035
B) 11
C) 28.64
D) Need more information
Unlock Deck
Unlock for access to all 34 flashcards in this deck.
Unlock Deck
k this deck
7
The mode of a symmetric, bell-shaped distribution should:
A) be roughly the same as the mean.
B) be roughly the same as the median.
C) be unique.
D) All of the above.
A) be roughly the same as the mean.
B) be roughly the same as the median.
C) be unique.
D) All of the above.
Unlock Deck
Unlock for access to all 34 flashcards in this deck.
Unlock Deck
k this deck
8
What is the largest possible value of the sample standard deviation?
A) 100
B) 1000
C) 1,000,000
D) There is no largest possible value.
A) 100
B) 1000
C) 1,000,000
D) There is no largest possible value.
Unlock Deck
Unlock for access to all 34 flashcards in this deck.
Unlock Deck
k this deck
9
Marine was a black Labrador retriever that was trained to detect colorectal cancer by smelling the breath of patients with cancer.In one test to determine how well this dog could detect colorectal cancer, Marine correctly identified a bag containing the breath of a patient with colorectal cancer (from about five bags, with four containing the breath of healthy subjects) in 30 out of 33 trials.What is (the sample proportion) in this situation?
A) 30
B) 33
C) 0.91
D) 0.33
(the sample proportion) in this situation?A) 30
B) 33
C) 0.91
D) 0.33
Unlock Deck
Unlock for access to all 34 flashcards in this deck.
Unlock Deck
k this deck
10
The lengths of the reigns of 50 British monarchs (in years) are summarized with the following five-number summary:
Xmin = 0, Q1 = 6, = 15.5, Q3 = 24, xmax = 63, = 18.92 = 18.92
Based on the five-number summary, the overall shape of the lengths of these reigns appears to be:
A) right-skewed.
B) symmetric.
C) left-skewed.
D) Data shape can be discerned only from visual methods.
Xmin = 0, Q1 = 6,
= 15.5, Q3 = 24, xmax = 63, = 18.92 = 18.92
Based on the five-number summary, the overall shape of the lengths of these reigns appears to be:
A) right-skewed.
B) symmetric.
C) left-skewed.
D) Data shape can be discerned only from visual methods.
Unlock Deck
Unlock for access to all 34 flashcards in this deck.
Unlock Deck
k this deck
11
The median of the lower half of the observations when arranged in ascending order is the:
A) low median.
B) lower arithmetic mean.
C) first (lower) quartile.
D) third (upper) quartile.
A) low median.
B) lower arithmetic mean.
C) first (lower) quartile.
D) third (upper) quartile.
Unlock Deck
Unlock for access to all 34 flashcards in this deck.
Unlock Deck
k this deck
12
The symbol represents the:
A) population mean.
B) sample mean.
C) geometric mean.
D) sample median.
represents the:A) population mean.
B) sample mean.
C) geometric mean.
D) sample median.
Unlock Deck
Unlock for access to all 34 flashcards in this deck.
Unlock Deck
k this deck
13
Calculate for the following sample data set:
A) 5
B) 11.5
C) 9
D) 15.1
for the following sample data set: A) 5
B) 11.5
C) 9
D) 15.1
Unlock Deck
Unlock for access to all 34 flashcards in this deck.
Unlock Deck
k this deck
14
If we have a distribution with ith deviation from the mean equal to 0, then we know that:
A) the distribution is symmetric.
B) the ith observation is the same as the mean.
C) the variance must be 0.
D) the median would be a more accurate representation of central tendency.
A) the distribution is symmetric.
B) the ith observation is the same as the mean.
C) the variance must be 0.
D) the median would be a more accurate representation of central tendency.
Unlock Deck
Unlock for access to all 34 flashcards in this deck.
Unlock Deck
k this deck
15
It is known that the body mass index (BMI) of healthy American males follows a normal distribution, with a mean of 24.5 and a standard deviation of 3.0.Approximately what proportion of male BMI values fall below 18.5?
A) 0.0003
B) 0.025
C) 0.05
D) 0.16
A) 0.0003
B) 0.025
C) 0.05
D) 0.16
Unlock Deck
Unlock for access to all 34 flashcards in this deck.
Unlock Deck
k this deck
16
The smallest numeric value in a data set subtracted from the largest gives the:
A) standard deviation.
B) variance.
C) mean squared error.
D) range.
A) standard deviation.
B) variance.
C) mean squared error.
D) range.
Unlock Deck
Unlock for access to all 34 flashcards in this deck.
Unlock Deck
k this deck
17
The __________ of a data set, if any, is the value that occurs most often, or with the greatest frequency.
A) mean
B) median
C) mode
D) relative frequency
A) mean
B) median
C) mode
D) relative frequency
Unlock Deck
Unlock for access to all 34 flashcards in this deck.
Unlock Deck
k this deck
18
The _________ of a data set is the middle number when the observations are arranged in order from smallest to largest.
A) weighted mean
B) mode
C) median
D) arithmetic mean
A) weighted mean
B) mode
C) median
D) arithmetic mean
Unlock Deck
Unlock for access to all 34 flashcards in this deck.
Unlock Deck
k this deck
19
If a set of data contains an odd number of values and the data are ordered from smallest to largest, then:
A) the mean is the single middle value.
B) the mean is the same as the median.
C) the median is the single middle value.
D) the median is the average of the two middle values.
A) the mean is the single middle value.
B) the mean is the same as the median.
C) the median is the single middle value.
D) the median is the average of the two middle values.
Unlock Deck
Unlock for access to all 34 flashcards in this deck.
Unlock Deck
k this deck
20
For any set of n numbers, the sum of all n deviations about the arithmetic mean will always be:
A) greater than 0.
B) less than 0.
C) equal to 0.
D) greater than n.
A) greater than 0.
B) less than 0.
C) equal to 0.
D) greater than n.
Unlock Deck
Unlock for access to all 34 flashcards in this deck.
Unlock Deck
k this deck
21
The IQ curve is normal, with a mean of 100 and a standard deviation of 15.If "normal" IQ is defined as a score within 1 standard deviation of the mean, what range of scores is considered "normal"?
A) 85-115
B) 75-125
C) 100-115
D) 85-100
A) 85-115
B) 75-125
C) 100-115
D) 85-100
Unlock Deck
Unlock for access to all 34 flashcards in this deck.
Unlock Deck
k this deck
22
A continuous population has a mean of 210.51 and a standard deviation of 10.31.Suppose we know that the population is normally distributed.Compute the smallest interval centered on the mean that will contain 95% of the observations.
A) (200.20, 220.82)
B) (164.40, 256.62)
C) (179.58, 241.44)
D) (189.89, 231.13)
A) (200.20, 220.82)
B) (164.40, 256.62)
C) (179.58, 241.44)
D) (189.89, 231.13)
Unlock Deck
Unlock for access to all 34 flashcards in this deck.
Unlock Deck
k this deck
23
If , then:
A) the sample is negatively skewed.
B) the population must be negatively skewed.
C) the sample is positively skewed.
D) the population must be positively skewed.
, then:A) the sample is negatively skewed.
B) the population must be negatively skewed.
C) the sample is positively skewed.
D) the population must be positively skewed.
Unlock Deck
Unlock for access to all 34 flashcards in this deck.
Unlock Deck
k this deck
24
σ is the symbol for the:
A) sample standard deviation.
B) population standard deviation.
C) population variance.
D) squared sample standard deviation.
A) sample standard deviation.
B) population standard deviation.
C) population variance.
D) squared sample standard deviation.
Unlock Deck
Unlock for access to all 34 flashcards in this deck.
Unlock Deck
k this deck
25
Which measure of central tendency is equivalent to the 50th percentile?
A) Mean
B) Median
C) Mode
D) Arithmetic average
A) Mean
B) Median
C) Mode
D) Arithmetic average
Unlock Deck
Unlock for access to all 34 flashcards in this deck.
Unlock Deck
k this deck
26
In general, a data set that has a very large gap between its minimum/maximum values and a very large gap between its first/third quartiles will also have:
A) a large amount of variability.
B) a completely positive set of values.
C) a completely negative set of values.
D) values that are both positive and negative.
A) a large amount of variability.
B) a completely positive set of values.
C) a completely negative set of values.
D) values that are both positive and negative.
Unlock Deck
Unlock for access to all 34 flashcards in this deck.
Unlock Deck
k this deck
27
Calculate the mean for the following sample data set:
A) 5
B) 151
C) 9
D) 15.1
A) 5
B) 151
C) 9
D) 15.1
Unlock Deck
Unlock for access to all 34 flashcards in this deck.
Unlock Deck
k this deck
28
It is known that the body mass index (BMI) of healthy American females follows a normal distribution, with a mean of 22.5 and a standard deviation pf 3.0.Approximately what percentage of female BMI values fall between 16.5 and 28.5?
A) 99.7%
B) 95%
C) 81.5%
D) 68%
A) 99.7%
B) 95%
C) 81.5%
D) 68%
Unlock Deck
Unlock for access to all 34 flashcards in this deck.
Unlock Deck
k this deck
29
If the sample mean is greater than the sample median, the sample is:
A) positively skewed.
B) negatively skewed.
C) symmetric.
D) not valid for inference.
A) positively skewed.
B) negatively skewed.
C) symmetric.
D) not valid for inference.
Unlock Deck
Unlock for access to all 34 flashcards in this deck.
Unlock Deck
k this deck
30
A conservationist measures the diameters, in centimeters, of 200 white pine trees in the Allegheny National Forest in Northwest Pennsylvania.The data are summarized with the following five-number summary:
Xmin = 18.23, Q1 = 24.29, = 30.35, Q3 = 36.41, xmax = 42.47
Based on the five-number summary, the overall shape of the tree diameters appears to be:
A) heavily right-skewed.
B) symmetric.
C) heavily left-skewed.
D) Data shape can be discerned only from visual methods.
Xmin = 18.23, Q1 = 24.29,
= 30.35, Q3 = 36.41, xmax = 42.47
Based on the five-number summary, the overall shape of the tree diameters appears to be:
A) heavily right-skewed.
B) symmetric.
C) heavily left-skewed.
D) Data shape can be discerned only from visual methods.
Unlock Deck
Unlock for access to all 34 flashcards in this deck.
Unlock Deck
k this deck
31
The lengths of the reigns of 50 British monarchs (in years) are summarized with the following five-number summary: xmin = 0, Q1 = 6, = 15.5, Q3 = 24, xmax = 63, = 18.92
If the maximum of 63 years is accidentally recorded as 630 years, how will this affect the mean?
A) The mean will increase.
B) The mean will decrease.
C) The mean will be unchanged.
D) It is impossible to determine without having the complete data set.
= 15.5, Q3 = 24, xmax = 63, = 18.92If the maximum of 63 years is accidentally recorded as 630 years, how will this affect the mean?
A) The mean will increase.
B) The mean will decrease.
C) The mean will be unchanged.
D) It is impossible to determine without having the complete data set.
Unlock Deck
Unlock for access to all 34 flashcards in this deck.
Unlock Deck
k this deck
32
What is the mode of the following sample data set?
A) 15.1
B) 9
C) 5
D) 22
A) 15.1
B) 9
C) 5
D) 22
Unlock Deck
Unlock for access to all 34 flashcards in this deck.
Unlock Deck
k this deck
33
The lengths of the reigns of 50 British monarchs (in years) are summarized with the following five-number summary: xmin = 0, Q1 = 6, = 15.5, Q3 = 24, xmax = 63
If the maximum of 63 years is accidentally recorded as 630 years, how will this affect the median?
A) The median will increase.
B) The median will decrease.
C) The median will be unchanged.
D) It is impossible to determine without having the complete data set.
= 15.5, Q3 = 24, xmax = 63If the maximum of 63 years is accidentally recorded as 630 years, how will this affect the median?
A) The median will increase.
B) The median will decrease.
C) The median will be unchanged.
D) It is impossible to determine without having the complete data set.
Unlock Deck
Unlock for access to all 34 flashcards in this deck.
Unlock Deck
k this deck
34
The Roller Coaster Database maintains a website (www.rcdb.com) with data on roller coasters around the world.Some of the data recorded include whether the coaster is made of wood or steel and the maximum speed achieved by the coaster, in miles per hour.The box plots display the distributions of speed by type of coaster for 145 roller coasters in the United States as downloaded from the site in November 2003. Are there more wooden or steel roller coasters displayed in this plot?
A) Wooden
B) Steel
C) There are an equal number of both types of roller coasters.
D) We cannot tell the sample sizes from a box plot.
Are there more wooden or steel roller coasters displayed in this plot?A) Wooden
B) Steel
C) There are an equal number of both types of roller coasters.
D) We cannot tell the sample sizes from a box plot.
Unlock Deck
Unlock for access to all 34 flashcards in this deck.
Unlock Deck
k this deck
Unlock Deck
Unlock for access to all 34 flashcards in this deck.


