

Deck 18: Measures of Association

Full screen (f)
exit full mode
Question
Distinguish between the following:
a. Regression coefficient and correlation coefficient.
b. r = 0 and = 0.
c. The test of the true slope, the test of the intercept, and r² = 0.
d. r² and r.
e. A slope of 0.
f. F and t².
Use Space or
up arrow
down arrow
to flip the card.
Question
Describe the relationship between the two variables in the four plots.
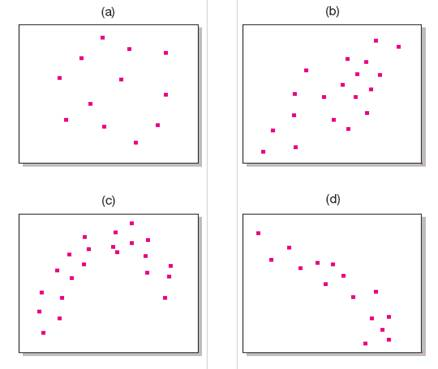
Describe the relationship between the two variables in the four plots.  <div style=padding-top: 35px>
Question
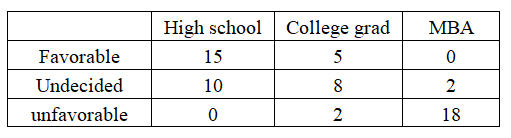
A polling organization collected data on a sample of 60 registered voters regarding a tax on the market value of equity transactions as one remedy for the budget deficit.
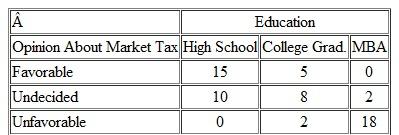
A polling organization collected data on a sample of 60 registered voters regarding a tax on the market value of equity transactions as one remedy for the budget deficit.   a. Compute gamma for the table. b. Compute tau b or tau c for the same data. c. What accounts for the differences d. Decide which is more suitable for these data.<div style=padding-top: 35px>
a. Compute gamma for the table.
b. Compute tau b or tau c for the same data.
c. What accounts for the differences
d. Decide which is more suitable for these data.
Question
Using the table data in question 3, compute Somers's d symmetric and then use opinion as the dependent variable. Decide which approach is best for reporting the decision.
Question
A research team conducted a study of soft-drink preferences among residents in a test market prior to an advertising campaign for a new cola product. Of the participants, 130 are teenagers and 130 are adults. The researchers secured the following results:
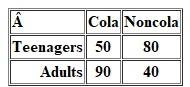
A research team conducted a study of soft-drink preferences among residents in a test market prior to an advertising campaign for a new cola product. Of the participants, 130 are teenagers and 130 are adults. The researchers secured the following results:   Calculate an appropriate measure of association, and decide how to present the results. How might this information affect the advertising agency<div style=padding-top: 35px>
Calculate an appropriate measure of association, and decide how to present the results. How might this information affect the advertising agency
Question
What would the numbers of "police calls resulting in arrest" for Gladeside and Oceanside need to change to in order to support the conclusion of "disparate impact"
Question
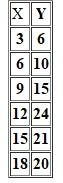
Using the following data,
Using the following data,   a. Create a scatterplot. b. Find the least-squares line. c. Plot the line on the diagram. d. Predict: Y if X is 10 Y if X is 17.<div style=padding-top: 35px>
a. Create a scatterplot.
b. Find the least-squares line.
c. Plot the line on the diagram.
d. Predict: Y if X is 10
Y if X is 17.
Question
A home pregnancy test claims to be 97 percent accurate when consumers obtain a positive result. To what extent are the variables of "actual clinical condition" and "test readings" related
a. Compute phi, Cramer's V, and the contingency coefficients for the table below. What can you say about the strength of the relationship between the two variables
b. Compute lambda for these data. What does the statistic tell you
Actual Clinical Condition* Test Readings of In-Vitro Diagnostic Cross-Tabulation
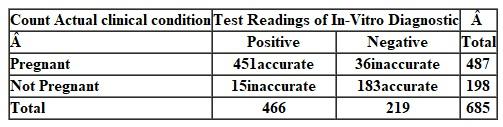
A home pregnancy test claims to be 97 percent accurate when consumers obtain a positive result. To what extent are the variables of actual clinical condition and test readings related a. Compute phi, Cramer's V, and the contingency coefficients for the table below. What can you say about the strength of the relationship between the two variables b. Compute lambda for these data. What does the statistic tell you Actual Clinical Condition* Test Readings of In-Vitro Diagnostic Cross-Tabulation  <div style=padding-top: 35px>
Question
Fill in the missing blocks for the ANOVA summary table on net profits and market value used with regression analysis.
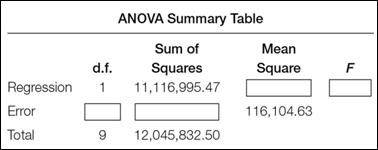
Fill in the missing blocks for the ANOVA summary table on net profits and market value used with regression analysis.   a. What does the F tell you (alpha =.05) b. What is the t value Explain its meaning.<div style=padding-top: 35px>
a. What does the F tell you (alpha =.05)
b. What is the t value Explain its meaning.
Question
Secure Spearman rank-order correlations for the largest Pearson coefficient in the matrix from question 9. Explain the differences between the two findings.
Question
Using the matrix data above (Forbes 500), select a pair of variables and run a simple regression. Then investigate the appropriateness of the model for the data using diagnostic tools for evaluating assumptions.
Question
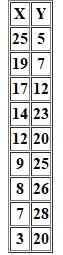
For the data below,
For the data below,   a. Calculate the correlation between X and Y. b. Interpret the sign of the correlation. c. Interpret the square of the correlation. d. Plot the least-squares line. e. Test for a linear relationship: (1) 1 = 0. (2) r = 0. (3) An F test.<div style=padding-top: 35px>
a. Calculate the correlation between X and Y.
b. Interpret the sign of the correlation.
c. Interpret the square of the correlation.
d. Plot the least-squares line.
e. Test for a linear relationship:
(1) 1 = 0.
(2) r = 0.
(3) An F test.
Question
"There is an 'unhealthy correlation' between the building of skyscrapers and subsequent financial crashes," according to Barclays Capital. Examples include: the world's first skyscraper, the Equitable Life building in New York (completed in 1873 and coincided with a five-year recession), the Empire State building (the Great Depression was under way), Chicago's Willis Tower- formerly known as the Sears Tower-in 1974 (during an oil shock and when the U.S. dollar's reliance on gold was abandoned), and Malaysia's Petronas Towers in 1997 (corresponding to the Asian financial crisis). Currently, the world's tallest skyscraper is the Burj Khalifa (built just before Dubai's financial troubles). China is the biggest builder of skyscrapers, with 53 percent of all the tall buildings in the world. JPMorgan Chase said that the Chinese property market could drop by as much as 20 percent in value in the country's major cities within the next 12 to 18 months. "Often the world's tallest buildings are... [a reflection of] a widespread misallocation of capital and an impending economic correction," Barclays Capital analysts said.
Examine the correlational finding and provide plausible alternatives for their findings.
Unlock Deck
Sign up to unlock the cards in this deck!
Unlock Deck
Unlock Deck
1/13
auto play flashcards
Play
simple tutorial
Full screen (f)
exit full mode
Deck 18: Measures of Association
1
Distinguish between the following:
a. Regression coefficient and correlation coefficient.
b. r = 0 and = 0.
c. The test of the true slope, the test of the intercept, and r² = 0.
d. r² and r.
e. A slope of 0.
f. F and t².
Business questions mostly involve scenarios comparing two or more variables. Correlational analysis between two variable provides various associations between variables. Thus, complex relationships can be evaluated using measures of association.
a
The difference between regression coefficient and correlation coefficient are
• A correlation provides the magnitude and direction of the linear relationship between two variables. The coefficient denotes the degree of association between them.
• A regression equation helps to estimate the value of a variable based on the value another. The fixed values of the equation are known as regressional coefficients.
b
• The coefficient of correlation's estimate of the linear association between variables of the sample is denoted by r. When r = 0, the pattern of relationship is in nonlinear form. In such cases, pattern is not a straight line.
• The coefficient when applied to a population, denotes the population correlation and is represented as . When = 0, there exist no linear association in a population.
c
The difference between them are as follows:
• The slope ( 0 ) is the factor with which the dependent variable (Y) changes with the independent variable (X) in a bivariate linear regression. The slope is the change caused in Y with a unit change in X. If the true slope is 0, there is no linear relationship between X and Y variable present and both are completely unrelated. It can also suggest that for all values of X, Y remains constant. It may also suggest that a non-linear relationship exists.
• The intercept ( 1 ) is the value of the dependent variable (Y) when the independent variable (X) = 0. The test of intercept is the method to find out whether the regression line passes through the origin. The line will pass through the origin if intercept ( 1 ) = 0. When the regression line passes through the origin, it can be confirmed that Y=0 in case X=0.
• The coefficient of correlation ( r ) suggests how can the differences in the dependent variable (Y) explained by the differences in the independent variable (X). The coefficient of determination ( r 2 ) tells us the proportion of the relationship of the regression equation. r 2 =0 shows that the linear relationship between the variables is insignificant.
d
The difference between them are as follows:
• The coefficient of correlation (r) suggests the strength of a relationship between two variables.
• The coefficient of determination (r 2 ) tells us the proportion of the variances in Y can be estimated through X.
e
• The slope is the change in Y produced with a unit change in X. If the slope is 0, there is no linear relationship between X and Y variable present and both are completely unrelated. It can also suggest that for all values of X, Y remains constant. It may also suggest that a non-linear relationship exists.
f
• In bivariate regression, F and t-test produce the same results but in multivariate regression, the F-test plays an important role. It uses F-distribution. It helps to determine if the model fitted to a data set best fits the population from which it has been sampled.
• The t-test is a two-tailed test using t-distribution to accept or reject a null hypothesis for a normal distribution. It compares the significance of the difference in mean value between two groups.
2
Describe the relationship between the two variables in the four plots.
Scatter plot diagram shows the relationship between two variables i.e. the effect of one variable on another variable, which is said to be correlation. Correlation between variables is defined in three types i.e. positive, negative and no correlation.
a)
In this scatter plot diagram, the points are directionless and round in shape. There is no relationship between variables as line cannot fit to these points on graph.
b)
In this scatter plot diagram, the points are sloping from lower left to upper right, which is directed towards 1. As the data points are lie slightly away from the line of best fit, the relationship between variables is low or weak positive relationship.
c)
In this scatter plot diagram, the points are sloping from lower left to upper right and then form a curve. This shows the curvilinear relationship between the variables.
d)
In this scatter plot diagram, the points are sloping from upper left to lower right, which is in the direction towards -1. Thus, the relationship between variables is high negative correlation.
3
A polling organization collected data on a sample of 60 registered voters regarding a tax on the market value of equity transactions as one remedy for the budget deficit.
A polling organization collected data on a sample of 60 registered voters regarding a tax on the market value of equity transactions as one remedy for the budget deficit.   a. Compute gamma for the table. b. Compute tau b or tau c for the same data. c. What accounts for the differences d. Decide which is more suitable for these data.
a. Compute gamma for the table.
b. Compute tau b or tau c for the same data.
c. What accounts for the differences
d. Decide which is more suitable for these data.
Goodman and kruskal gamma compares the concordant and discordant pairs and then it maximizes the denominator in order to standardize the outcome. Kendall's
Goodman and kruskal gamma compares the concordant and discordant pairs and then it maximizes the denominator in order to standardize the outcome. Kendall's   and   is adjustment to the gamma. Kendall's   considers tied pairs, which occurs when X- variable and Y- variable has same value. Mostly   is considered when the data is square i.e. table with equal rows and columns and   is considered when the data is rectangle. The given below data is opinion about market tax among voters from different education levels.   a) The formula to calculate gamma is   Step 1: P is concordant pairs. The calculation steps to find the P value is as follows:     Step 2: Q is discordant pairs. The calculation steps to find the P value is as follows:     Step 3: Substitute P and Q value in gamma formula as shown below:   b) Formula to calculate   and   is as follows:   ;   Step 1 The calculation of tied pairs as part of calculating   and   , is as follows:   The formula to calculate   is as follows: (consider row totals)   The formula to calculate   is as follows: (consider column totals)   Step 2: The substitution of   and   values in the   formula is as follows: Total pairs (n) = 60   The calculation of   is as follows: m = smaller number of rows or columns   c) In this case, both   and   values are same or equal d) In general,   is considered for square data. As the rows and columns of this table are equal i.e. square,   is considered for this. and
Goodman and kruskal gamma compares the concordant and discordant pairs and then it maximizes the denominator in order to standardize the outcome. Kendall's   and   is adjustment to the gamma. Kendall's   considers tied pairs, which occurs when X- variable and Y- variable has same value. Mostly   is considered when the data is square i.e. table with equal rows and columns and   is considered when the data is rectangle. The given below data is opinion about market tax among voters from different education levels.   a) The formula to calculate gamma is   Step 1: P is concordant pairs. The calculation steps to find the P value is as follows:     Step 2: Q is discordant pairs. The calculation steps to find the P value is as follows:     Step 3: Substitute P and Q value in gamma formula as shown below:   b) Formula to calculate   and   is as follows:   ;   Step 1 The calculation of tied pairs as part of calculating   and   , is as follows:   The formula to calculate   is as follows: (consider row totals)   The formula to calculate   is as follows: (consider column totals)   Step 2: The substitution of   and   values in the   formula is as follows: Total pairs (n) = 60   The calculation of   is as follows: m = smaller number of rows or columns   c) In this case, both   and   values are same or equal d) In general,   is considered for square data. As the rows and columns of this table are equal i.e. square,   is considered for this. is adjustment to the gamma. Kendall's
Goodman and kruskal gamma compares the concordant and discordant pairs and then it maximizes the denominator in order to standardize the outcome. Kendall's   and   is adjustment to the gamma. Kendall's   considers tied pairs, which occurs when X- variable and Y- variable has same value. Mostly   is considered when the data is square i.e. table with equal rows and columns and   is considered when the data is rectangle. The given below data is opinion about market tax among voters from different education levels.   a) The formula to calculate gamma is   Step 1: P is concordant pairs. The calculation steps to find the P value is as follows:     Step 2: Q is discordant pairs. The calculation steps to find the P value is as follows:     Step 3: Substitute P and Q value in gamma formula as shown below:   b) Formula to calculate   and   is as follows:   ;   Step 1 The calculation of tied pairs as part of calculating   and   , is as follows:   The formula to calculate   is as follows: (consider row totals)   The formula to calculate   is as follows: (consider column totals)   Step 2: The substitution of   and   values in the   formula is as follows: Total pairs (n) = 60   The calculation of   is as follows: m = smaller number of rows or columns   c) In this case, both   and   values are same or equal d) In general,   is considered for square data. As the rows and columns of this table are equal i.e. square,   is considered for this. considers tied pairs, which occurs when X- variable and Y- variable has same value. Mostly
Goodman and kruskal gamma compares the concordant and discordant pairs and then it maximizes the denominator in order to standardize the outcome. Kendall's   and   is adjustment to the gamma. Kendall's   considers tied pairs, which occurs when X- variable and Y- variable has same value. Mostly   is considered when the data is square i.e. table with equal rows and columns and   is considered when the data is rectangle. The given below data is opinion about market tax among voters from different education levels.   a) The formula to calculate gamma is   Step 1: P is concordant pairs. The calculation steps to find the P value is as follows:     Step 2: Q is discordant pairs. The calculation steps to find the P value is as follows:     Step 3: Substitute P and Q value in gamma formula as shown below:   b) Formula to calculate   and   is as follows:   ;   Step 1 The calculation of tied pairs as part of calculating   and   , is as follows:   The formula to calculate   is as follows: (consider row totals)   The formula to calculate   is as follows: (consider column totals)   Step 2: The substitution of   and   values in the   formula is as follows: Total pairs (n) = 60   The calculation of   is as follows: m = smaller number of rows or columns   c) In this case, both   and   values are same or equal d) In general,   is considered for square data. As the rows and columns of this table are equal i.e. square,   is considered for this. is considered when the data is square i.e. table with equal rows and columns and
Goodman and kruskal gamma compares the concordant and discordant pairs and then it maximizes the denominator in order to standardize the outcome. Kendall's   and   is adjustment to the gamma. Kendall's   considers tied pairs, which occurs when X- variable and Y- variable has same value. Mostly   is considered when the data is square i.e. table with equal rows and columns and   is considered when the data is rectangle. The given below data is opinion about market tax among voters from different education levels.   a) The formula to calculate gamma is   Step 1: P is concordant pairs. The calculation steps to find the P value is as follows:     Step 2: Q is discordant pairs. The calculation steps to find the P value is as follows:     Step 3: Substitute P and Q value in gamma formula as shown below:   b) Formula to calculate   and   is as follows:   ;   Step 1 The calculation of tied pairs as part of calculating   and   , is as follows:   The formula to calculate   is as follows: (consider row totals)   The formula to calculate   is as follows: (consider column totals)   Step 2: The substitution of   and   values in the   formula is as follows: Total pairs (n) = 60   The calculation of   is as follows: m = smaller number of rows or columns   c) In this case, both   and   values are same or equal d) In general,   is considered for square data. As the rows and columns of this table are equal i.e. square,   is considered for this. is considered when the data is rectangle.
The given below data is opinion about market tax among voters from different education levels.
Goodman and kruskal gamma compares the concordant and discordant pairs and then it maximizes the denominator in order to standardize the outcome. Kendall's   and   is adjustment to the gamma. Kendall's   considers tied pairs, which occurs when X- variable and Y- variable has same value. Mostly   is considered when the data is square i.e. table with equal rows and columns and   is considered when the data is rectangle. The given below data is opinion about market tax among voters from different education levels.   a) The formula to calculate gamma is   Step 1: P is concordant pairs. The calculation steps to find the P value is as follows:     Step 2: Q is discordant pairs. The calculation steps to find the P value is as follows:     Step 3: Substitute P and Q value in gamma formula as shown below:   b) Formula to calculate   and   is as follows:   ;   Step 1 The calculation of tied pairs as part of calculating   and   , is as follows:   The formula to calculate   is as follows: (consider row totals)   The formula to calculate   is as follows: (consider column totals)   Step 2: The substitution of   and   values in the   formula is as follows: Total pairs (n) = 60   The calculation of   is as follows: m = smaller number of rows or columns   c) In this case, both   and   values are same or equal d) In general,   is considered for square data. As the rows and columns of this table are equal i.e. square,   is considered for this. a)

The formula to calculate gamma is
Goodman and kruskal gamma compares the concordant and discordant pairs and then it maximizes the denominator in order to standardize the outcome. Kendall's   and   is adjustment to the gamma. Kendall's   considers tied pairs, which occurs when X- variable and Y- variable has same value. Mostly   is considered when the data is square i.e. table with equal rows and columns and   is considered when the data is rectangle. The given below data is opinion about market tax among voters from different education levels.   a) The formula to calculate gamma is   Step 1: P is concordant pairs. The calculation steps to find the P value is as follows:     Step 2: Q is discordant pairs. The calculation steps to find the P value is as follows:     Step 3: Substitute P and Q value in gamma formula as shown below:   b) Formula to calculate   and   is as follows:   ;   Step 1 The calculation of tied pairs as part of calculating   and   , is as follows:   The formula to calculate   is as follows: (consider row totals)   The formula to calculate   is as follows: (consider column totals)   Step 2: The substitution of   and   values in the   formula is as follows: Total pairs (n) = 60   The calculation of   is as follows: m = smaller number of rows or columns   c) In this case, both   and   values are same or equal d) In general,   is considered for square data. As the rows and columns of this table are equal i.e. square,   is considered for this. Step 1:
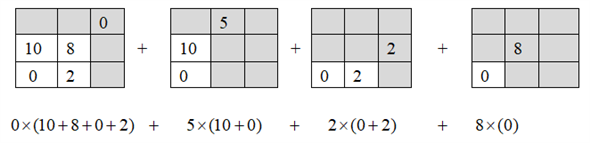
P is concordant pairs. The calculation steps to find the P value is as follows:
Goodman and kruskal gamma compares the concordant and discordant pairs and then it maximizes the denominator in order to standardize the outcome. Kendall's   and   is adjustment to the gamma. Kendall's   considers tied pairs, which occurs when X- variable and Y- variable has same value. Mostly   is considered when the data is square i.e. table with equal rows and columns and   is considered when the data is rectangle. The given below data is opinion about market tax among voters from different education levels.   a) The formula to calculate gamma is   Step 1: P is concordant pairs. The calculation steps to find the P value is as follows:     Step 2: Q is discordant pairs. The calculation steps to find the P value is as follows:     Step 3: Substitute P and Q value in gamma formula as shown below:   b) Formula to calculate   and   is as follows:   ;   Step 1 The calculation of tied pairs as part of calculating   and   , is as follows:   The formula to calculate   is as follows: (consider row totals)   The formula to calculate   is as follows: (consider column totals)   Step 2: The substitution of   and   values in the   formula is as follows: Total pairs (n) = 60   The calculation of   is as follows: m = smaller number of rows or columns   c) In this case, both   and   values are same or equal d) In general,   is considered for square data. As the rows and columns of this table are equal i.e. square,   is considered for this. Goodman and kruskal gamma compares the concordant and discordant pairs and then it maximizes the denominator in order to standardize the outcome. Kendall's   and   is adjustment to the gamma. Kendall's   considers tied pairs, which occurs when X- variable and Y- variable has same value. Mostly   is considered when the data is square i.e. table with equal rows and columns and   is considered when the data is rectangle. The given below data is opinion about market tax among voters from different education levels.   a) The formula to calculate gamma is   Step 1: P is concordant pairs. The calculation steps to find the P value is as follows:     Step 2: Q is discordant pairs. The calculation steps to find the P value is as follows:     Step 3: Substitute P and Q value in gamma formula as shown below:   b) Formula to calculate   and   is as follows:   ;   Step 1 The calculation of tied pairs as part of calculating   and   , is as follows:   The formula to calculate   is as follows: (consider row totals)   The formula to calculate   is as follows: (consider column totals)   Step 2: The substitution of   and   values in the   formula is as follows: Total pairs (n) = 60   The calculation of   is as follows: m = smaller number of rows or columns   c) In this case, both   and   values are same or equal d) In general,   is considered for square data. As the rows and columns of this table are equal i.e. square,   is considered for this. Step 2:
Q is discordant pairs. The calculation steps to find the P value is as follows:
Goodman and kruskal gamma compares the concordant and discordant pairs and then it maximizes the denominator in order to standardize the outcome. Kendall's   and   is adjustment to the gamma. Kendall's   considers tied pairs, which occurs when X- variable and Y- variable has same value. Mostly   is considered when the data is square i.e. table with equal rows and columns and   is considered when the data is rectangle. The given below data is opinion about market tax among voters from different education levels.   a) The formula to calculate gamma is   Step 1: P is concordant pairs. The calculation steps to find the P value is as follows:     Step 2: Q is discordant pairs. The calculation steps to find the P value is as follows:     Step 3: Substitute P and Q value in gamma formula as shown below:   b) Formula to calculate   and   is as follows:   ;   Step 1 The calculation of tied pairs as part of calculating   and   , is as follows:   The formula to calculate   is as follows: (consider row totals)   The formula to calculate   is as follows: (consider column totals)   Step 2: The substitution of   and   values in the   formula is as follows: Total pairs (n) = 60   The calculation of   is as follows: m = smaller number of rows or columns   c) In this case, both   and   values are same or equal d) In general,   is considered for square data. As the rows and columns of this table are equal i.e. square,   is considered for this. Goodman and kruskal gamma compares the concordant and discordant pairs and then it maximizes the denominator in order to standardize the outcome. Kendall's   and   is adjustment to the gamma. Kendall's   considers tied pairs, which occurs when X- variable and Y- variable has same value. Mostly   is considered when the data is square i.e. table with equal rows and columns and   is considered when the data is rectangle. The given below data is opinion about market tax among voters from different education levels.   a) The formula to calculate gamma is   Step 1: P is concordant pairs. The calculation steps to find the P value is as follows:     Step 2: Q is discordant pairs. The calculation steps to find the P value is as follows:     Step 3: Substitute P and Q value in gamma formula as shown below:   b) Formula to calculate   and   is as follows:   ;   Step 1 The calculation of tied pairs as part of calculating   and   , is as follows:   The formula to calculate   is as follows: (consider row totals)   The formula to calculate   is as follows: (consider column totals)   Step 2: The substitution of   and   values in the   formula is as follows: Total pairs (n) = 60   The calculation of   is as follows: m = smaller number of rows or columns   c) In this case, both   and   values are same or equal d) In general,   is considered for square data. As the rows and columns of this table are equal i.e. square,   is considered for this. Step 3:
Substitute P and Q value in gamma formula as shown below:
Goodman and kruskal gamma compares the concordant and discordant pairs and then it maximizes the denominator in order to standardize the outcome. Kendall's   and   is adjustment to the gamma. Kendall's   considers tied pairs, which occurs when X- variable and Y- variable has same value. Mostly   is considered when the data is square i.e. table with equal rows and columns and   is considered when the data is rectangle. The given below data is opinion about market tax among voters from different education levels.   a) The formula to calculate gamma is   Step 1: P is concordant pairs. The calculation steps to find the P value is as follows:     Step 2: Q is discordant pairs. The calculation steps to find the P value is as follows:     Step 3: Substitute P and Q value in gamma formula as shown below:   b) Formula to calculate   and   is as follows:   ;   Step 1 The calculation of tied pairs as part of calculating   and   , is as follows:   The formula to calculate   is as follows: (consider row totals)   The formula to calculate   is as follows: (consider column totals)   Step 2: The substitution of   and   values in the   formula is as follows: Total pairs (n) = 60   The calculation of   is as follows: m = smaller number of rows or columns   c) In this case, both   and   values are same or equal d) In general,   is considered for square data. As the rows and columns of this table are equal i.e. square,   is considered for this. b)
Formula to calculate
Goodman and kruskal gamma compares the concordant and discordant pairs and then it maximizes the denominator in order to standardize the outcome. Kendall's   and   is adjustment to the gamma. Kendall's   considers tied pairs, which occurs when X- variable and Y- variable has same value. Mostly   is considered when the data is square i.e. table with equal rows and columns and   is considered when the data is rectangle. The given below data is opinion about market tax among voters from different education levels.   a) The formula to calculate gamma is   Step 1: P is concordant pairs. The calculation steps to find the P value is as follows:     Step 2: Q is discordant pairs. The calculation steps to find the P value is as follows:     Step 3: Substitute P and Q value in gamma formula as shown below:   b) Formula to calculate   and   is as follows:   ;   Step 1 The calculation of tied pairs as part of calculating   and   , is as follows:   The formula to calculate   is as follows: (consider row totals)   The formula to calculate   is as follows: (consider column totals)   Step 2: The substitution of   and   values in the   formula is as follows: Total pairs (n) = 60   The calculation of   is as follows: m = smaller number of rows or columns   c) In this case, both   and   values are same or equal d) In general,   is considered for square data. As the rows and columns of this table are equal i.e. square,   is considered for this. and
Goodman and kruskal gamma compares the concordant and discordant pairs and then it maximizes the denominator in order to standardize the outcome. Kendall's   and   is adjustment to the gamma. Kendall's   considers tied pairs, which occurs when X- variable and Y- variable has same value. Mostly   is considered when the data is square i.e. table with equal rows and columns and   is considered when the data is rectangle. The given below data is opinion about market tax among voters from different education levels.   a) The formula to calculate gamma is   Step 1: P is concordant pairs. The calculation steps to find the P value is as follows:     Step 2: Q is discordant pairs. The calculation steps to find the P value is as follows:     Step 3: Substitute P and Q value in gamma formula as shown below:   b) Formula to calculate   and   is as follows:   ;   Step 1 The calculation of tied pairs as part of calculating   and   , is as follows:   The formula to calculate   is as follows: (consider row totals)   The formula to calculate   is as follows: (consider column totals)   Step 2: The substitution of   and   values in the   formula is as follows: Total pairs (n) = 60   The calculation of   is as follows: m = smaller number of rows or columns   c) In this case, both   and   values are same or equal d) In general,   is considered for square data. As the rows and columns of this table are equal i.e. square,   is considered for this. is as follows:
Goodman and kruskal gamma compares the concordant and discordant pairs and then it maximizes the denominator in order to standardize the outcome. Kendall's   and   is adjustment to the gamma. Kendall's   considers tied pairs, which occurs when X- variable and Y- variable has same value. Mostly   is considered when the data is square i.e. table with equal rows and columns and   is considered when the data is rectangle. The given below data is opinion about market tax among voters from different education levels.   a) The formula to calculate gamma is   Step 1: P is concordant pairs. The calculation steps to find the P value is as follows:     Step 2: Q is discordant pairs. The calculation steps to find the P value is as follows:     Step 3: Substitute P and Q value in gamma formula as shown below:   b) Formula to calculate   and   is as follows:   ;   Step 1 The calculation of tied pairs as part of calculating   and   , is as follows:   The formula to calculate   is as follows: (consider row totals)   The formula to calculate   is as follows: (consider column totals)   Step 2: The substitution of   and   values in the   formula is as follows: Total pairs (n) = 60   The calculation of   is as follows: m = smaller number of rows or columns   c) In this case, both   and   values are same or equal d) In general,   is considered for square data. As the rows and columns of this table are equal i.e. square,   is considered for this. ;
Goodman and kruskal gamma compares the concordant and discordant pairs and then it maximizes the denominator in order to standardize the outcome. Kendall's   and   is adjustment to the gamma. Kendall's   considers tied pairs, which occurs when X- variable and Y- variable has same value. Mostly   is considered when the data is square i.e. table with equal rows and columns and   is considered when the data is rectangle. The given below data is opinion about market tax among voters from different education levels.   a) The formula to calculate gamma is   Step 1: P is concordant pairs. The calculation steps to find the P value is as follows:     Step 2: Q is discordant pairs. The calculation steps to find the P value is as follows:     Step 3: Substitute P and Q value in gamma formula as shown below:   b) Formula to calculate   and   is as follows:   ;   Step 1 The calculation of tied pairs as part of calculating   and   , is as follows:   The formula to calculate   is as follows: (consider row totals)   The formula to calculate   is as follows: (consider column totals)   Step 2: The substitution of   and   values in the   formula is as follows: Total pairs (n) = 60   The calculation of   is as follows: m = smaller number of rows or columns   c) In this case, both   and   values are same or equal d) In general,   is considered for square data. As the rows and columns of this table are equal i.e. square,   is considered for this. Step 1
The calculation of tied pairs as part of calculating
Goodman and kruskal gamma compares the concordant and discordant pairs and then it maximizes the denominator in order to standardize the outcome. Kendall's   and   is adjustment to the gamma. Kendall's   considers tied pairs, which occurs when X- variable and Y- variable has same value. Mostly   is considered when the data is square i.e. table with equal rows and columns and   is considered when the data is rectangle. The given below data is opinion about market tax among voters from different education levels.   a) The formula to calculate gamma is   Step 1: P is concordant pairs. The calculation steps to find the P value is as follows:     Step 2: Q is discordant pairs. The calculation steps to find the P value is as follows:     Step 3: Substitute P and Q value in gamma formula as shown below:   b) Formula to calculate   and   is as follows:   ;   Step 1 The calculation of tied pairs as part of calculating   and   , is as follows:   The formula to calculate   is as follows: (consider row totals)   The formula to calculate   is as follows: (consider column totals)   Step 2: The substitution of   and   values in the   formula is as follows: Total pairs (n) = 60   The calculation of   is as follows: m = smaller number of rows or columns   c) In this case, both   and   values are same or equal d) In general,   is considered for square data. As the rows and columns of this table are equal i.e. square,   is considered for this. and
Goodman and kruskal gamma compares the concordant and discordant pairs and then it maximizes the denominator in order to standardize the outcome. Kendall's   and   is adjustment to the gamma. Kendall's   considers tied pairs, which occurs when X- variable and Y- variable has same value. Mostly   is considered when the data is square i.e. table with equal rows and columns and   is considered when the data is rectangle. The given below data is opinion about market tax among voters from different education levels.   a) The formula to calculate gamma is   Step 1: P is concordant pairs. The calculation steps to find the P value is as follows:     Step 2: Q is discordant pairs. The calculation steps to find the P value is as follows:     Step 3: Substitute P and Q value in gamma formula as shown below:   b) Formula to calculate   and   is as follows:   ;   Step 1 The calculation of tied pairs as part of calculating   and   , is as follows:   The formula to calculate   is as follows: (consider row totals)   The formula to calculate   is as follows: (consider column totals)   Step 2: The substitution of   and   values in the   formula is as follows: Total pairs (n) = 60   The calculation of   is as follows: m = smaller number of rows or columns   c) In this case, both   and   values are same or equal d) In general,   is considered for square data. As the rows and columns of this table are equal i.e. square,   is considered for this. , is as follows:
Goodman and kruskal gamma compares the concordant and discordant pairs and then it maximizes the denominator in order to standardize the outcome. Kendall's   and   is adjustment to the gamma. Kendall's   considers tied pairs, which occurs when X- variable and Y- variable has same value. Mostly   is considered when the data is square i.e. table with equal rows and columns and   is considered when the data is rectangle. The given below data is opinion about market tax among voters from different education levels.   a) The formula to calculate gamma is   Step 1: P is concordant pairs. The calculation steps to find the P value is as follows:     Step 2: Q is discordant pairs. The calculation steps to find the P value is as follows:     Step 3: Substitute P and Q value in gamma formula as shown below:   b) Formula to calculate   and   is as follows:   ;   Step 1 The calculation of tied pairs as part of calculating   and   , is as follows:   The formula to calculate   is as follows: (consider row totals)   The formula to calculate   is as follows: (consider column totals)   Step 2: The substitution of   and   values in the   formula is as follows: Total pairs (n) = 60   The calculation of   is as follows: m = smaller number of rows or columns   c) In this case, both   and   values are same or equal d) In general,   is considered for square data. As the rows and columns of this table are equal i.e. square,   is considered for this. The formula to calculate
Goodman and kruskal gamma compares the concordant and discordant pairs and then it maximizes the denominator in order to standardize the outcome. Kendall's   and   is adjustment to the gamma. Kendall's   considers tied pairs, which occurs when X- variable and Y- variable has same value. Mostly   is considered when the data is square i.e. table with equal rows and columns and   is considered when the data is rectangle. The given below data is opinion about market tax among voters from different education levels.   a) The formula to calculate gamma is   Step 1: P is concordant pairs. The calculation steps to find the P value is as follows:     Step 2: Q is discordant pairs. The calculation steps to find the P value is as follows:     Step 3: Substitute P and Q value in gamma formula as shown below:   b) Formula to calculate   and   is as follows:   ;   Step 1 The calculation of tied pairs as part of calculating   and   , is as follows:   The formula to calculate   is as follows: (consider row totals)   The formula to calculate   is as follows: (consider column totals)   Step 2: The substitution of   and   values in the   formula is as follows: Total pairs (n) = 60   The calculation of   is as follows: m = smaller number of rows or columns   c) In this case, both   and   values are same or equal d) In general,   is considered for square data. As the rows and columns of this table are equal i.e. square,   is considered for this. is as follows: (consider row totals)
Goodman and kruskal gamma compares the concordant and discordant pairs and then it maximizes the denominator in order to standardize the outcome. Kendall's   and   is adjustment to the gamma. Kendall's   considers tied pairs, which occurs when X- variable and Y- variable has same value. Mostly   is considered when the data is square i.e. table with equal rows and columns and   is considered when the data is rectangle. The given below data is opinion about market tax among voters from different education levels.   a) The formula to calculate gamma is   Step 1: P is concordant pairs. The calculation steps to find the P value is as follows:     Step 2: Q is discordant pairs. The calculation steps to find the P value is as follows:     Step 3: Substitute P and Q value in gamma formula as shown below:   b) Formula to calculate   and   is as follows:   ;   Step 1 The calculation of tied pairs as part of calculating   and   , is as follows:   The formula to calculate   is as follows: (consider row totals)   The formula to calculate   is as follows: (consider column totals)   Step 2: The substitution of   and   values in the   formula is as follows: Total pairs (n) = 60   The calculation of   is as follows: m = smaller number of rows or columns   c) In this case, both   and   values are same or equal d) In general,   is considered for square data. As the rows and columns of this table are equal i.e. square,   is considered for this. The formula to calculate
Goodman and kruskal gamma compares the concordant and discordant pairs and then it maximizes the denominator in order to standardize the outcome. Kendall's   and   is adjustment to the gamma. Kendall's   considers tied pairs, which occurs when X- variable and Y- variable has same value. Mostly   is considered when the data is square i.e. table with equal rows and columns and   is considered when the data is rectangle. The given below data is opinion about market tax among voters from different education levels.   a) The formula to calculate gamma is   Step 1: P is concordant pairs. The calculation steps to find the P value is as follows:     Step 2: Q is discordant pairs. The calculation steps to find the P value is as follows:     Step 3: Substitute P and Q value in gamma formula as shown below:   b) Formula to calculate   and   is as follows:   ;   Step 1 The calculation of tied pairs as part of calculating   and   , is as follows:   The formula to calculate   is as follows: (consider row totals)   The formula to calculate   is as follows: (consider column totals)   Step 2: The substitution of   and   values in the   formula is as follows: Total pairs (n) = 60   The calculation of   is as follows: m = smaller number of rows or columns   c) In this case, both   and   values are same or equal d) In general,   is considered for square data. As the rows and columns of this table are equal i.e. square,   is considered for this. is as follows: (consider column totals)
Goodman and kruskal gamma compares the concordant and discordant pairs and then it maximizes the denominator in order to standardize the outcome. Kendall's   and   is adjustment to the gamma. Kendall's   considers tied pairs, which occurs when X- variable and Y- variable has same value. Mostly   is considered when the data is square i.e. table with equal rows and columns and   is considered when the data is rectangle. The given below data is opinion about market tax among voters from different education levels.   a) The formula to calculate gamma is   Step 1: P is concordant pairs. The calculation steps to find the P value is as follows:     Step 2: Q is discordant pairs. The calculation steps to find the P value is as follows:     Step 3: Substitute P and Q value in gamma formula as shown below:   b) Formula to calculate   and   is as follows:   ;   Step 1 The calculation of tied pairs as part of calculating   and   , is as follows:   The formula to calculate   is as follows: (consider row totals)   The formula to calculate   is as follows: (consider column totals)   Step 2: The substitution of   and   values in the   formula is as follows: Total pairs (n) = 60   The calculation of   is as follows: m = smaller number of rows or columns   c) In this case, both   and   values are same or equal d) In general,   is considered for square data. As the rows and columns of this table are equal i.e. square,   is considered for this. Step 2:
The substitution of
Goodman and kruskal gamma compares the concordant and discordant pairs and then it maximizes the denominator in order to standardize the outcome. Kendall's   and   is adjustment to the gamma. Kendall's   considers tied pairs, which occurs when X- variable and Y- variable has same value. Mostly   is considered when the data is square i.e. table with equal rows and columns and   is considered when the data is rectangle. The given below data is opinion about market tax among voters from different education levels.   a) The formula to calculate gamma is   Step 1: P is concordant pairs. The calculation steps to find the P value is as follows:     Step 2: Q is discordant pairs. The calculation steps to find the P value is as follows:     Step 3: Substitute P and Q value in gamma formula as shown below:   b) Formula to calculate   and   is as follows:   ;   Step 1 The calculation of tied pairs as part of calculating   and   , is as follows:   The formula to calculate   is as follows: (consider row totals)   The formula to calculate   is as follows: (consider column totals)   Step 2: The substitution of   and   values in the   formula is as follows: Total pairs (n) = 60   The calculation of   is as follows: m = smaller number of rows or columns   c) In this case, both   and   values are same or equal d) In general,   is considered for square data. As the rows and columns of this table are equal i.e. square,   is considered for this. and
Goodman and kruskal gamma compares the concordant and discordant pairs and then it maximizes the denominator in order to standardize the outcome. Kendall's   and   is adjustment to the gamma. Kendall's   considers tied pairs, which occurs when X- variable and Y- variable has same value. Mostly   is considered when the data is square i.e. table with equal rows and columns and   is considered when the data is rectangle. The given below data is opinion about market tax among voters from different education levels.   a) The formula to calculate gamma is   Step 1: P is concordant pairs. The calculation steps to find the P value is as follows:     Step 2: Q is discordant pairs. The calculation steps to find the P value is as follows:     Step 3: Substitute P and Q value in gamma formula as shown below:   b) Formula to calculate   and   is as follows:   ;   Step 1 The calculation of tied pairs as part of calculating   and   , is as follows:   The formula to calculate   is as follows: (consider row totals)   The formula to calculate   is as follows: (consider column totals)   Step 2: The substitution of   and   values in the   formula is as follows: Total pairs (n) = 60   The calculation of   is as follows: m = smaller number of rows or columns   c) In this case, both   and   values are same or equal d) In general,   is considered for square data. As the rows and columns of this table are equal i.e. square,   is considered for this. values in the
Goodman and kruskal gamma compares the concordant and discordant pairs and then it maximizes the denominator in order to standardize the outcome. Kendall's   and   is adjustment to the gamma. Kendall's   considers tied pairs, which occurs when X- variable and Y- variable has same value. Mostly   is considered when the data is square i.e. table with equal rows and columns and   is considered when the data is rectangle. The given below data is opinion about market tax among voters from different education levels.   a) The formula to calculate gamma is   Step 1: P is concordant pairs. The calculation steps to find the P value is as follows:     Step 2: Q is discordant pairs. The calculation steps to find the P value is as follows:     Step 3: Substitute P and Q value in gamma formula as shown below:   b) Formula to calculate   and   is as follows:   ;   Step 1 The calculation of tied pairs as part of calculating   and   , is as follows:   The formula to calculate   is as follows: (consider row totals)   The formula to calculate   is as follows: (consider column totals)   Step 2: The substitution of   and   values in the   formula is as follows: Total pairs (n) = 60   The calculation of   is as follows: m = smaller number of rows or columns   c) In this case, both   and   values are same or equal d) In general,   is considered for square data. As the rows and columns of this table are equal i.e. square,   is considered for this. formula is as follows:
Total pairs (n) = 60
Goodman and kruskal gamma compares the concordant and discordant pairs and then it maximizes the denominator in order to standardize the outcome. Kendall's   and   is adjustment to the gamma. Kendall's   considers tied pairs, which occurs when X- variable and Y- variable has same value. Mostly   is considered when the data is square i.e. table with equal rows and columns and   is considered when the data is rectangle. The given below data is opinion about market tax among voters from different education levels.   a) The formula to calculate gamma is   Step 1: P is concordant pairs. The calculation steps to find the P value is as follows:     Step 2: Q is discordant pairs. The calculation steps to find the P value is as follows:     Step 3: Substitute P and Q value in gamma formula as shown below:   b) Formula to calculate   and   is as follows:   ;   Step 1 The calculation of tied pairs as part of calculating   and   , is as follows:   The formula to calculate   is as follows: (consider row totals)   The formula to calculate   is as follows: (consider column totals)   Step 2: The substitution of   and   values in the   formula is as follows: Total pairs (n) = 60   The calculation of   is as follows: m = smaller number of rows or columns   c) In this case, both   and   values are same or equal d) In general,   is considered for square data. As the rows and columns of this table are equal i.e. square,   is considered for this. The calculation of
Goodman and kruskal gamma compares the concordant and discordant pairs and then it maximizes the denominator in order to standardize the outcome. Kendall's   and   is adjustment to the gamma. Kendall's   considers tied pairs, which occurs when X- variable and Y- variable has same value. Mostly   is considered when the data is square i.e. table with equal rows and columns and   is considered when the data is rectangle. The given below data is opinion about market tax among voters from different education levels.   a) The formula to calculate gamma is   Step 1: P is concordant pairs. The calculation steps to find the P value is as follows:     Step 2: Q is discordant pairs. The calculation steps to find the P value is as follows:     Step 3: Substitute P and Q value in gamma formula as shown below:   b) Formula to calculate   and   is as follows:   ;   Step 1 The calculation of tied pairs as part of calculating   and   , is as follows:   The formula to calculate   is as follows: (consider row totals)   The formula to calculate   is as follows: (consider column totals)   Step 2: The substitution of   and   values in the   formula is as follows: Total pairs (n) = 60   The calculation of   is as follows: m = smaller number of rows or columns   c) In this case, both   and   values are same or equal d) In general,   is considered for square data. As the rows and columns of this table are equal i.e. square,   is considered for this. is as follows:
m = smaller number of rows or columns
Goodman and kruskal gamma compares the concordant and discordant pairs and then it maximizes the denominator in order to standardize the outcome. Kendall's   and   is adjustment to the gamma. Kendall's   considers tied pairs, which occurs when X- variable and Y- variable has same value. Mostly   is considered when the data is square i.e. table with equal rows and columns and   is considered when the data is rectangle. The given below data is opinion about market tax among voters from different education levels.   a) The formula to calculate gamma is   Step 1: P is concordant pairs. The calculation steps to find the P value is as follows:     Step 2: Q is discordant pairs. The calculation steps to find the P value is as follows:     Step 3: Substitute P and Q value in gamma formula as shown below:   b) Formula to calculate   and   is as follows:   ;   Step 1 The calculation of tied pairs as part of calculating   and   , is as follows:   The formula to calculate   is as follows: (consider row totals)   The formula to calculate   is as follows: (consider column totals)   Step 2: The substitution of   and   values in the   formula is as follows: Total pairs (n) = 60   The calculation of   is as follows: m = smaller number of rows or columns   c) In this case, both   and   values are same or equal d) In general,   is considered for square data. As the rows and columns of this table are equal i.e. square,   is considered for this. c)
In this case, both
Goodman and kruskal gamma compares the concordant and discordant pairs and then it maximizes the denominator in order to standardize the outcome. Kendall's   and   is adjustment to the gamma. Kendall's   considers tied pairs, which occurs when X- variable and Y- variable has same value. Mostly   is considered when the data is square i.e. table with equal rows and columns and   is considered when the data is rectangle. The given below data is opinion about market tax among voters from different education levels.   a) The formula to calculate gamma is   Step 1: P is concordant pairs. The calculation steps to find the P value is as follows:     Step 2: Q is discordant pairs. The calculation steps to find the P value is as follows:     Step 3: Substitute P and Q value in gamma formula as shown below:   b) Formula to calculate   and   is as follows:   ;   Step 1 The calculation of tied pairs as part of calculating   and   , is as follows:   The formula to calculate   is as follows: (consider row totals)   The formula to calculate   is as follows: (consider column totals)   Step 2: The substitution of   and   values in the   formula is as follows: Total pairs (n) = 60   The calculation of   is as follows: m = smaller number of rows or columns   c) In this case, both   and   values are same or equal d) In general,   is considered for square data. As the rows and columns of this table are equal i.e. square,   is considered for this. and
Goodman and kruskal gamma compares the concordant and discordant pairs and then it maximizes the denominator in order to standardize the outcome. Kendall's   and   is adjustment to the gamma. Kendall's   considers tied pairs, which occurs when X- variable and Y- variable has same value. Mostly   is considered when the data is square i.e. table with equal rows and columns and   is considered when the data is rectangle. The given below data is opinion about market tax among voters from different education levels.   a) The formula to calculate gamma is   Step 1: P is concordant pairs. The calculation steps to find the P value is as follows:     Step 2: Q is discordant pairs. The calculation steps to find the P value is as follows:     Step 3: Substitute P and Q value in gamma formula as shown below:   b) Formula to calculate   and   is as follows:   ;   Step 1 The calculation of tied pairs as part of calculating   and   , is as follows:   The formula to calculate   is as follows: (consider row totals)   The formula to calculate   is as follows: (consider column totals)   Step 2: The substitution of   and   values in the   formula is as follows: Total pairs (n) = 60   The calculation of   is as follows: m = smaller number of rows or columns   c) In this case, both   and   values are same or equal d) In general,   is considered for square data. As the rows and columns of this table are equal i.e. square,   is considered for this. values are same or equal
d)
In general,
Goodman and kruskal gamma compares the concordant and discordant pairs and then it maximizes the denominator in order to standardize the outcome. Kendall's   and   is adjustment to the gamma. Kendall's   considers tied pairs, which occurs when X- variable and Y- variable has same value. Mostly   is considered when the data is square i.e. table with equal rows and columns and   is considered when the data is rectangle. The given below data is opinion about market tax among voters from different education levels.   a) The formula to calculate gamma is   Step 1: P is concordant pairs. The calculation steps to find the P value is as follows:     Step 2: Q is discordant pairs. The calculation steps to find the P value is as follows:     Step 3: Substitute P and Q value in gamma formula as shown below:   b) Formula to calculate   and   is as follows:   ;   Step 1 The calculation of tied pairs as part of calculating   and   , is as follows:   The formula to calculate   is as follows: (consider row totals)   The formula to calculate   is as follows: (consider column totals)   Step 2: The substitution of   and   values in the   formula is as follows: Total pairs (n) = 60   The calculation of   is as follows: m = smaller number of rows or columns   c) In this case, both   and   values are same or equal d) In general,   is considered for square data. As the rows and columns of this table are equal i.e. square,   is considered for this. is considered for square data. As the rows and columns of this table are equal i.e. square,
Goodman and kruskal gamma compares the concordant and discordant pairs and then it maximizes the denominator in order to standardize the outcome. Kendall's   and   is adjustment to the gamma. Kendall's   considers tied pairs, which occurs when X- variable and Y- variable has same value. Mostly   is considered when the data is square i.e. table with equal rows and columns and   is considered when the data is rectangle. The given below data is opinion about market tax among voters from different education levels.   a) The formula to calculate gamma is   Step 1: P is concordant pairs. The calculation steps to find the P value is as follows:     Step 2: Q is discordant pairs. The calculation steps to find the P value is as follows:     Step 3: Substitute P and Q value in gamma formula as shown below:   b) Formula to calculate   and   is as follows:   ;   Step 1 The calculation of tied pairs as part of calculating   and   , is as follows:   The formula to calculate   is as follows: (consider row totals)   The formula to calculate   is as follows: (consider column totals)   Step 2: The substitution of   and   values in the   formula is as follows: Total pairs (n) = 60   The calculation of   is as follows: m = smaller number of rows or columns   c) In this case, both   and   values are same or equal d) In general,   is considered for square data. As the rows and columns of this table are equal i.e. square,   is considered for this. is considered for this.
4
Using the table data in question 3, compute Somers's d symmetric and then use opinion as the dependent variable. Decide which approach is best for reporting the decision.
Unlock Deck
Unlock for access to all 13 flashcards in this deck.
Unlock Deck
k this deck
5
A research team conducted a study of soft-drink preferences among residents in a test market prior to an advertising campaign for a new cola product. Of the participants, 130 are teenagers and 130 are adults. The researchers secured the following results:
A research team conducted a study of soft-drink preferences among residents in a test market prior to an advertising campaign for a new cola product. Of the participants, 130 are teenagers and 130 are adults. The researchers secured the following results:   Calculate an appropriate measure of association, and decide how to present the results. How might this information affect the advertising agency
Calculate an appropriate measure of association, and decide how to present the results. How might this information affect the advertising agency
Unlock Deck
Unlock for access to all 13 flashcards in this deck.

Unlock Deck
k this deck
6
What would the numbers of "police calls resulting in arrest" for Gladeside and Oceanside need to change to in order to support the conclusion of "disparate impact"
Unlock Deck
Unlock for access to all 13 flashcards in this deck.

Unlock Deck
k this deck
7
Using the following data,
Using the following data,   a. Create a scatterplot. b. Find the least-squares line. c. Plot the line on the diagram. d. Predict: Y if X is 10 Y if X is 17.
a. Create a scatterplot.
b. Find the least-squares line.
c. Plot the line on the diagram.
d. Predict: Y if X is 10
Y if X is 17.
Unlock Deck
Unlock for access to all 13 flashcards in this deck.

Unlock Deck
k this deck
8
A home pregnancy test claims to be 97 percent accurate when consumers obtain a positive result. To what extent are the variables of "actual clinical condition" and "test readings" related
a. Compute phi, Cramer's V, and the contingency coefficients for the table below. What can you say about the strength of the relationship between the two variables
b. Compute lambda for these data. What does the statistic tell you
Actual Clinical Condition* Test Readings of In-Vitro Diagnostic Cross-Tabulation
A home pregnancy test claims to be 97 percent accurate when consumers obtain a positive result. To what extent are the variables of actual clinical condition and test readings related a. Compute phi, Cramer's V, and the contingency coefficients for the table below. What can you say about the strength of the relationship between the two variables b. Compute lambda for these data. What does the statistic tell you Actual Clinical Condition* Test Readings of In-Vitro Diagnostic Cross-Tabulation
Unlock Deck
Unlock for access to all 13 flashcards in this deck.

Unlock Deck
k this deck
9
Fill in the missing blocks for the ANOVA summary table on net profits and market value used with regression analysis.
Fill in the missing blocks for the ANOVA summary table on net profits and market value used with regression analysis.   a. What does the F tell you (alpha =.05) b. What is the t value Explain its meaning.
a. What does the F tell you (alpha =.05)
b. What is the t value Explain its meaning.
Unlock Deck
Unlock for access to all 13 flashcards in this deck.
Unlock Deck
k this deck
10
Secure Spearman rank-order correlations for the largest Pearson coefficient in the matrix from question 9. Explain the differences between the two findings.
Unlock Deck
Unlock for access to all 13 flashcards in this deck.
Unlock Deck
k this deck
11
Using the matrix data above (Forbes 500), select a pair of variables and run a simple regression. Then investigate the appropriateness of the model for the data using diagnostic tools for evaluating assumptions.
Unlock Deck
Unlock for access to all 13 flashcards in this deck.
Unlock Deck
k this deck
12
For the data below,
For the data below,   a. Calculate the correlation between X and Y. b. Interpret the sign of the correlation. c. Interpret the square of the correlation. d. Plot the least-squares line. e. Test for a linear relationship: (1) 1 = 0. (2) r = 0. (3) An F test.
a. Calculate the correlation between X and Y.
b. Interpret the sign of the correlation.
c. Interpret the square of the correlation.
d. Plot the least-squares line.
e. Test for a linear relationship:
(1) 1 = 0.
(2) r = 0.
(3) An F test.
Unlock Deck
Unlock for access to all 13 flashcards in this deck.
Unlock Deck
k this deck
13
"There is an 'unhealthy correlation' between the building of skyscrapers and subsequent financial crashes," according to Barclays Capital. Examples include: the world's first skyscraper, the Equitable Life building in New York (completed in 1873 and coincided with a five-year recession), the Empire State building (the Great Depression was under way), Chicago's Willis Tower- formerly known as the Sears Tower-in 1974 (during an oil shock and when the U.S. dollar's reliance on gold was abandoned), and Malaysia's Petronas Towers in 1997 (corresponding to the Asian financial crisis). Currently, the world's tallest skyscraper is the Burj Khalifa (built just before Dubai's financial troubles). China is the biggest builder of skyscrapers, with 53 percent of all the tall buildings in the world. JPMorgan Chase said that the Chinese property market could drop by as much as 20 percent in value in the country's major cities within the next 12 to 18 months. "Often the world's tallest buildings are... [a reflection of] a widespread misallocation of capital and an impending economic correction," Barclays Capital analysts said.
Examine the correlational finding and provide plausible alternatives for their findings.
Unlock Deck
Unlock for access to all 13 flashcards in this deck.
Unlock Deck
k this deck
locked card icon
Unlock Deck
Unlock for access to all 13 flashcards in this deck.