




 Chat with AI

Deck 17: Hypothesis Testing
Full screen (f)

Question

Question
Question
Question
Question
Question
Question
Question
Question
Question
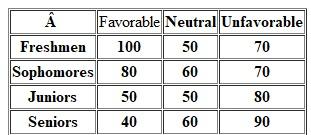
A random sample of students is interviewed to determine if there is an association between class and attitude toward corporations. With the following results, test the hypothesis that there is no difference among students on this attitude.
Question
Question
One-Koat Paint Company has developed a new type of porch paint that it hopes will be the most durable on the market. The R D group tests the new product against the two leading competing products by using a machine that scrubs until it wears through the coating. One-Koat runs five trials with each products and secures the following results (in thousands of scrubs):
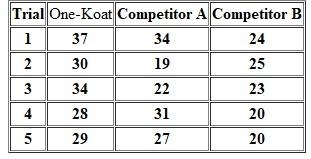
Test the hypothesis that there are no differences between the means of these products ( =.05).
Test the hypothesis that there are no differences between the means of these products ( =.05).
Question
Question

Unlock Deck
Sign up to unlock the cards in this deck!
Unlock Deck
Unlock Deck
1/14

Play

Full screen (f)
Deck 17: Hypothesis Testing
1
Distinguish between the following:
a) Parametric tests and nonparametric tests
b) Type I error and Type II error
c) Null hypothesis and alternative hypothesis.
d) Acceptance region and rejection region.
e) One-tailed tests and two-tailed tests.
f) Type II error and the power of the test
a) Parametric tests and nonparametric tests
b) Type I error and Type II error
c) Null hypothesis and alternative hypothesis.
d) Acceptance region and rejection region.
e) One-tailed tests and two-tailed tests.
f) Type II error and the power of the test
Hypothesis testing is performed to determine the behavior of the population data by performing the appropriate statistical test on the sample data derived from population
a.
The selection of appropriate statistical test depends on the number of sample sizes, type of measurement scale and also whether individual case is independent or related.
The statistical tests are classified into parametric and non-parametric. The difference between these two is that the parametric tests have more assumptions to be met unlike non parametric test. The population data in the parametric test is normally distributed but the population data is distribution free in the non-parametric test. Parametric test handles the interval and ratio data and non-parametric test handles nominal and ordinal data
b.
When a hypothesis test is performed, there is possible to occur two types of errors i.e. Type I and Type II.
The difference between these two errors is that type I error occurs when null hypothesis is rejected even if it is true and the type II error occurs if null hypothesis is not rejected when it is false. The risk of type I error can be lowered by using the lower alpha value.
The type II error is majorly depends on the power of the test performed. So, the risk of type II error can be lowered by choosing the powerful test, which is possible for large sample size.
c.
Hypothesis is defined in the beginning of the classical test of significance. Hypothesis is defined in two ways i.e. null hypothesis and alternative hypothesis.
The statement of the null hypothesis defines that there is no significance difference between two variables and the statement of the alternative hypothesis is that there is significance difference between two variables. The difference between these two hypotheses is that the statement of the null hypothesis is logically opposite to the statement of the alternative hypothesis. Mostly researcher tries to prove the statement of alternative hypothesis by rejecting the null hypothesis.
d.
The sample data collected for the hypothesis test is used to compute the test statistic. The test statistic value can fall in two regions i.e. region of acceptance and region of rejection.
The difference between the these two regions is that when the statistic falls in a specified range, which allows to accept the null hypothesis is called region of acceptance and when the statistic falls in a range, which allows to reject the null hypothesis, is called region of rejection.
e.
The region of rejection of the hypothesis can be either one tail or two tail test.
The difference between these two is that if the rejection region is on one side of the sampling distribution then it is one tail test but if the rejection region is on both side of the sampling distribution then it is two tail tests. For example: if the alternative hypothesis states that mean value is greater than 6, then it is one tail test. If the alternative hypothesis states that mean value can be either greater or less than 6, then rejection region consists numbers greater than 6 and also less than 6.
a.
The selection of appropriate statistical test depends on the number of sample sizes, type of measurement scale and also whether individual case is independent or related.
The statistical tests are classified into parametric and non-parametric. The difference between these two is that the parametric tests have more assumptions to be met unlike non parametric test. The population data in the parametric test is normally distributed but the population data is distribution free in the non-parametric test. Parametric test handles the interval and ratio data and non-parametric test handles nominal and ordinal data
b.
When a hypothesis test is performed, there is possible to occur two types of errors i.e. Type I and Type II.
The difference between these two errors is that type I error occurs when null hypothesis is rejected even if it is true and the type II error occurs if null hypothesis is not rejected when it is false. The risk of type I error can be lowered by using the lower alpha value.
The type II error is majorly depends on the power of the test performed. So, the risk of type II error can be lowered by choosing the powerful test, which is possible for large sample size.
c.
Hypothesis is defined in the beginning of the classical test of significance. Hypothesis is defined in two ways i.e. null hypothesis and alternative hypothesis.
The statement of the null hypothesis defines that there is no significance difference between two variables and the statement of the alternative hypothesis is that there is significance difference between two variables. The difference between these two hypotheses is that the statement of the null hypothesis is logically opposite to the statement of the alternative hypothesis. Mostly researcher tries to prove the statement of alternative hypothesis by rejecting the null hypothesis.
d.
The sample data collected for the hypothesis test is used to compute the test statistic. The test statistic value can fall in two regions i.e. region of acceptance and region of rejection.
The difference between the these two regions is that when the statistic falls in a specified range, which allows to accept the null hypothesis is called region of acceptance and when the statistic falls in a range, which allows to reject the null hypothesis, is called region of rejection.
e.
The region of rejection of the hypothesis can be either one tail or two tail test.
The difference between these two is that if the rejection region is on one side of the sampling distribution then it is one tail test but if the rejection region is on both side of the sampling distribution then it is two tail tests. For example: if the alternative hypothesis states that mean value is greater than 6, then it is one tail test. If the alternative hypothesis states that mean value can be either greater or less than 6, then rejection region consists numbers greater than 6 and also less than 6.
2
Summarize the steps of hypothesis testing. What is the virtue of this procedure
Hypothesis testing is performed to determine the behavior of the population data by performing the appropriate statistical test on the sample data derived from population.
Hypothesis testing is a six step procedure. The summary of these steps is as follows:
• Construct the null hypothesis and alternative hypothesis based on the problem statement. Null hypothesis states that there exists no difference and alternative hypothesis states that there exists difference.
• Select the appropriate statistical test (i.e. parametric or non-parametric tests) based on the assumptions, size of data and measurement.
• Determine the level of confidence i.e. alpha value. The most frequently used level of confidence is 0.5
• Further, obtain the calculated value by doing necessary calculations and computations using the formula.
• Further, obtain the critical value or table value (i.e. p- value) by referring to the appropriate table.
• Finally, make the conclusion whether to reject null hypothesis or alternative hypothesis. In general, if the calculated value is greater than p-value, then null hypothesis is rejected.
The virtue of the hypothesis testing procedure is useful to decide the accuracy of hypothesis because the assumptions are based on population and the test is performed on sample data.
Hypothesis testing is a six step procedure. The summary of these steps is as follows:
• Construct the null hypothesis and alternative hypothesis based on the problem statement. Null hypothesis states that there exists no difference and alternative hypothesis states that there exists difference.
• Select the appropriate statistical test (i.e. parametric or non-parametric tests) based on the assumptions, size of data and measurement.
• Determine the level of confidence i.e. alpha value. The most frequently used level of confidence is 0.5
• Further, obtain the calculated value by doing necessary calculations and computations using the formula.
• Further, obtain the critical value or table value (i.e. p- value) by referring to the appropriate table.
• Finally, make the conclusion whether to reject null hypothesis or alternative hypothesis. In general, if the calculated value is greater than p-value, then null hypothesis is rejected.
The virtue of the hypothesis testing procedure is useful to decide the accuracy of hypothesis because the assumptions are based on population and the test is performed on sample data.
3
In analysis of variance, what is the purpose of the mean square between and the mean square within If the null hypothesis is accepted, what do these qualities look like
Anova, which is also known as analysis of variance, is the method used to find the difference between the means of two or three groups in the sample.
In Anova, every group has its own mean, where the values in that group deviate from that mean. Grand mean is generated by all the data points of sample i.e. from all of the groups. Total variation is calculated by the sum of the squared difference between grand mean and each data point.
The total variation is divided into mean square between and mean square within. The mean square within is the variance in the population (i.e. overall), and mean square between is the variance in each group. The purpose of mean square of within ad mean square between is to calculate the F- statistic which determines whether the mean values of each group are significant or not. F - Statistic is calculated by dividing mean square between and mean square within.
The acceptance or rejection of null hypothesis is based on the F- value and significance level. If the null hypothesis is accepted, then it is concluded that there is no significance difference between population means. Thus, F- ratio value would be close to 1.
In Anova, every group has its own mean, where the values in that group deviate from that mean. Grand mean is generated by all the data points of sample i.e. from all of the groups. Total variation is calculated by the sum of the squared difference between grand mean and each data point.
The total variation is divided into mean square between and mean square within. The mean square within is the variance in the population (i.e. overall), and mean square between is the variance in each group. The purpose of mean square of within ad mean square between is to calculate the F- statistic which determines whether the mean values of each group are significant or not. F - Statistic is calculated by dividing mean square between and mean square within.
The acceptance or rejection of null hypothesis is based on the F- value and significance level. If the null hypothesis is accepted, then it is concluded that there is no significance difference between population means. Thus, F- ratio value would be close to 1.
4
Describe the assumptions for ANOVA, and explain how they may be diagnosed.
Unlock Deck
Unlock for access to all 14 flashcards in this deck.
Unlock Deck
k this deck
5
Suggest situations where the researcher should be more concerned with Type II error than with Type I error.
a. How can the probability of a Type I error be reduced A Type II error
b. How does practical significance differ from statistical significance
c. Suppose you interview all the members of the freshman and senior classes and find that 65 percent of the freshmen and 62 percent of the seniors favor a proposal to send Help Centers offshore. Is this difference significant
a. How can the probability of a Type I error be reduced A Type II error
b. How does practical significance differ from statistical significance
c. Suppose you interview all the members of the freshman and senior classes and find that 65 percent of the freshmen and 62 percent of the seniors favor a proposal to send Help Centers offshore. Is this difference significant
Unlock Deck
Unlock for access to all 14 flashcards in this deck.
Unlock Deck
k this deck
6
What hypothesis testing procedure would you use in the following situations
a) A test classifies applicants as accepted or rejected. On the basis of data on 200 applicants, we test the hypothesis that ad placement success is not related to gender.
b) A company manufacturers and markets automobiles in two different countries. We want to know if the gas mileage is the same for vehicles from both facilities. There are samples of 45 units from each facility.
c) A company has three categories of marketing analysts: (1) with professional qualifications but without work experience, (2) with professional qualifications and with work experience, and (3) without professional qualifications but with work experience. A study exists that measures each analyst's motivation level (classified as high, normal, and low). A hypothesis of no relation between analyst category and motivation to be tested.
d) A company has 24 salespersons. The test must evaluate whether their sales performance is unchanged or has improved after a training program.
e) A company has to evaluate whether it should attribute increased sales to product quality, advertising, or an interaction of product quality and advertising.
a) A test classifies applicants as accepted or rejected. On the basis of data on 200 applicants, we test the hypothesis that ad placement success is not related to gender.
b) A company manufacturers and markets automobiles in two different countries. We want to know if the gas mileage is the same for vehicles from both facilities. There are samples of 45 units from each facility.
c) A company has three categories of marketing analysts: (1) with professional qualifications but without work experience, (2) with professional qualifications and with work experience, and (3) without professional qualifications but with work experience. A study exists that measures each analyst's motivation level (classified as high, normal, and low). A hypothesis of no relation between analyst category and motivation to be tested.
d) A company has 24 salespersons. The test must evaluate whether their sales performance is unchanged or has improved after a training program.
e) A company has to evaluate whether it should attribute increased sales to product quality, advertising, or an interaction of product quality and advertising.
Unlock Deck
Unlock for access to all 14 flashcards in this deck.
Unlock Deck
k this deck
7
You conduct a survey of a sample of 25 members of this year's graduating business students and find that the average GPA is 3.2. The standard deviation of the sample is 0.4. Over the last 10 years, the average GPA has been 3.0. Is the GPA of this year's students significantly different from the long-run average At what alpha level would it be significant
Unlock Deck
Unlock for access to all 14 flashcards in this deck.
Unlock Deck
k this deck
8
You are curious about whether the professors and students at your school are of different political persuasions, so you take a sample of 20 professors and 20 students drawn randomly from each population. You find that 10 professors say they are conservative, and 6 students say they are conservative. Is this a statistically significant difference
Unlock Deck
Unlock for access to all 14 flashcards in this deck.
Unlock Deck
k this deck
9
You contact a random sample of 36 graduates of Western University and learn that their starting salaries averaged $28,000 last year. You then contact a random sample of 40 graduates from Eastern University and find that their average starting salary was $28,800. In each case, the standard deviation of the sample was $1,000.
a) Test the null hypothesis that there is no difference between average salaries received by the graduates of the two schools.
b) What assumptions are necessary for this test
a) Test the null hypothesis that there is no difference between average salaries received by the graduates of the two schools.
b) What assumptions are necessary for this test
Unlock Deck
Unlock for access to all 14 flashcards in this deck.
Unlock Deck
k this deck
10
A random sample of students is interviewed to determine if there is an association between class and attitude toward corporations. With the following results, test the hypothesis that there is no difference among students on this attitude.
Unlock Deck
Unlock for access to all 14 flashcards in this deck.
Unlock Deck
k this deck
11
You do a survey of business students and liberal arts school students to find out how many times a week they read a daily newspaper. In each case, you interview 100 students. You find the following:
x m = 4.5 times per week
S m = 1.5
x la = 5.6 times per week
S la = - 2.0
Test the hypothesis that there is no significant difference between these two samples.
x m = 4.5 times per week
S m = 1.5
x la = 5.6 times per week
S la = - 2.0
Test the hypothesis that there is no significant difference between these two samples.
Unlock Deck
Unlock for access to all 14 flashcards in this deck.
Unlock Deck
k this deck
12
One-Koat Paint Company has developed a new type of porch paint that it hopes will be the most durable on the market. The R D group tests the new product against the two leading competing products by using a machine that scrubs until it wears through the coating. One-Koat runs five trials with each products and secures the following results (in thousands of scrubs):
Test the hypothesis that there are no differences between the means of these products ( =.05).
Test the hypothesis that there are no differences between the means of these products ( =.05).
Unlock Deck
Unlock for access to all 14 flashcards in this deck.
Unlock Deck
k this deck
13
A computer manufacturer is introducing a new product specifically targeted at the home market and wishes to compare the effectiveness of three sales strategies: computer stores, home electronics stores, and department stores. Numbers of sales by 15 salespeople are recorded below:
Electronics store: 5, 4, 3, 3, 3
Department store: 9, 7, 8, 6, 5
Computer store: 7, 4, 8, 4, 3
a) Test the hypothesis that there is no difference between the means of the retailers ( =.05).
b) Select a multiple comparison test, if necessary, to determine which groups differ in mean sales ( =.05).
Electronics store: 5, 4, 3, 3, 3
Department store: 9, 7, 8, 6, 5
Computer store: 7, 4, 8, 4, 3
a) Test the hypothesis that there is no difference between the means of the retailers ( =.05).
b) Select a multiple comparison test, if necessary, to determine which groups differ in mean sales ( =.05).
Unlock Deck
Unlock for access to all 14 flashcards in this deck.
Unlock Deck
k this deck
14
Employers, military, and colleges use aptitude tests to predict how well someone might perform. Recently, critics have said there isn' t much difference in performance above a certain level - that everyone is more or less the same. Now, in a current issue of Psychological Science , the authors of a new study find that this isn t true. Instead, the higher your score, the better you perform later. The investigation considered four large studies of people who have taken aptitude tests: the College Board s SAT scores for 150,000 students entering 110 colleges and their freshman GPA. The Army collected 5,000 scores for the Armed Services Vocational Aptitude Battery and later appraised candidates on how well they did their jobs. Two additional data sets contained students' performance on tests in high school and their grades in college. The higher the test scores, the better the subsequent performance. Suggest alternative hypotheses that could equally explain this finding.
Unlock Deck
Unlock for access to all 14 flashcards in this deck.
Unlock Deck
k this deck
Unlock Deck
Unlock for access to all 14 flashcards in this deck.