Deck 13: The Balanced Scorecard: Strategic-Based Control
Full screen (f)
Question
Question
Question
Question
Question
Question
Question
Question
Question
Question
Question
Question
Question
Question
Question
Question
Question
Question
Question
Question
Question
Question
Question
Question
Scorecard Measures, Strategy Translation
At the end of 2012, Mejorar Company implemented a low-cost strategy to improve its competitive position. Its objective was to become the low-cost producer in its industry. A Balanced Scorecard was developed to guide the company toward this objective. To lower costs, Mejorar undertook a number of improvement activities such as JIT production, total quality management, and activity-based management. Now, after two years of operation, the president of Mejorar wants some assessment of the achievements. To help provide this assessment, the following information on one product has been gathered:

Required:
1. Compute the following measures for 2012 and 2014:
a. Actual velocity and cycle time
b. Percentage of total revenue from new customers (assume one unit per customer)
c. Percentage of very satisfied customers (assume each customer purchases one unit)
d. Market share
e. Percentage change in actual product cost (for 2014 only)
f. Percentage change in days of inventory (for 2014 only)
g. Defective units as a percentage of total units produced
h. Total hours of training
i. Suggestions per production worker
j. Total revenue
k. Number of new customers
2. For the measures listed in Requirement 1, list likely strategic objectives, classified according to the four Balance Scorecard perspectives. Assume there is one measure per objective.
At the end of 2012, Mejorar Company implemented a low-cost strategy to improve its competitive position. Its objective was to become the low-cost producer in its industry. A Balanced Scorecard was developed to guide the company toward this objective. To lower costs, Mejorar undertook a number of improvement activities such as JIT production, total quality management, and activity-based management. Now, after two years of operation, the president of Mejorar wants some assessment of the achievements. To help provide this assessment, the following information on one product has been gathered:
Required:
1. Compute the following measures for 2012 and 2014:
a. Actual velocity and cycle time
b. Percentage of total revenue from new customers (assume one unit per customer)
c. Percentage of very satisfied customers (assume each customer purchases one unit)
d. Market share
e. Percentage change in actual product cost (for 2014 only)
f. Percentage change in days of inventory (for 2014 only)
g. Defective units as a percentage of total units produced
h. Total hours of training
i. Suggestions per production worker
j. Total revenue
k. Number of new customers
2. For the measures listed in Requirement 1, list likely strategic objectives, classified according to the four Balance Scorecard perspectives. Assume there is one measure per objective.
Question
Question
Question
Question
Question
Question
Question
Question
Question
Question
Question
Question
MCE, Testable Strategy, Strategy Map
Auflegger, Inc., manufactures a product that experiences the following activities (and times):
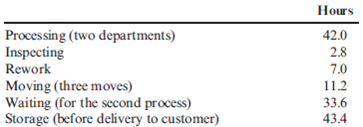
Required:
1. Compute the MCE for this product.
2. A study lists the following root causes of the inefficiencies: poor quality components from suppliers, lack of skilled workers, and plant layout. Suggest a possible cost reduction strategy, expressed as a series of if-then statements that will reduce MCE and lower costs. Finally, prepare a strategy map that illustrates the causal paths. In preparing the map, use only three perspectives: learning and growth, process, and financial.
3. Is MCE a lag or a lead measure? If and when MCE acts as a lag measure, what lead measures would affect it?
Auflegger, Inc., manufactures a product that experiences the following activities (and times):
Required:
1. Compute the MCE for this product.
2. A study lists the following root causes of the inefficiencies: poor quality components from suppliers, lack of skilled workers, and plant layout. Suggest a possible cost reduction strategy, expressed as a series of if-then statements that will reduce MCE and lower costs. Finally, prepare a strategy map that illustrates the causal paths. In preparing the map, use only three perspectives: learning and growth, process, and financial.
3. Is MCE a lag or a lead measure? If and when MCE acts as a lag measure, what lead measures would affect it?
Question
Question
Question
Cycle Time, Velocity, Product Costing
Mulhall, Inc., has a JIT system in place. Each manufacturing cell is dedicated to the production of a single product or major subassembly. One cell, dedicated to the production of mopeds, has four operations: machining, finishing, assembly, and qualifying (testing). The machining process is automated, using computers. In this process, the model's frame and engine are constructed. In finishing, the frame is sandblasted, buffed, and painted. In assembly, the frame and engine are assembled. Finally, each model is tested to ensure operational capability.
For the coming year, the moped cell has the following budgeted costs and cell time (both at theoretical capacity):
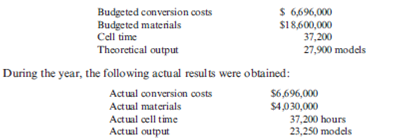
Required:
1. Compute the velocity (number of models per hour) that the cell can theoretically achieve. Now, compute the theoretical cycle time (number of hours or minutes per model) that it takes to produce one model.
2. Compute the actual velocity and the actual cycle time.
3. Compute MCE. Comment on the efficiency of the operation.
4. Compute the budgeted conversion cost per minute. Using this rate, compute the conversion cost per model if theoretical output is achieved. Using this measure, compute the conversion cost per model for actual output. Does this product costing approach provide an incentive for the cell manager to reduce cycle time? Explain
Mulhall, Inc., has a JIT system in place. Each manufacturing cell is dedicated to the production of a single product or major subassembly. One cell, dedicated to the production of mopeds, has four operations: machining, finishing, assembly, and qualifying (testing). The machining process is automated, using computers. In this process, the model's frame and engine are constructed. In finishing, the frame is sandblasted, buffed, and painted. In assembly, the frame and engine are assembled. Finally, each model is tested to ensure operational capability.
For the coming year, the moped cell has the following budgeted costs and cell time (both at theoretical capacity):
Required:
1. Compute the velocity (number of models per hour) that the cell can theoretically achieve. Now, compute the theoretical cycle time (number of hours or minutes per model) that it takes to produce one model.
2. Compute the actual velocity and the actual cycle time.
3. Compute MCE. Comment on the efficiency of the operation.
4. Compute the budgeted conversion cost per minute. Using this rate, compute the conversion cost per model if theoretical output is achieved. Using this measure, compute the conversion cost per model for actual output. Does this product costing approach provide an incentive for the cell manager to reduce cycle time? Explain
Question
Question
Question
Balanced Scorecard, Non-Value-Added Activities, Strategy Translation, Kaizen Costing
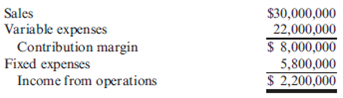
At the beginning of the last quarter of 2013, Youngston, Inc., a consumer products firm, hired Maria Carrillo to take over one of its divisions. The division manufactured small home appliances and was struggling to survive in a very competitive market. Maria immediately requested a projected income statement for 2013. In response, the controller provided the following statement:
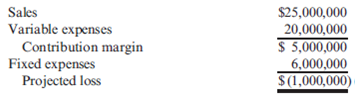
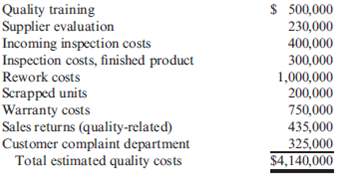
After some investigation, Maria soon realized that the products being produced had a serious problem with quality. She once again requested a special study by the controller's office to supply a report on the level of quality costs. By the middle of November, Maria received the following report from the controller:
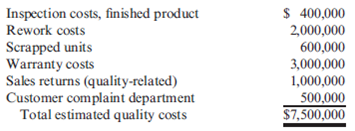
Maria was surprised at the level of quality costs. They represented 30 percent of sales, which was certainly excessive. She knew that the division had to produce high-quality products to survive. The number of defective units produced needed to be reduced dramatically. Thus, Maria decided to pursue a quality-driven turnaround strategy. Revenue growth and cost reduction could both be achieved if quality could be improved. By growing revenues and decreasing costs, profitability could be increased.
After meeting with the managers of production, marketing, purchasing, and human resources, Maria made the following decisions, effective immediately (end of November 2013):
a. More will be invested in employee training. Workers will be trained to detect quality problems and empowered to make improvements. Workers will be allowed a bonus of 10 percent of any cost savings produced by their suggested improvements.
b. Two design engineers will be hired immediately, with expectations of hiring one or two more within a year. These engineers will be in charge of redesigning processes and products with the objective of improving quality. They will also be given the responsibility of working with selected suppliers to help improve the quality of their products and processes. Design engineers were considered a strategic necessity.
c. Implement a new process: evaluation and selection of suppliers. This new process has the objective of selecting a group of suppliers that are willing and capable of providing nonde-fective components.
d. Effective immediately, the division will begin inspecting purchased components. According to production, many of the quality problems are caused by defective components purchased from outside suppliers. Incoming inspection is viewed as a transitional activity. Once the division has developed a group of suppliers capable of delivering nondefective components, this activity will be eliminated.
e. Within three years, the goal is to produce products with a defect rate less than 0.10 percent. By reducing the defect rate to this level, marketing is confident that market share will increase by at least 50 percent (as a consequence of increased customer satisfaction). Products with better quality will help establish an improved product image and reputation, allowing the division to capture new customers and increase market share.
f. Accounting will be given the charge to install a quality information reporting system. Daily reports on operational quality data (e.g., percentage of defective units), weekly updates of trend graphs (posted throughout the division), and quarterly cost reports are the types of information required.
g. To help direct the improvements in quality activities, kaizen costing is to be implemented. For example, for the year 2013, a kaizen standard of 6 percent of the selling price per unit was set for rework costs, a 25 percent reduction from the current actual cost.
To ensure that the quality improvements were directed and translated into concrete financial outcomes, Maria also began to implement a Balanced Scorecard for the division. By the end of 2014, progress was being made. Sales had increased to $26,000,000, and the kaizen improvements were meeting or beating expectations. For example, rework costs had dropped to $1,500,000.
At the end of 2015, two years after the turnaround quality strategy was implemented, Maria received the following quality cost report:
Maria also received an income statement for 2015:
Maria was pleased with the outcomes. Revenues had grown, and costs had been reduced by at least as much as she had projected for the two-year period. Growth next year should be even greater as she was beginning to observe a favorable effect from the higher-quality products. Also, further quality cost reductions should materialize as incoming inspections were showing much higher-quality purchased components.
Required:
1. Identify the strategic objectives, classified by the Balanced Scorecard perspective. Next, suggest measures for each objective.
2. Using the results from Requirement 1, describe Maria's strategy using a series of if-then statements. Next, prepare a strategy map.
3. Explain how you would evaluate the success of the quality-driven turnaround strategy. What additional information would you like to have for this evaluation?
4. Explain why Maria felt that the Balanced Scorecard would increase the likelihood that the turnaround strategy would actually produce good financial outcomes.
5. Advise Maria on how to encourage her employees to align their actions and behavior with the turnaround strategy.
At the beginning of the last quarter of 2013, Youngston, Inc., a consumer products firm, hired Maria Carrillo to take over one of its divisions. The division manufactured small home appliances and was struggling to survive in a very competitive market. Maria immediately requested a projected income statement for 2013. In response, the controller provided the following statement:
After some investigation, Maria soon realized that the products being produced had a serious problem with quality. She once again requested a special study by the controller's office to supply a report on the level of quality costs. By the middle of November, Maria received the following report from the controller:
Maria was surprised at the level of quality costs. They represented 30 percent of sales, which was certainly excessive. She knew that the division had to produce high-quality products to survive. The number of defective units produced needed to be reduced dramatically. Thus, Maria decided to pursue a quality-driven turnaround strategy. Revenue growth and cost reduction could both be achieved if quality could be improved. By growing revenues and decreasing costs, profitability could be increased.
After meeting with the managers of production, marketing, purchasing, and human resources, Maria made the following decisions, effective immediately (end of November 2013):
a. More will be invested in employee training. Workers will be trained to detect quality problems and empowered to make improvements. Workers will be allowed a bonus of 10 percent of any cost savings produced by their suggested improvements.
b. Two design engineers will be hired immediately, with expectations of hiring one or two more within a year. These engineers will be in charge of redesigning processes and products with the objective of improving quality. They will also be given the responsibility of working with selected suppliers to help improve the quality of their products and processes. Design engineers were considered a strategic necessity.
c. Implement a new process: evaluation and selection of suppliers. This new process has the objective of selecting a group of suppliers that are willing and capable of providing nonde-fective components.
d. Effective immediately, the division will begin inspecting purchased components. According to production, many of the quality problems are caused by defective components purchased from outside suppliers. Incoming inspection is viewed as a transitional activity. Once the division has developed a group of suppliers capable of delivering nondefective components, this activity will be eliminated.
e. Within three years, the goal is to produce products with a defect rate less than 0.10 percent. By reducing the defect rate to this level, marketing is confident that market share will increase by at least 50 percent (as a consequence of increased customer satisfaction). Products with better quality will help establish an improved product image and reputation, allowing the division to capture new customers and increase market share.
f. Accounting will be given the charge to install a quality information reporting system. Daily reports on operational quality data (e.g., percentage of defective units), weekly updates of trend graphs (posted throughout the division), and quarterly cost reports are the types of information required.
g. To help direct the improvements in quality activities, kaizen costing is to be implemented. For example, for the year 2013, a kaizen standard of 6 percent of the selling price per unit was set for rework costs, a 25 percent reduction from the current actual cost.
To ensure that the quality improvements were directed and translated into concrete financial outcomes, Maria also began to implement a Balanced Scorecard for the division. By the end of 2014, progress was being made. Sales had increased to $26,000,000, and the kaizen improvements were meeting or beating expectations. For example, rework costs had dropped to $1,500,000.
At the end of 2015, two years after the turnaround quality strategy was implemented, Maria received the following quality cost report:
Maria also received an income statement for 2015:
Maria was pleased with the outcomes. Revenues had grown, and costs had been reduced by at least as much as she had projected for the two-year period. Growth next year should be even greater as she was beginning to observe a favorable effect from the higher-quality products. Also, further quality cost reductions should materialize as incoming inspections were showing much higher-quality purchased components.
Required:
1. Identify the strategic objectives, classified by the Balanced Scorecard perspective. Next, suggest measures for each objective.
2. Using the results from Requirement 1, describe Maria's strategy using a series of if-then statements. Next, prepare a strategy map.
3. Explain how you would evaluate the success of the quality-driven turnaround strategy. What additional information would you like to have for this evaluation?
4. Explain why Maria felt that the Balanced Scorecard would increase the likelihood that the turnaround strategy would actually produce good financial outcomes.
5. Advise Maria on how to encourage her employees to align their actions and behavior with the turnaround strategy.

Unlock Deck
Sign up to unlock the cards in this deck!
Unlock Deck
Unlock Deck
1/42
Play
Full screen (f)
Deck 13: The Balanced Scorecard: Strategic-Based Control
1
What are stretch targets? What is their strategic purpose?
Stretch targets:
In commercial language a target is a goal which is set in advance and is supposed to be achieved on predetermined time period or in normal course of action. Stretch targets are defined as targets which are created at different stages and if they are attained as per the plans designed in advance, they will transform the company in a time span of four to five years.
Therefore, we can say stretch targets are the targets which if not achieved at one level can be achieved at another and once it is achieved, it will transform the company. In fact, it is great and crucial stage of success and an employee is supposed to get it in order to prove that he is performing his job up to the satisfaction of the employer that is company.
The strategic purpose of stretch targets is to achieve the level of success set by the organization and created by the strategy. In fact strategic targets are set to achieve the high level of success which is very much important for the growth and transformation of the company.
No doubt stretch targets are difficult to achieve, however, their achievement is very important for the growth and survival of organization.
2
What is meant by double-loop feedback?
Double-loop feedback:
Double-loop feedback is defined as the information received about the strategy, which is related with the adoption, effectiveness of strategy and the durability of the factors on which the strategy is based.
Simply speaking, it is a normal feedback received in response of implementation of the strategy along with the stability of underlying aspects of the strategy.
3
Activity-Based Responsibility Accounting versus Strategic-Based Responsibility Accounting
The Balanced Scorecard is an approach that has the objective of driving change. Performance evaluation is an integral part of this effort. Performance evaluation within the Balanced Scorecard framework is also concerned with the effectiveness and viability of the organization's strategy.
Required:
1. Describe how the Balanced Scorecard is used to drive organizational change.
2. Explain how performance evaluation is used to assess the effectiveness and viability of an organization's strategy.
1.Organizational change takes place by adopting stretch targets and these are established at all specified stages, if attained, then organization will be transformed. All four perspectives are included for establishing these targets.
The measures are interconnected by temporary relationships due to the feasibility of stretch targets. Moreover, due to interconnection of measures, mutual targets are established for all measures.
2.Effectiveness and viability of organizational strategy is evaluated by double loop feedback. Illustration of strategy is based upon the procedure if-then profarma by taking into account the underlying temporal relations.
If the result could be predicted, then there is occurrence of evidence that favors effectiveness and viability. And in case the result is other but not predicted, then the strategy have not been adopted in accordance with planning or other reason will be its viability.
In case lead measures do not attain the values planned, then there are hypothetical circumstances pertaining to effectiveness. If the lead measures achieve the values planned and the result is unable to materialize, then there is problem in the viability of the strategy.
4
Balanced Scorecard, Strategic Alignment
Refer to Exercise 13.13. Suppose that Mandy communicates the following weights to her CEO:
Perspective: Financial, 40%; Customer, 20%; Process, 20%; Learning growth, 20%
Financial objectives: Profits, 50%; Revenues, 25%; Costs, 25%
Customer objectives: Customer satisfaction, 60%; Market share, 40%
Process objectives: Defects decrease, 40%; Supplier selection, 30%; Redesign process, 30%
Learning growth objective: Training, 100%
Mandy next sets up a bonus pool of $100,000 and indicates that the weighting scheme just described will be used to determine the amount of potential bonus for each perspective and each objective.
Required:
1. Calculate the potential bonus for each perspective and objective.
2. Describe how Mandy might award actual bonuses so that her managers will be encouraged to implement the Balanced Scorecard.
3. What are some other ways that Mandy can encourage alignment with the company's strategic objectives (other than incentive compensation)?
Unlock Deck
Unlock for access to all 42 flashcards in this deck.
Unlock Deck
k this deck
5
How does the reward system for a strategic-based system differ from the traditional approach?
Unlock Deck
Unlock for access to all 42 flashcards in this deck.
Unlock Deck
k this deck
6
In a balanced scorecard, a key strategic if-then statement is provided: if the number of defective units decreases, then market share will increase. Assume that the targeted reduction level of defective units was achieved but that the targeted market share increase was not achieved. Which statement best describes this outcome? a. The company has not successfully implemented its strategic plan.
B) Single-loop feedback is needed.
C) The hypothesized relationship is somehow invalid.
D) Corrective action must be taken so that the strategy can be executed as intended.
B) Single-loop feedback is needed.
C) The hypothesized relationship is somehow invalid.
D) Corrective action must be taken so that the strategy can be executed as intended.
Unlock Deck
Unlock for access to all 42 flashcards in this deck.
Unlock Deck
k this deck
7
Balanced Scorecard, Perspectives, Classification of Performance Measures
Consider the following list of scorecard measures:
a. Product profitability
b. Ratings from customer surveys
c. Number of patents pending
d. Strategic job coverage ratio
e. Revenue per employee
f. Quality costs
g. Percentage of market
h. Employee turnover percentages
i. First-pass yields
j. On-time delivery percentage
k. Percentage of revenues from new sources
l. Economic value added
Required:
Classify each measure according to the following: perspective, financial or nonfinancial, subjective or objective, and external or internal. When the perspective is process, identify which type of process: innovation, operations, or post-sales service.
Unlock Deck
Unlock for access to all 42 flashcards in this deck.
Unlock Deck
k this deck
8
Identify and explain three methods for achieving strategic alignment.
Unlock Deck
Unlock for access to all 42 flashcards in this deck.
Unlock Deck
k this deck
9
What are the three strategic themes of the financial perspective?
Unlock Deck
Unlock for access to all 42 flashcards in this deck.
Unlock Deck
k this deck
10
(2011 CPA Exam, adapted)
Which of the following is one of the four perspectives of the Balanced Scorecard?
a. Just in Time
b. Process
c. Benchmarking
d. Activity-Based Costing
Which of the following is one of the four perspectives of the Balanced Scorecard?
a. Just in Time
b. Process
c. Benchmarking
d. Activity-Based Costing
Unlock Deck
Unlock for access to all 42 flashcards in this deck.
Unlock Deck
k this deck
11
Cycle Time and Conversion Cost per Unit
Hatch Manufacturing produces multiple machine parts. The theoretical cycle time for one of its products is 65 minutes per unit. The budgeted conversion costs for the manufacturing cell dedicated to the product are $12,960,000 per year. The total labor minutes available are 1,440,000. During the year, the cell was able to produce 0.6 units of the product per hour. Suppose also that production incentives exist to minimize unit product costs.
Required:
1. Compute the theoretical conversion cost per unit.
2. Compute the applied conversion cost per minute (the amount of conversion cost actually assigned to the product).
3. Discuss how this approach to assigning conversion cost can improve delivery time performance. Explain how conversion cost acts as a performance driver for on-time deliveries.
Unlock Deck
Unlock for access to all 42 flashcards in this deck.
Unlock Deck
k this deck
12
A manufacturing cell produces 40 units in five hours. What is the cycle time for the manufacturing cell? a. 8 units per hour
B) 8 hours per unit
C) 1/8 unit per hour
D) 7.5 minutes per unit
B) 8 hours per unit
C) 1/8 unit per hour
D) 7.5 minutes per unit
Unlock Deck
Unlock for access to all 42 flashcards in this deck.
Unlock Deck
k this deck
13
Cycle Time and Velocity
Norton Company has the following data for one of its production departments:
Theoretical velocity: 300 units per hour
Productive minutes available per year: 10,000,000
Annual conversion costs: $60,000,000
Actual velocity: 160 units per hour
Required:
1. Calculate the actual conversion cost per unit using actual cycle time and the standard cost per minute.
2. Calculate the ideal conversion cost per unit using theoretical cycle time and the standard cost per minute. What incentive exists for managers when cycle time costing is used?
3. What if the actual velocity is 220 units per hour? What is the conversion cost per unit? What effect will this improvement have on delivery performance?
Unlock Deck
Unlock for access to all 42 flashcards in this deck.
Unlock Deck
k this deck
14
Identify the five core objectives of the customer perspective.
Unlock Deck
Unlock for access to all 42 flashcards in this deck.
Unlock Deck
k this deck
15
Which of the following objectives would likely be associated with the learning and growth perspective of the balanced scorecard? a. Increasing post-sales service efficiency
B) Increasing information system capabilities
C) Decreasing product development cycle time
D) Improving product image and reputation
B) Increasing information system capabilities
C) Decreasing product development cycle time
D) Improving product image and reputation
Unlock Deck
Unlock for access to all 42 flashcards in this deck.
Unlock Deck
k this deck
16
Describe a strategic-based responsibility accounting system. How does it differ from activity- based responsibility accounting?
Unlock Deck
Unlock for access to all 42 flashcards in this deck.
Unlock Deck
k this deck
17
Cycle Time and Velocity, MCE
Computador has a manufacturing plant in Des Moines that has the theoretical capability to produce 243,000 laptops per quarter but currently produces 91,125 units. The conversion cost per quarter is $7,290,000. There are 60,750 production hours available within the plant per quarter. In addition to the processing minutes per unit used, the production of the laptops uses 10 minutes of move time, 20minutes of wait time, and 5minutes of rework time. (All work is done by cell workers.)
Required:
1. Compute the theoretical and actual velocities (per hour) and the theoretical and actual cycle times (minutes per unit produced).
2. Compute the ideal and actual amounts of conversion cost assigned per laptop.
3. Calculate MCE. How does MCE relate to the conversion cost per laptop?
Unlock Deck
Unlock for access to all 42 flashcards in this deck.
Unlock Deck
k this deck
18
Which of the following objectives would likely be associated with the customer perspective of the balanced scorecard? a. Increasing post-sales service efficiency
B) Decreasing product development cycle time
C) Reducing distribution channel cost
D) Increasing delivery reliability
B) Decreasing product development cycle time
C) Reducing distribution channel cost
D) Increasing delivery reliability
Unlock Deck
Unlock for access to all 42 flashcards in this deck.
Unlock Deck
k this deck
19
MCE
Craig, Inc., has provided the following information for one of its products for each hour of production:
Actual velocity: 100 units (per hour)
Move time: 20 minutes
Inspection time: 18 minutes
Rework time: 12 minutes
Required:
1. Calculate MCE. Comment on its significance.
2. What is the theoretical cycle time? Calculate MCE using actual and theoretical cycle times.
3. What if waste is reduced by 40 percent? What is the new MCE? New cycle time?
Unlock Deck
Unlock for access to all 42 flashcards in this deck.
Unlock Deck
k this deck
20
Explain what is meant by the long wave and the short wave of value creation.
Unlock Deck
Unlock for access to all 42 flashcards in this deck.
Unlock Deck
k this deck
21
Activity-Based Responsibility Accounting versus Strategic-Based Responsibility Accounting
Carson Wellington, president of Mallory Plastics, was considering a report sent to him by Emily Sorensen, vice president of operations. The report was a summary of the progress made by an activity-based management system that was implemented three years ago. Significant progress had indeed been realized. At the conclusion of the report, Emily urged Carson to consider the adoption of the Balanced Scorecard as a logical next step in the company's efforts to establish itself as a leader in its industry. Emily clearly was impressed by the Balanced Scorecard and intrigued by the possibility that the change would enhance the overall competitiveness of Mallory. She requested a meeting of the executive committee to explain the similarities and differences between the two approaches. Carson agreed to schedule the meeting but asked Emily to prepare a memo in advance, listing the most important similarities and differences between the two approaches to responsibility accounting.
Required:
Prepare the memo requested by Carson.
Unlock Deck
Unlock for access to all 42 flashcards in this deck.
Unlock Deck
k this deck
22
What is a Balanced Scorecard?
Unlock Deck
Unlock for access to all 42 flashcards in this deck.
Unlock Deck
k this deck
23
Cycle Time and Velocity, MCE
Refer to Exercise 13.9. Assume that the company identifies poor plant layout as the root cause of wait time and move time.
Required:
1. Express an improvement strategy as a series of if-then statements that will reduce the conversion cost per laptop.
2. Assume that you set an MCE target of 75 percent, based on the improvement strategy described in Requirement 1. What is the expected conversion cost per unit? Explain how you can use these targets to test the viability of your quality improvement strategy.
Unlock Deck
Unlock for access to all 42 flashcards in this deck.
Unlock Deck
k this deck
24
Scorecard Measures, Strategy Translation
At the end of 2012, Mejorar Company implemented a low-cost strategy to improve its competitive position. Its objective was to become the low-cost producer in its industry. A Balanced Scorecard was developed to guide the company toward this objective. To lower costs, Mejorar undertook a number of improvement activities such as JIT production, total quality management, and activity-based management. Now, after two years of operation, the president of Mejorar wants some assessment of the achievements. To help provide this assessment, the following information on one product has been gathered:
Required:
1. Compute the following measures for 2012 and 2014:
a. Actual velocity and cycle time
b. Percentage of total revenue from new customers (assume one unit per customer)
c. Percentage of very satisfied customers (assume each customer purchases one unit)
d. Market share
e. Percentage change in actual product cost (for 2014 only)
f. Percentage change in days of inventory (for 2014 only)
g. Defective units as a percentage of total units produced
h. Total hours of training
i. Suggestions per production worker
j. Total revenue
k. Number of new customers
2. For the measures listed in Requirement 1, list likely strategic objectives, classified according to the four Balance Scorecard perspectives. Assume there is one measure per objective.
Unlock Deck
Unlock for access to all 42 flashcards in this deck.
Unlock Deck
k this deck
25
Strategy Map
Harmon Community Hospital developed the following series of if-then statements for its Balanced Scorecard strategy:
• If employee turnover rate decreases and employee satisfaction increases, then the quality of health care service will improve.
• If the quality of health care service improves, then operating efficiency will increase and patient satisfaction will increase.
• If operating efficiency increases, then operating costs will decrease.
• If patient satisfaction increases, then market share will increase.
• If market share increases, then revenues will increase.
• If revenues increase and costs decrease, then profits will increase.
Required:
1. Prepare a strategy map for Harmon's strategy as described by the series of cause-and-effect relationships.
2. Explain how a performance measure can act as both a lag variable and a lead indicator.
3. What if profits did not increase to the targeted level? Explain how this result could be attributable to either an implementation problem or an invalid strategy. What actions would likely be taken for each case?
Unlock Deck
Unlock for access to all 42 flashcards in this deck.
Unlock Deck
k this deck
26
Define the three processes of the process value chain.
Unlock Deck
Unlock for access to all 42 flashcards in this deck.
Unlock Deck
k this deck
27
If-Then Statements, Strategy Map
Refer to the data in Problem 13.21.
1. Express Mejorar's strategy as a series of if-then statements. What does this tell you about Balanced Scorecard measures?
2. Prepare a strategy map that illustrates the relationships among the likely strategic objectives.
Refer to the data in Problem 13.21.
1. Express Mejorar's strategy as a series of if-then statements. What does this tell you about Balanced Scorecard measures?
2. Prepare a strategy map that illustrates the relationships among the likely strategic objectives.
Unlock Deck
Unlock for access to all 42 flashcards in this deck.
Unlock Deck
k this deck
28
What is meant by balanced measures?
Unlock Deck
Unlock for access to all 42 flashcards in this deck.
Unlock Deck
k this deck
29
Balanced Scorecard, Lead and Lag Variables, Double-Loop Feedback
The following if-then statements were taken from a Balanced Scorecard:
a. If employee capabilities increase, then process time decreases.
b. If process time decreases, then customer retention will increase.
c. If customer retention increases, then market share will increase.
d. If market share increases, then revenues will increase.
Required:
1. Identify the lead and lag variables, and explain your reasoning.
2. Discuss the implications of Requirement 1 for the financial and learning and growth perspectives.
3. Using the first if-then statement, explain the concept of double-loop feedback.
Unlock Deck
Unlock for access to all 42 flashcards in this deck.
Unlock Deck
k this deck
30
Strategic Objectives, Scorecard Measures, Strategy Map
The following strategic objectives have been derived from a strategy that seeks to improve asset utilization by more careful development and use of its human assets and internal processes:
a. Increase revenue from new products.
b. Increase implementation of employee suggestions.
c. Decrease operating expenses.
d. Decrease cycle time for the development of new products.
e. Decrease rework.
f. Increase employee morale.
g. Increase customer satisfaction.
h. Increase access of key employees to customer and product information.
i. Increase customer acquisition.
j. Increase return on investment (ROI).
k. Increase employee productivity.
l. Decrease the collection period for accounts receivable.
m. Increase employee skills.
The heart of the strategy is developing the company's human resources. Management is convinced that empowering employees will lead to an increase in economic returns. Studies have shown that there is a positive relationship between employee morale and customer satisfaction. Furthermore, the more satisfied customers pay their bills more quickly. It was hypothesized that as employees became more involved and more productive, their morale would improve. Thus, the strategy incorporated key objectives that would lead to an increase in productivity and involvement.
Required:
1. Classify the objectives by perspective, and suggest a measure for each objective.
2. Prepare a strategy map that illustrates the likely causal relationships among the strategic objectives.
Unlock Deck
Unlock for access to all 42 flashcards in this deck.
Unlock Deck
k this deck
31
What is a lag measure? A lead measure?
Unlock Deck
Unlock for access to all 42 flashcards in this deck.
Unlock Deck
k this deck
32
Identify three objectives of the learning and growth perspective.
Unlock Deck
Unlock for access to all 42 flashcards in this deck.
Unlock Deck
k this deck
33
Cycle Time, Conversion Cost per Unit, MCE
Lander Parts, Inc., produces various automobile parts. In one plant, Lander has a manufacturing cell with the theoretical capability to produce 450,000 fuel pumps per quarter. The conversion cost per quarter is $9,000,000. There are 150,000 production hours available within the cell per quarter.
Required:
1. Compute the theoretical velocity (per hour) and the theoretical cycle time (minutes per unit produced).
2. Compute the ideal amount of conversion cost that will be assigned per subassembly.
3. Suppose the actual time required to produce a fuel pump is 40 minutes. Compute the amount of conversion cost actually assigned to each unit produced. What happens to product cost if the time to produce a unit is decreased to 25 minutes? How can a firm encourage managers to reduce cycle time? Finally, discuss how this approach to assigning conversion cost can improve delivery time.
4. Assuming the actual time to produce one fuel pump is 40 minutes, calculate MCE. How much non-value-added time is being used? How much is it costing per unit?
5. Cycle time, velocity, MCE, conversion cost per unit (theoretical conversion rate × actual conversion time), and non-value-added costs are all measures of performance for the cell process. Discuss the incentives provided by these measures.
Unlock Deck
Unlock for access to all 42 flashcards in this deck.
Unlock Deck
k this deck
34
Activity-Based Responsibility Accounting versus Strategic-Based Responsibility Accounting
The following comment was made by the CEO of a company that recently implemented the Balanced Scorecard: "Responsibility in a strategic-based performance management system differs on the three D's: Direction, Dimension, and Diffusion."
Required:
Explain how this comment describes differences in responsibility between an activity-based and a strategic-based performance management system.
Unlock Deck
Unlock for access to all 42 flashcards in this deck.
Unlock Deck
k this deck
35
Testable Strategy, Strategy Map
Consider the following quality improvement strategy as expressed by a series of if-then statements:
• If real-time feedback information capabilities improve, then post-sales service time will improve.
• If post-sales service time improves, then post-sales service quality will increase.
• If post-sales service quality increases, then customer satisfaction will increase.
• If customer satisfaction increases, then market share will increase.
• If market share increases, then sales will increase.
• If sales increase, then profits will increase.
Required:
1. Prepare a strategy map that shows the cause-and-effect relationships of the quality improvement strategy (see Exhibit 13.10 for an illustrative example).
2. Explain how the quality improvement strategy can be tested.
Unlock Deck
Unlock for access to all 42 flashcards in this deck.
Unlock Deck
k this deck
36
MCE, Testable Strategy, Strategy Map
Auflegger, Inc., manufactures a product that experiences the following activities (and times):
Required:
1. Compute the MCE for this product.
2. A study lists the following root causes of the inefficiencies: poor quality components from suppliers, lack of skilled workers, and plant layout. Suggest a possible cost reduction strategy, expressed as a series of if-then statements that will reduce MCE and lower costs. Finally, prepare a strategy map that illustrates the causal paths. In preparing the map, use only three perspectives: learning and growth, process, and financial.
3. Is MCE a lag or a lead measure? If and when MCE acts as a lag measure, what lead measures would affect it?
Unlock Deck
Unlock for access to all 42 flashcards in this deck.
Unlock Deck
k this deck
37
What is the difference between an objective measure and a subjective measure?
Unlock Deck
Unlock for access to all 42 flashcards in this deck.
Unlock Deck
k this deck
38
What is a testable strategy?
Unlock Deck
Unlock for access to all 42 flashcards in this deck.
Unlock Deck
k this deck
39
Cycle Time, Velocity, Product Costing
Mulhall, Inc., has a JIT system in place. Each manufacturing cell is dedicated to the production of a single product or major subassembly. One cell, dedicated to the production of mopeds, has four operations: machining, finishing, assembly, and qualifying (testing). The machining process is automated, using computers. In this process, the model's frame and engine are constructed. In finishing, the frame is sandblasted, buffed, and painted. In assembly, the frame and engine are assembled. Finally, each model is tested to ensure operational capability.
For the coming year, the moped cell has the following budgeted costs and cell time (both at theoretical capacity):
Required:
1. Compute the velocity (number of models per hour) that the cell can theoretically achieve. Now, compute the theoretical cycle time (number of hours or minutes per model) that it takes to produce one model.
2. Compute the actual velocity and the actual cycle time.
3. Compute MCE. Comment on the efficiency of the operation.
4. Compute the budgeted conversion cost per minute. Using this rate, compute the conversion cost per model if theoretical output is achieved. Using this measure, compute the conversion cost per model for actual output. Does this product costing approach provide an incentive for the cell manager to reduce cycle time? Explain
Unlock Deck
Unlock for access to all 42 flashcards in this deck.
Unlock Deck
k this deck
40
Activity-Based Responsibility Accounting versus Strategic-Based Responsibility Accounting
"A Balanced Scorecard expresses the complete story of a company's strategy through an integrated set of financial and nonfinancial measures that are both predictive and historical and that may be measured subjectively or objectively."
Required:
1. Using the above statement about scorecard measures, explain how scorecard measurement differs from that of an activity-based management system.
2. Explain what is meant by historical and predictive measures. Why are both types important for describing a company's strategy?
Unlock Deck
Unlock for access to all 42 flashcards in this deck.
Unlock Deck
k this deck
41
Balanced Scorecard, Strategy Translation, Strategy Map, Double-Loop Feedback
Bannister Company, an electronics firm, buys circuit boards and manually inserts various electronic devices into the printed circuit board. Bannister sells its products to original equipment manufacturers. Profits for the last two years have been less than expected. Mandy Confer, owner of Bannister, was convinced that her firm needed to adopt a revenue growth and cost reduction strategy to increase overall profits.
After a careful review of her firm's condition, Mandy realized that the main obstacle for increasing revenues and reducing costs was the high defect rate of her products (a 6 percent reject rate). She was certain that revenues would grow if the defect rate was reduced dramatically. Costs would also decline as there would be fewer rejects and less rework. By decreasing the defect rate, customer satisfaction would increase, causing, in turn, an increase in market share. Mandy also felt that the following actions were needed to help ensure the success of the revenue growth and cost reduction strategy:
a. Improve the soldering capabilities by sending employees to an outside course.
b. Redesign the insertion process to eliminate some of the common mistakes.
c. Improve the procurement process by selecting suppliers that provide higher-quality circuit boards.
Required:
1. State the revenue growth and cost reduction strategy using a series of cause-and-effect relationships expressed as if-then statements.
2. Illustrate the strategy using a strategy map.
3. Explain how the revenue growth strategy can be tested. In your explanation, discuss the role of lead and lag measures, targets, and double-loop feedback.
Unlock Deck
Unlock for access to all 42 flashcards in this deck.
Unlock Deck
k this deck
42
Balanced Scorecard, Non-Value-Added Activities, Strategy Translation, Kaizen Costing
At the beginning of the last quarter of 2013, Youngston, Inc., a consumer products firm, hired Maria Carrillo to take over one of its divisions. The division manufactured small home appliances and was struggling to survive in a very competitive market. Maria immediately requested a projected income statement for 2013. In response, the controller provided the following statement:
After some investigation, Maria soon realized that the products being produced had a serious problem with quality. She once again requested a special study by the controller's office to supply a report on the level of quality costs. By the middle of November, Maria received the following report from the controller:
Maria was surprised at the level of quality costs. They represented 30 percent of sales, which was certainly excessive. She knew that the division had to produce high-quality products to survive. The number of defective units produced needed to be reduced dramatically. Thus, Maria decided to pursue a quality-driven turnaround strategy. Revenue growth and cost reduction could both be achieved if quality could be improved. By growing revenues and decreasing costs, profitability could be increased.
After meeting with the managers of production, marketing, purchasing, and human resources, Maria made the following decisions, effective immediately (end of November 2013):
a. More will be invested in employee training. Workers will be trained to detect quality problems and empowered to make improvements. Workers will be allowed a bonus of 10 percent of any cost savings produced by their suggested improvements.
b. Two design engineers will be hired immediately, with expectations of hiring one or two more within a year. These engineers will be in charge of redesigning processes and products with the objective of improving quality. They will also be given the responsibility of working with selected suppliers to help improve the quality of their products and processes. Design engineers were considered a strategic necessity.
c. Implement a new process: evaluation and selection of suppliers. This new process has the objective of selecting a group of suppliers that are willing and capable of providing nonde-fective components.
d. Effective immediately, the division will begin inspecting purchased components. According to production, many of the quality problems are caused by defective components purchased from outside suppliers. Incoming inspection is viewed as a transitional activity. Once the division has developed a group of suppliers capable of delivering nondefective components, this activity will be eliminated.
e. Within three years, the goal is to produce products with a defect rate less than 0.10 percent. By reducing the defect rate to this level, marketing is confident that market share will increase by at least 50 percent (as a consequence of increased customer satisfaction). Products with better quality will help establish an improved product image and reputation, allowing the division to capture new customers and increase market share.
f. Accounting will be given the charge to install a quality information reporting system. Daily reports on operational quality data (e.g., percentage of defective units), weekly updates of trend graphs (posted throughout the division), and quarterly cost reports are the types of information required.
g. To help direct the improvements in quality activities, kaizen costing is to be implemented. For example, for the year 2013, a kaizen standard of 6 percent of the selling price per unit was set for rework costs, a 25 percent reduction from the current actual cost.
To ensure that the quality improvements were directed and translated into concrete financial outcomes, Maria also began to implement a Balanced Scorecard for the division. By the end of 2014, progress was being made. Sales had increased to $26,000,000, and the kaizen improvements were meeting or beating expectations. For example, rework costs had dropped to $1,500,000.
At the end of 2015, two years after the turnaround quality strategy was implemented, Maria received the following quality cost report:
Maria also received an income statement for 2015:
Maria was pleased with the outcomes. Revenues had grown, and costs had been reduced by at least as much as she had projected for the two-year period. Growth next year should be even greater as she was beginning to observe a favorable effect from the higher-quality products. Also, further quality cost reductions should materialize as incoming inspections were showing much higher-quality purchased components.
Required:
1. Identify the strategic objectives, classified by the Balanced Scorecard perspective. Next, suggest measures for each objective.
2. Using the results from Requirement 1, describe Maria's strategy using a series of if-then statements. Next, prepare a strategy map.
3. Explain how you would evaluate the success of the quality-driven turnaround strategy. What additional information would you like to have for this evaluation?
4. Explain why Maria felt that the Balanced Scorecard would increase the likelihood that the turnaround strategy would actually produce good financial outcomes.
5. Advise Maria on how to encourage her employees to align their actions and behavior with the turnaround strategy.
Unlock Deck
Unlock for access to all 42 flashcards in this deck.
Unlock Deck
k this deck
Unlock Deck
Unlock for access to all 42 flashcards in this deck.


