Deck 14: Quality and Environmental Cost Management
Full screen (f)
Question
Quality Cost Report
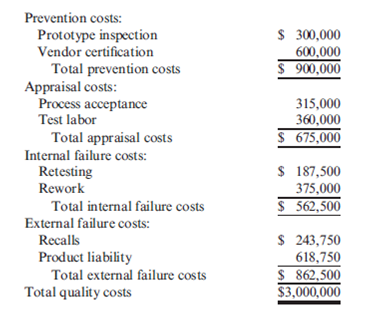
Evans Company had total sales of $3,000,000 for fiscal 2013. The costs of quality-related activities are given below.
Required:
1. Prepare a quality cost report, classifying costs by category and expressing each category as a percentage of sales. What message does the cost report provide?
2. Prepare a bar graph and pie chart that illustrate each category's contribution to total quality costs. Comment on the significance of the distribution.
3. What if , five years from now, quality costs are 7.5 percent of sales, with control costs being 65 percent of the total quality costs? What would your conclusion be?
Question
Question
Question
Question
Environmental Financial Reporting, Ecoefficiency, Improving Environmental Performance
Refer to Problem 14.41. In the environmental benefits section of the report, three types of benefits are listed: income, savings, and cost avoidance. Now, consider the following data for selected items for a four-year period:
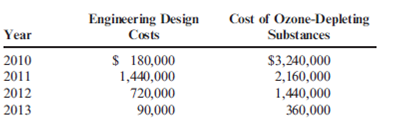
The engineering design costs were incurred to redesign the production processes and products. Redesign of the product allowed the substitution of a material that produced less ozonedepleting substances. Modifications in the design of the processes also accomplished the same objective. Because of the improvements, the company was able to reduce the demand for pollution control equipment (with its attendant depreciation and operating costs) and avoid fines and litigation costs. All of the savings generated in a given year represent costs avoided for future years. The engineering costs are investments in design projects. Once the results of the project are realized, design costs can be reduced to lower levels. However, since some ongoing design activity is required for maintaining the system and improving it as needed, the environmental engineering cost will not be reduced lower than the $90,000 reported in 2013.
Required:
1. Prepare a partial environmental financial statement, divided into benefit and cost sections for 2011, 2012, and 2013.
2. Evaluate and explain the outcomes. Does this result support or challenge ecoefficiency? Explain.
Refer to Problem 14.41. In the environmental benefits section of the report, three types of benefits are listed: income, savings, and cost avoidance. Now, consider the following data for selected items for a four-year period:
The engineering design costs were incurred to redesign the production processes and products. Redesign of the product allowed the substitution of a material that produced less ozonedepleting substances. Modifications in the design of the processes also accomplished the same objective. Because of the improvements, the company was able to reduce the demand for pollution control equipment (with its attendant depreciation and operating costs) and avoid fines and litigation costs. All of the savings generated in a given year represent costs avoided for future years. The engineering costs are investments in design projects. Once the results of the project are realized, design costs can be reduced to lower levels. However, since some ongoing design activity is required for maintaining the system and improving it as needed, the environmental engineering cost will not be reduced lower than the $90,000 reported in 2013.
Required:
1. Prepare a partial environmental financial statement, divided into benefit and cost sections for 2011, 2012, and 2013.
2. Evaluate and explain the outcomes. Does this result support or challenge ecoefficiency? Explain.
Question
Question
Taguchi Loss Function
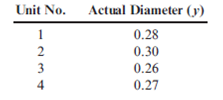
Stahman, Inc., estimates its hidden external failure costs using the Taguchi loss function. Stahlman produces plastic sheets that vary in thickness and grade. For one of its large-volume products, it was determined that k = $30,000 and T = 0.28 inches in diameter. A sample of four units produced the following values:
Required:
1. Calculate the average loss per unit.
2. Assuming that 100,000 units were produced, what is the total hidden cost?
3. Assume that the multiplier for Stahman's hidden external failure costs is six. What are the measured external costs? Explain the difference between measured costs and hidden costs.
Question
Multiple-Year Trend Reports
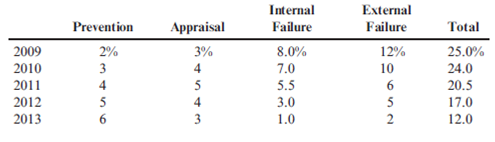
The controller of Willson Company has computed quality costs as a percentage of sales for the past five years (2009 was the first year the company implemented a quality improvement program). This information is as follows:
Required:
1. Prepare a trend graph for total quality costs. Comment on what the graph has to say about the success of the quality improvement program.
2. Prepare a graph that shows the trend for each quality cost category. What does the graph have to say about the success of the quality improvement program? Does this graph supply more insight than the total cost trend graph does?
3. Prepare a graph that compares the trend in relative quality costs. What does this graph tell you?
Question
Question
Environmental Financial Report
The following environmental cost reports for 2011, 2012, and 2013 (year end December 31) are for the Communications Products Division of Kartel, a telecommunications company. In 2011, Kartel committed itself to a continuous environmental improvement program, which was implemented throughout the company.
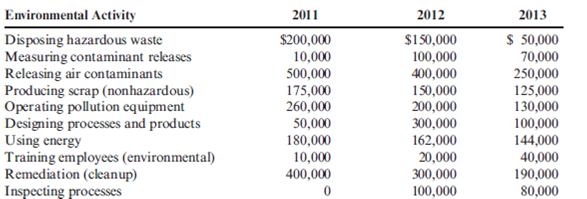
At the beginning of 2013, Kartel began a new program of recycling nonhazardous scrap. The effort produced recycling income totaling $25,000. The marketing vice president and the environmental manager estimated that sales revenue had increased by $200,000 per year since 2011 because of an improved public image relative to environmental performance. The company's Finance Department also estimated that Kartel saved $80,000 in 2013 because of reduced finance and insurance costs, all attributable to improved environmental performance. All reductions in environmental costs from 2011 to 2013 are attributable to improvement efforts. Furthermore, any reductions represent ongoing savings.
Required:
1. Prepare an environmental financial statement for 2013 (for the Products Division). In the cost section, classify environmental costs by category (prevention, detection, etc.).
2. Evaluate the changes in environmental performance.
The following environmental cost reports for 2011, 2012, and 2013 (year end December 31) are for the Communications Products Division of Kartel, a telecommunications company. In 2011, Kartel committed itself to a continuous environmental improvement program, which was implemented throughout the company.
At the beginning of 2013, Kartel began a new program of recycling nonhazardous scrap. The effort produced recycling income totaling $25,000. The marketing vice president and the environmental manager estimated that sales revenue had increased by $200,000 per year since 2011 because of an improved public image relative to environmental performance. The company's Finance Department also estimated that Kartel saved $80,000 in 2013 because of reduced finance and insurance costs, all attributable to improved environmental performance. All reductions in environmental costs from 2011 to 2013 are attributable to improvement efforts. Furthermore, any reductions represent ongoing savings.
Required:
1. Prepare an environmental financial statement for 2013 (for the Products Division). In the cost section, classify environmental costs by category (prevention, detection, etc.).
2. Evaluate the changes in environmental performance.
Question
Interim Quality Performance Report
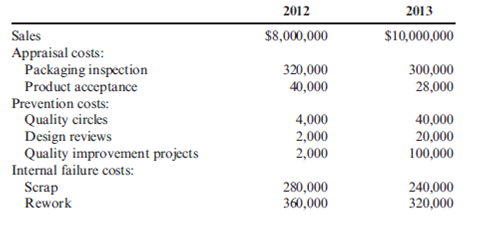
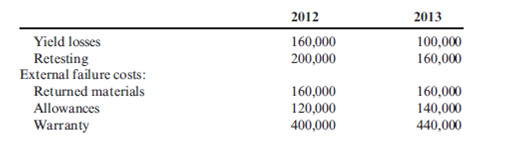
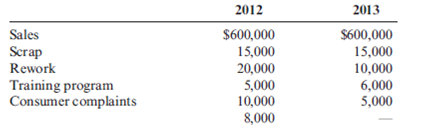
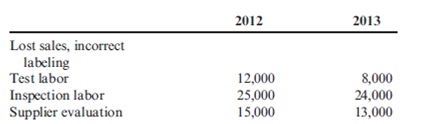
Davis, Inc., had the following quality costs for the years ended December 31, 2012 and 2013:
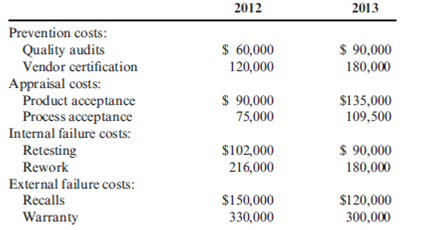
At the end of 2012, management decided to increase its investment in control costs by 50 percent for each category's items with the expectation that failure costs would decrease by 20 percent for each item of the failure categories. Sales were $12,000,000 for both 2012 and 2013.
Required:
1. Calculate the budgeted costs for 2013, and prepare an interim quality performance report.
2. Comment on the significance of the report. How much progress has Davis made?
3. What if sales were $12,000,000 for 2012 and $15,000,000 for 2013? What adjustment to budgeted rework costs would be made? Budgeted quality audits? Assuming the actual costs for 2013 do not change, what does this adjustment say about Davis's performance?
Davis, Inc., had the following quality costs for the years ended December 31, 2012 and 2013:
At the end of 2012, management decided to increase its investment in control costs by 50 percent for each category's items with the expectation that failure costs would decrease by 20 percent for each item of the failure categories. Sales were $12,000,000 for both 2012 and 2013.
Required:
1. Calculate the budgeted costs for 2013, and prepare an interim quality performance report.
2. Comment on the significance of the report. How much progress has Davis made?
3. What if sales were $12,000,000 for 2012 and $15,000,000 for 2013? What adjustment to budgeted rework costs would be made? Budgeted quality audits? Assuming the actual costs for 2013 do not change, what does this adjustment say about Davis's performance?
Question
Question
Question
Question
Assignment of Environmental Costs
Refer to Problem 14.43. In 2011, Jack Carter, president of Kartel, requested that environmental costs be assigned to the two major products produced by the company. He felt that knowledge of the environmental product costs would help guide the design decisions that would be necessary to improve environmental performance. The products represent two different models of a cellular phone (Model XA2 and Model KZ3). The models use different processes and materials. To assign the costs, the following data were gathered for 2011:
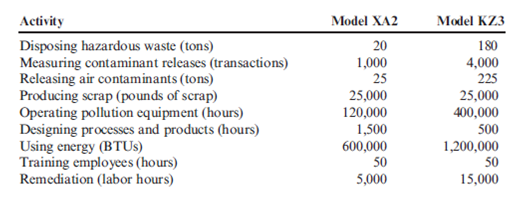
During 2011, Kartel's division produced 200,000 units of Model XA2 and 300,000 units of Model KZ3.
Required:
1. Using the activity data, calculate the environmental cost per unit for each model. How will this information be useful?
2. Upon examining the cost data produced in Requirement 1, an environmental engineer made the following suggestions: (1) substitute a new plastic for a material that appeared to be the source of much of the hazardous waste (the new material actually cost less than the contaminating material it would replace), and (2) redesign the processes to reduce the amount of air contaminants produced.
As a result of the first suggestion, by 2013, the amount of hazardous waste produced had diminished to 50 tons, 10 tons for Model XA2 and 40 tons for Model KZ3. The second suggestion reduced the contaminants released by 50 percent by 2013 (15 tons for Model XA2 and 110 tons for Model KZ3). The need for pollution equipment also diminished, and the hours required for operating this equipment for Model XA2 and Model KZ3 were reduced to 60,000 and 200,000, respectively. Calculate the unit cost reductions for the two models associated with the actions and outcomes described (assume the same production as in 2011). Do you think the efforts to reduce the environmental cost per unit were economically justified? Explain.
Refer to Problem 14.43. In 2011, Jack Carter, president of Kartel, requested that environmental costs be assigned to the two major products produced by the company. He felt that knowledge of the environmental product costs would help guide the design decisions that would be necessary to improve environmental performance. The products represent two different models of a cellular phone (Model XA2 and Model KZ3). The models use different processes and materials. To assign the costs, the following data were gathered for 2011:
During 2011, Kartel's division produced 200,000 units of Model XA2 and 300,000 units of Model KZ3.
Required:
1. Using the activity data, calculate the environmental cost per unit for each model. How will this information be useful?
2. Upon examining the cost data produced in Requirement 1, an environmental engineer made the following suggestions: (1) substitute a new plastic for a material that appeared to be the source of much of the hazardous waste (the new material actually cost less than the contaminating material it would replace), and (2) redesign the processes to reduce the amount of air contaminants produced.
As a result of the first suggestion, by 2013, the amount of hazardous waste produced had diminished to 50 tons, 10 tons for Model XA2 and 40 tons for Model KZ3. The second suggestion reduced the contaminants released by 50 percent by 2013 (15 tons for Model XA2 and 110 tons for Model KZ3). The need for pollution equipment also diminished, and the hours required for operating this equipment for Model XA2 and Model KZ3 were reduced to 60,000 and 200,000, respectively. Calculate the unit cost reductions for the two models associated with the actions and outcomes described (assume the same production as in 2011). Do you think the efforts to reduce the environmental cost per unit were economically justified? Explain.
Question
Question
Question
Question
Two products, Product A and Product B, are associated with the following environmental activities and associated data:
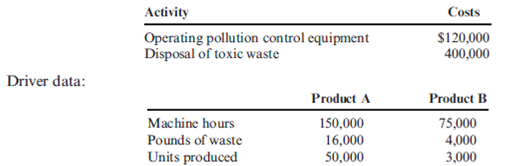
Which of the two products has the greatest environmental impact?
A) Product A because its total environmental cost is $400,000.
B) Product A because it causes more waste and pollution control than Product B.
C) Product B because its total environmental cost is $400,000.
D) Product B because its environmental cost per unit is five times more than Product A's unit environmental cost.
Question
Quality Trend Report Objective
Ross Company implemented a quality improvement program and tracked the following for the five years:
By cost category as a percentage of sales for the same period of time:
Required:
1. Prepare a bar graph that reveals the trend in quality cost as a percentage of sales (time on the horizontal axis and percentages on the vertical). Comment on the message of the graph.
2. Prepare a bar graph for each cost category as a percentage of sales. What does this graph tell you?
3. What if management would like to have the trend in relative distribution of quality costs? Express this as a bar graph and comment on its significance.
Question
Question
Question
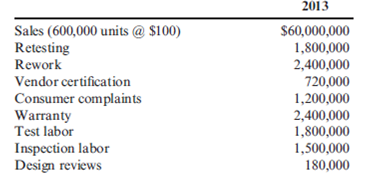
Quality Cost Report, Taguchi Loss Function
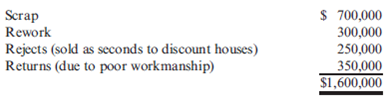
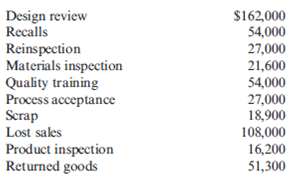
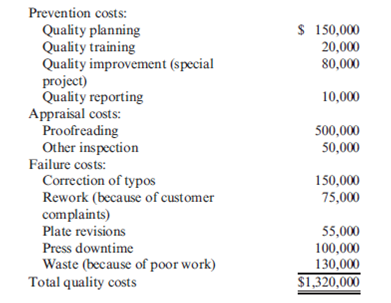
Kathy Shorts, president of Oliver Company, was concerned with the trend in sales and profitability. The company had been losing customers at an alarming rate. Furthermore, the company was barely breaking even. Investigation revealed that poor quality was at the root of the problem. At the end of 2013, Kathy decided to begin a quality improvement program. As a first step, she identified the following costs in the accounting records as quality related:
Required:
1. Prepare a quality cost report by quality cost category.
2. Calculate the relative distribution percentages for each quality cost category. Comment on the distribution.
3. Using the Taguchi loss function, an average loss per unit is computed to be $15 per unit. What are the hidden costs of external failure? How does this affect the relative distribution?
4. Shorts's quality manager decided not to bother with the hidden costs. What do you think was his reasoning? Any efforts to reduce measured external failure costs will also reduce the hidden costs. Do you agree or disagree? Explain.
Question
Question
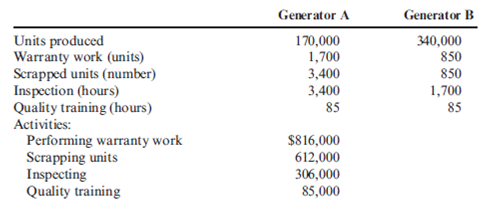
Activity-Based Quality Costing
Abernathy, Inc., produces two different generators and is concerned about their quality. The company has identified the following quality activities and costs associated with the two products:
Required:
1. Calculate the quality cost per unit for each product, and break this unit cost into quality cost categories. Which of the two seems to have the lowest quality?
2. How might a manager use the unit quality cost information?
Question
Question
Taguchi Loss Function
Panguitch Company manufactures a component for tablet computers. Weight and durability of the component are the two most important quality characteristics for the tablet manufacturers. With respect to the weight dimension, the component has a target value of 100 grams. Specification limits are 100 grams, plus or minus five grams. Products produced at the lower specification limit of 95 grams lose $20. A sample of five units produced the following weight measures:
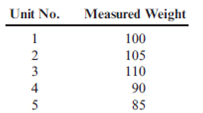
During the first quarter, 100,000 units were produced.
Required:
1. Calculate the loss for each unit. Calculate the average loss for the sample of five.
2. Using the average loss, calculate the hidden quality costs for the first quarter.
3. Durability is another important quality characteristic. The target value is 20,000 hours of operation before failure. The lower specification limit set by engineering and marketing is 19,000 hours. They agreed that there should be no upper specification limit. They also noted that there is a $750 loss at the lower specification limit. Explain why there would be no upper specification limit. Use the lower limit and the left half of the Taguchi quadratic loss function to estimate the loss for components with the following lives: 6,500 hours, 11,000 hours, and 15,500 hours. What does this reveal about the importance of durability?
Panguitch Company manufactures a component for tablet computers. Weight and durability of the component are the two most important quality characteristics for the tablet manufacturers. With respect to the weight dimension, the component has a target value of 100 grams. Specification limits are 100 grams, plus or minus five grams. Products produced at the lower specification limit of 95 grams lose $20. A sample of five units produced the following weight measures:
During the first quarter, 100,000 units were produced.
Required:
1. Calculate the loss for each unit. Calculate the average loss for the sample of five.
2. Using the average loss, calculate the hidden quality costs for the first quarter.
3. Durability is another important quality characteristic. The target value is 20,000 hours of operation before failure. The lower specification limit set by engineering and marketing is 19,000 hours. They agreed that there should be no upper specification limit. They also noted that there is a $750 loss at the lower specification limit. Explain why there would be no upper specification limit. Use the lower limit and the left half of the Taguchi quadratic loss function to estimate the loss for components with the following lives: 6,500 hours, 11,000 hours, and 15,500 hours. What does this reveal about the importance of durability?
Question
Long-Term Performance Report
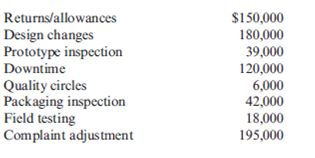
Nabors Company had actual quality costs for the year ended June 30, 2013, as given below.
At the zero-defect state, Nabors expects to spend $375,000 on quality engineering, $75,000 on vendor certification, and $50,000 on packaging inspection. Assume sales to be $25,000,000.
Required:
1. Prepare a long-range performance report for 2013. What does this report tell the management of Nabors?
2. Explain why quality costs still are present for the zero-defect state.
3. What if Nabors achieves the zero-defect state reflected in the report? What are some of the implications of this achievement?
Question
Question
Question
Quality Costs, Pricing Decisions, Market Share
Gaston Company manufactures furniture. One of its product lines is an economy-line kitchen table. During the last year, Gaston produced and sold 100,000 units for $100 per unit. Sales of the table are on a bid basis, but Gaston has always been able to win sufficient bids using the $100 price. This year, however, Gaston was losing more than its share of bids. Concerned, Larry Franklin, owner and president of the company, called a meeting of his executive committee (Megan Johnson, marketing manager; Fred Davis, quality manager; Kevin Jones, production manager; and Helen Jackson, controller).
LARRY : I don't understand why we're losing bids. Megan, do you have an explanation?
MEGAN : Yes, as a matter of fact. Two competitors have lowered their price to $92 per unit. That's too big a difference for most of our buyers to ignore. If we want to keep selling our 100,000 units per year, we will need to lower our price to $92. Otherwise, our sales will drop to about 20,000 to 25,000 per year.
HELEN : The unit contribution margin on the table is $10. Lowering the price to $92 will cost us $8 per unit. Based on a sales volume of 100,000, we'd make $200,000 in contribution margin. If we keep the price at $100, our contribution margin would be $200,000 to $250,000. If we have to lose, let's just take the lower market share. It's better than lowering our prices.
MEGAN : Perhaps. But the same thing could happen to some of our other product lines. My sources tell me that these two companies are on the tail end of a major quality improvement program-one that allows them significant savings. We need to rethink our whole competitive strategy-at least if we want to stay in business. Ideally, we should match the price reduction and work to reduce the costs to recapture the lost contribution margin.
FRED : I think I have something to offer. We are about to embark on a new quality improvement program of our own. I have brought the following estimates of the current quality costs for this economy line. As you can see, these costs run about 16 percent of current sales. That's excessive, and we believe that they can be reduced to about 4 percent of sales over time.
LARRY : This sounds good. Fred, how long will it take for you to achieve this reduction?
FRED : All these costs vary with sales level, so I'll express their reduction rate in those terms. Our best guess is that we can reduce these costs by about 1 percent of sales per quarter. So it should take about 12 quarters, or three years, to achieve the full benefit. Keep in mind that this is with an improvement in quality.
MEGAN : This offers us some hope. If we meet the price immediately, we can maintain our market share. Furthermore, if we can ever reach the point of reducing the price below the $92 level, then we can increase our market share. I estimate that we can increase sales by about 10,000 units for every $1 of price reduction beyond the $92 level. Kevin, how much extra capacity for this line do we have?
KEVIN : We can handle an extra 30,000 or 40,000 tables per year.
Required:
1. Assume that Gaston immediately reduces the bid price to $92. How long will it be before the unit contribution margin is restored to $10, assuming that quality costs are reduced as expected and that sales are maintained at 100,000 units per year (25,000 per quarter)?
2. Assume that Gaston holds the price at $92 until the 4 percent target is achieved. At this new level of quality costs, should the price be reduced? If so, by how much should the price be reduced, and what is the increase in contribution margin? Assume that price can be reduced only in $1 increments.
3. Assume that Gaston immediately reduces the price to $92 and begins the quality improvement program. Now, suppose that Gaston does not wait until the end of the three-year period before reducing prices. Instead, prices will be reduced when profitable to do so. Assume that prices can be reduced only by $1 increments. Identify when the first future price change should occur (if any).
4. Discuss the differences in viewpoints concerning the decision to decrease prices and the short-run contribution margin analysis done by Helen, the controller. Did quality cost information play an important role in the strategic decision making illustrated by the problem?
Question
Question
Quality Cost Report
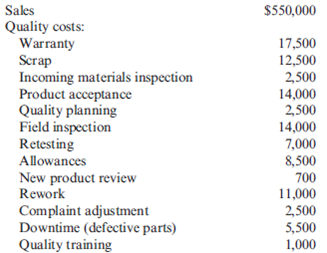
Kang Company reported sales of $3,240,000 in 2013. At the end of the calendar year, the following quality costs were reported:
Required:
1. Prepare a quality cost report.
2. Prepare a graph (pie chart or bar graph) that shows the relative distribution of quality costs, and comment on the distribution.
Question
Question
Question
Environmental Cost Report
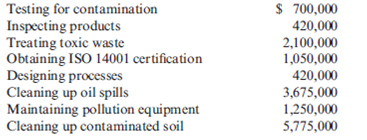
Verde Company reported operating costs of $50,000,000 as of December 31, 2013, with the following environmental costs:
Required:
1. Prepare an environmental cost report, classifying costs by quality category and expressing each as a percentage of total operating costs. What is the message of this report?
2. Prepare a pie chart that shows the relative distribution of environmental costs by category. What does this report tell you?
3. What if Verde deliberately did not include the cost of damaging the ecosystem because of solid waste disposal in its environmental cost report? Offer possible reasons for this decision. If consciously avoided, is this decision unethical?
Question
Question
Question
Question
Question
Quality Improvement and Profitability Objective
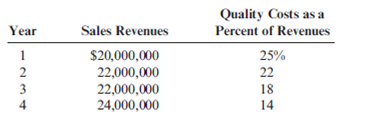
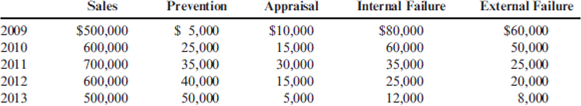
Gagnon Company reported the following sales and quality costs for the past four years. Assume that all quality costs are variable and that all changes in the quality cost ratios are due to a quality improvement program.
Required:
1. Compute the quality costs for all four years. By how much did net income increase from Year 1 to Year 2 because of quality improvements? From Year 2 to Year 3? From Year 3 to Year 4?
2. The management of Gagnon Company believes it is possible to reduce quality costs to 2.5 percent of sales. Assuming sales will continue at the Year 4 level, calculate the additional profit potential facing Gagnon. Is the expectation of improving quality and reducing costs to 2.5 percent of sales realistic? Explain.
3. Assume that Gagnon produces one type of product, which is sold on a bid basis. In Years 1 and 2, the average bid was $400. In Year 1, total variable costs were $250 per unit. In Year 3, competition forced the bid to drop to $380. Compute the total contribution margin in Year 3 assuming the same quality costs as in Year 1. Now, compute the total contribution margin in Year 3 using the actual quality costs for Year 3. What is the increase in profitability resulting from the quality improvements made from Year 1 to Year 3?
Question
Environmental Cost Report
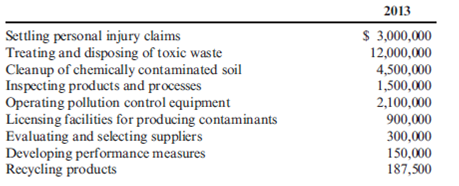
At the end of 2013, Bing Pharmaceuticals began to implement an environmental quality management program. As a first step, it identified the following costs in its accounting records as environmentally related for the calendar year just ended:
Required:
1. Prepare an environmental cost report by category. Assume that total operating costs are $150,000,000.
2. Use a pie chart to illustrate the relative distribution percentages for each environmental cost category. Comment on what this distribution communicates to a manager.
Question
Quality Cost Report, Interim Performance Report
Recently, Ulrich Company received a report from an external consulting group on its quality costs. The consultants reported that the company's quality costs total about 21 percent of its sales revenues. Somewhat shocked by the magnitude of the costs, Rob Rustin, president of Ulrich Company, decided to launch a major quality improvement program. For the coming year, management decided to reduce quality costs to 17 percent of sales revenues. Although the amount of reduction was ambitious, most company officials believed that the goal could be realized. To improve the monitoring of the quality improvement program, Rob directed Pamela Golding, the controller, to prepare monthly performance reports comparing budgeted and actual quality costs. Budgeted costs and sales for the first two months of the year are as follows:


The following actual sales and actual quality costs were reported for January:
Required:
1. Reorganize the monthly budgets so that quality costs are grouped in one of four categories: appraisal, prevention, internal failure, or external failure. (Essentially, prepare a budgeted cost of quality report.) Also, identify each cost as variable (V) or fixed (F). (Assume that no costs are mixed.)
2. Prepare a performance report for January that compares actual costs with budgeted costs. Comment on the company's progress in improving quality and reducing its quality costs.
Recently, Ulrich Company received a report from an external consulting group on its quality costs. The consultants reported that the company's quality costs total about 21 percent of its sales revenues. Somewhat shocked by the magnitude of the costs, Rob Rustin, president of Ulrich Company, decided to launch a major quality improvement program. For the coming year, management decided to reduce quality costs to 17 percent of sales revenues. Although the amount of reduction was ambitious, most company officials believed that the goal could be realized. To improve the monitoring of the quality improvement program, Rob directed Pamela Golding, the controller, to prepare monthly performance reports comparing budgeted and actual quality costs. Budgeted costs and sales for the first two months of the year are as follows:
The following actual sales and actual quality costs were reported for January:
Required:
1. Reorganize the monthly budgets so that quality costs are grouped in one of four categories: appraisal, prevention, internal failure, or external failure. (Essentially, prepare a budgeted cost of quality report.) Also, identify each cost as variable (V) or fixed (F). (Assume that no costs are mixed.)
2. Prepare a performance report for January that compares actual costs with budgeted costs. Comment on the company's progress in improving quality and reducing its quality costs.
Question
Activity-Based Environmental Cost Assignments
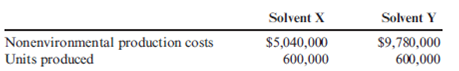
Pinter Company had the following environmental activities and product information:
1. Environmental activity costs
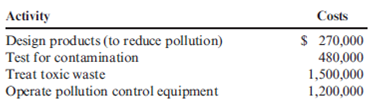
2. Driver data
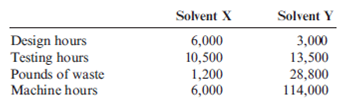
3. Other production data
Required:
1. Calculate the activity rates that will be used to assign environmental costs to products.
2. Determine the unit environmental and unit costs of each product using ABC.
3. What if the design costs increased to $360,000 and the cost of toxic waste decreased to $750,000? Assume that Solvent Y uses 6,000 out of 12,000 design hours. Also assume that waste is cut by 50 percent and that Solvent Y is responsible for 14,250 of 15,000 pounds of toxic waste. What is the new environmental cost for Solvent Y?
Pinter Company had the following environmental activities and product information:
1. Environmental activity costs
2. Driver data
3. Other production data
Required:
1. Calculate the activity rates that will be used to assign environmental costs to products.
2. Determine the unit environmental and unit costs of each product using ABC.
3. What if the design costs increased to $360,000 and the cost of toxic waste decreased to $750,000? Assume that Solvent Y uses 6,000 out of 12,000 design hours. Also assume that waste is cut by 50 percent and that Solvent Y is responsible for 14,250 of 15,000 pounds of toxic waste. What is the new environmental cost for Solvent Y?
Question
Question
Question
Quality Cost Performance Reporting: One-Year Trend, Long-Range Analysis
In 2013, Major Company initiated a full-scale, quality improvement program. At the end of the year, Jack Aldredge, the president, noted with some satisfaction that the defects per unit of product had dropped significantly compared to the prior year. He was also pleased that relationships with suppliers had improved and defective materials had declined. The new quality training program was also well accepted by employees. Of most interest to the president, however, was the impact of the quality improvements on profitability. To help assess the dollar impact of the quality improvements, the actual sales and the actual quality costs for 2012 and 2013 are as follows by quality category:
All prevention costs are fixed (by discretion). Assume all other quality costs are unit-level variable.
Required:
1. Compute the relative distribution of quality costs for each year and prepare a pie chart. Do you believe that the company is moving in the right direction in terms of the balance among the quality cost categories? Explain.
2. Prepare a one-year trend performance report for 2013 (compare the actual costs of 2013 with those of 2012, adjusted for differences in sales volume). How much have profits increased because of the quality improvements made by Major Company?
3. Estimate the additional improvement in profits if Major Company ultimately reduces its quality costs to 2.5 percent of sales revenues (assume sales of $10 million).
Question
Question
Quality Costs: Profit Improvement and Distribution Across Categories, Gainsharing
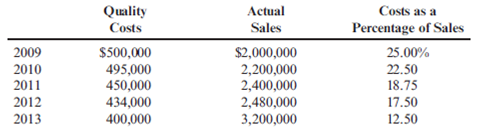
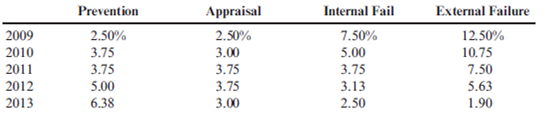
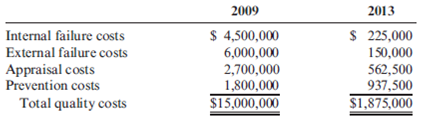
Muskogee Company had sales of $60,000,000 in 2009. In 2013, sales had increased to $75,000,000. A quality improvement program was implemented at the beginning of 2009. Overall conformance quality was targeted for improvement. The quality costs for 2009 and 2013 follow. Assume any changes in quality costs are attributable to improvements in quality.
Required:
1. Compute the quality cost-to-sales ratio for each year. Is this type of improvement possible?
2. Calculate the relative distribution of costs by category for 2009. What do you think of the way costs are distributed? (A pie chart or bar graph may be of some help.) How do you think they will be distributed as the company approaches a zero-defects state?
3. Calculate the relative distribution of costs by category for 2013. What do you think of the level and distribution of quality costs? (A pie chart or bar graph may be of some help.) Do you think further reductions are possible?
4. The quality manager for Muskogee indicated that the external failure costs reported are only the measured costs. He argued that the 2013 external costs were much higher than those reported and that additional investment ought to be made in control costs. Discuss the validity of his viewpoint.
5. Suppose that the manager of Muskogee received a bonus equal to 10 percent of the quality cost savings each year. Do you think that gainsharing is a good or a bad idea? Discuss the risks of gainsharing.
Question
Question
Distribution of Quality Costs
Paper Products Division produces paper diapers, napkins, and paper towels. The divisional manager has decided that quality costs can be minimized by distributing quality costs evenly among the four quality categories and reducing them to no more than 5 percent of sales. He has just received the following quality cost report:
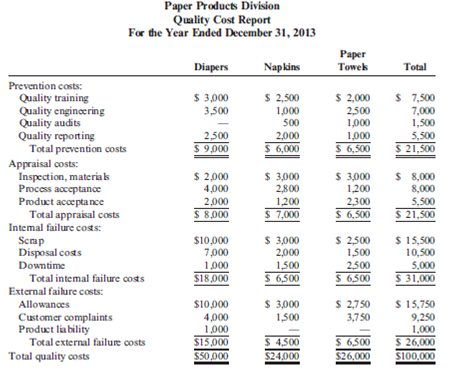
Assume that all prevention costs are fixed and that the remaining quality costs are variable (unit-level).
Required:
1. Assume that the sales revenue for the year totaled $2 million, with sales for each product as follows: diapers, $1 million; napkins, $600,000; and paper towels, $400,000. Evaluate the distribution of costs for the division as a whole and for each product line. What recommendations do you have for the divisional manager?
2. Now, assume that total sales are $1 million and have this breakdown: diapers, $500,000; napkins, $300,000; and paper towels, $200,000. Evaluate the distribution of costs for the division as a whole and for each product line in this case. Do you think it is possible to reduce the quality costs to 5 percent of sales for each product line and for the division as a whole and, simultaneously, achieve an equal distribution of the quality costs? What recommendations do you have?
3. Assume total sales of $1 million with this breakdown: diapers, $500,000; napkins, $180,000; and paper towels, $320,000. Evaluate the distribution of quality costs. What recommendations do you have for the divisional manager?
4. Discuss the value of having quality costs reported by segment.
Paper Products Division produces paper diapers, napkins, and paper towels. The divisional manager has decided that quality costs can be minimized by distributing quality costs evenly among the four quality categories and reducing them to no more than 5 percent of sales. He has just received the following quality cost report:
Assume that all prevention costs are fixed and that the remaining quality costs are variable (unit-level).
Required:
1. Assume that the sales revenue for the year totaled $2 million, with sales for each product as follows: diapers, $1 million; napkins, $600,000; and paper towels, $400,000. Evaluate the distribution of costs for the division as a whole and for each product line. What recommendations do you have for the divisional manager?
2. Now, assume that total sales are $1 million and have this breakdown: diapers, $500,000; napkins, $300,000; and paper towels, $200,000. Evaluate the distribution of costs for the division as a whole and for each product line in this case. Do you think it is possible to reduce the quality costs to 5 percent of sales for each product line and for the division as a whole and, simultaneously, achieve an equal distribution of the quality costs? What recommendations do you have?
3. Assume total sales of $1 million with this breakdown: diapers, $500,000; napkins, $180,000; and paper towels, $320,000. Evaluate the distribution of quality costs. What recommendations do you have for the divisional manager?
4. Discuss the value of having quality costs reported by segment.
Question
Question
Question
Question
Trend Analysis, Quality Costs
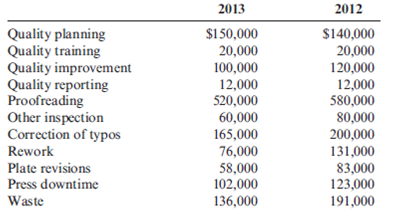
In 2009, Milton Thayne, president of Carbondale Electronics, received a report indicating that quality costs were 31 percent of sales. Faced with increasing pressures from imported goods, Milton resolved to take measures to improve the overall quality of the company's products. After hiring a consultant in 2010, the company began an aggressive program of total quality control. At the end of 2013, Milton requested an analysis of the progress the company had made in reducing and controlling quality costs. The Accounting Department assembled the following data:
Required:
1. Compute the quality costs as a percentage of sales by category and in total for each year.
2. Prepare a multiple-year trend graph for quality costs, both by total costs and by category. Using the graph, assess the progress made in reducing and controlling quality costs. Does the graph provide evidence that quality has improved? Explain.
3. Using the 2009 quality cost relationships (assume all costs are variable), calculate the quality costs that would have prevailed in 2012. By how much did profits increase in 2012 because of the quality improvement program? Repeat for 2013.
Question
Question
Trade-Offs Among Quality Cost Categories, Total Quality Control, Gainsharing
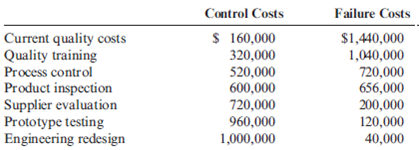
Javier Company has sales of $8 million and quality costs of $1,600,000. The company is embarking on a major quality improvement program. During the next three years, Javier intends to attack failure costs by increasing its appraisal and prevention costs. The "right" prevention activities will be selected, and appraisal costs will be reduced according to the results achieved. For the coming year, management is considering six specific activities: quality training, process control, product inspection, supplier evaluation, prototype testing, and redesign of two major products. To encourage managers to focus on reducing non-value-added quality costs and select the right activities, a bonus pool is established relating to reduction of quality costs. The bonus pool is equal to 10 percent of the total reduction in quality costs.
Current quality costs and the costs of these six activities are given in the following table. Each activity is added sequentially so that its effect on the cost categories can be assessed. For example, after quality training is added, the control costs increase to $320,000, and the failure costs drop to $1,040,000. Even though the activities are presented sequentially, they are totally independent of each other. Thus, only beneficial activities need be selected.
Required:
1. Identify the control activities that should be implemented, and calculate the total quality costs associated with this selection. Assume that an activity is selected only if it increases the bonus pool.
2. Given the activities selected in Requirement 1, calculate the following:
a. The reduction in total quality costs
b. The percentage distribution for control and failure costs
c. The amount for this year's bonus pool
3. Suppose that a quality engineer complained about the gainsharing incentive system. Basically, he argued that the bonus should be based only on reductions of failure and appraisal costs. In this way, investment in prevention activities would be encouraged, and eventually, failure and appraisal costs would be eliminated. After eliminating the non-value-added costs, focus could then be placed on the level of prevention costs. If this approach were adopted, what activities would be selected? Do you agree or disagree with this approach? Explain.
Question
Environmental Cost Assignment
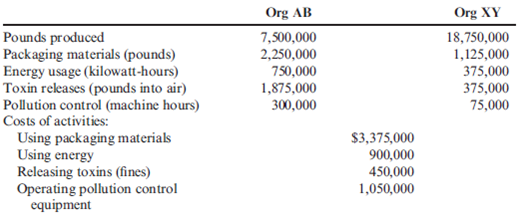
Coyle Pharmaceuticals produces two organic chemicals (Org AB and Org XY) used in the production of two of its most wide-selling anti-cancer drugs. The controller and environmental manager have identified the following environmental activities and costs associated with the two products:
Required:
1. Calculate the environmental cost per pound for each product. Which of the two products appears to cause the most degradation to the environment?
2. In which environmental category would you classify excessive use of materials and energy?
3. Suppose that the toxin releases cause health problems for those who live near the chemical plant. The costs, due to missed work and medical treatments, are estimated at $2,025,000 per year. How would assignment of these costs change the unit cost? Should they be assigned?
Question
Case on Quality Cost Performance Reports
Iona Company, a large printing company, is in its fourth year of a five-year, quality improvement program. The program began in 2009 with an internal study that revealed the quality costs being incurred. In that year, a five-year plan was developed to lower quality costs to 10 percent of sales by the end of 2013. Sales and quality costs for each year are as follows:
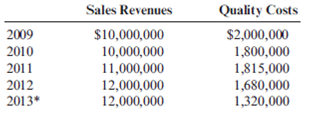
* Budgeted figures.
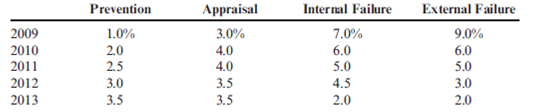
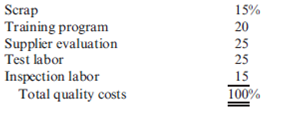
Quality costs by category are expressed as a percentage of sales as follows:
The detail of the 2013 budget for quality costs is also provided.
All prevention costs are fixed; all other quality costs are variable.
During 2013, the company had $12 million in sales. Actual quality costs for 2012 and 2013 are as follows:
Required:
1. Prepare an interim quality cost performance report for 2013 that compares actual quality costs with budgeted quality costs. Comment on the firm's ability to achieve its quality goals for the year.
2. Prepare a one-period quality performance report for 2013 that compares the actual quality costs of 2012 with the actual costs of 2013. How much did profits change because of improved quality?
3. Prepare a graph that shows the trend in total quality costs as a percentage of sales since the inception of the quality improvement program.
4. Prepare a graph that shows the trend for all four quality cost categories for 2009 through 2013. How does this graph help management know that the reduction in total quality costs is attributable to quality improvements?
5. Assume that the company is preparing a second five-year plan to reduce quality costs to 2.5 percent of sales. Prepare a long-range quality cost performance report assuming sales of $15 million at the end of five years. Assume that the final planned relative distribution of quality costs is as follows: proofreading, 50 percent; other inspection, 13 percent; quality training, 30 percent; and quality reporting, 7 percent.
Iona Company, a large printing company, is in its fourth year of a five-year, quality improvement program. The program began in 2009 with an internal study that revealed the quality costs being incurred. In that year, a five-year plan was developed to lower quality costs to 10 percent of sales by the end of 2013. Sales and quality costs for each year are as follows:
* Budgeted figures.
Quality costs by category are expressed as a percentage of sales as follows:
The detail of the 2013 budget for quality costs is also provided.
All prevention costs are fixed; all other quality costs are variable.
During 2013, the company had $12 million in sales. Actual quality costs for 2012 and 2013 are as follows:
Required:
1. Prepare an interim quality cost performance report for 2013 that compares actual quality costs with budgeted quality costs. Comment on the firm's ability to achieve its quality goals for the year.
2. Prepare a one-period quality performance report for 2013 that compares the actual quality costs of 2012 with the actual costs of 2013. How much did profits change because of improved quality?
3. Prepare a graph that shows the trend in total quality costs as a percentage of sales since the inception of the quality improvement program.
4. Prepare a graph that shows the trend for all four quality cost categories for 2009 through 2013. How does this graph help management know that the reduction in total quality costs is attributable to quality improvements?
5. Assume that the company is preparing a second five-year plan to reduce quality costs to 2.5 percent of sales. Prepare a long-range quality cost performance report assuming sales of $15 million at the end of five years. Assume that the final planned relative distribution of quality costs is as follows: proofreading, 50 percent; other inspection, 13 percent; quality training, 30 percent; and quality reporting, 7 percent.
Question
Question
Question
Question
Environmental Responsibility Accounting, Cost Trends
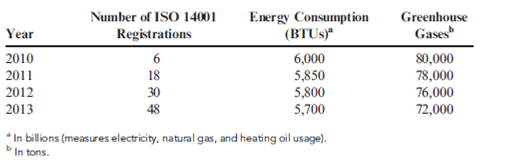
At the beginning of 2010, Heber Company, an international telecommunications company, embarked on an environmental improvement program. The company set a goal to have all its facilities ISO 14001 registered by 2013. (There are 60 facilities worldwide.) To communicate the environmental progress made, management decided to issue, on a voluntary basis, an annual environmental progress report. Internally, the Accounting Department issued monthly progress reports and developed a number of measures that could be reported even more frequently to assess progress. Heber also asked an international CPA firm to prepare an auditor's report that would comment on the reasonableness and fairness of Heber's approach to assessing and measuring environmental performance.
At the end of 2013, the controller had gathered data that would be used in preparing the environmental progress report. A sample of the data collected is as follows:
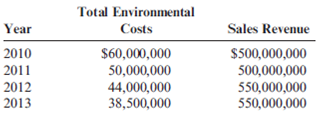
As part of its environmental cost reporting system, Heber tracks its total environmental costs. Consider the following cost and sales data:
Required:
1. Using the data, prepare a bar graph for each of the three environmental variables provided (registrations, energy, and greenhouse gases). Comment on the progress made on these three dimensions.
2. Prepare a bar graph for environmental costs expressed as a percentage of sales. Assuming that environmental performance has improved, explain why environmental costs have decreased.
3. Normalize energy consumption by expressing it as a multiple of sales (BTUs/Sales). Now, prepare a bar graph for energy. Comment on the progress made in reducing energy consumption. How does this compare with the conclusion that would be reached using a nonnormalized measure of progress? Which is the best approach? Explain.
At the beginning of 2010, Heber Company, an international telecommunications company, embarked on an environmental improvement program. The company set a goal to have all its facilities ISO 14001 registered by 2013. (There are 60 facilities worldwide.) To communicate the environmental progress made, management decided to issue, on a voluntary basis, an annual environmental progress report. Internally, the Accounting Department issued monthly progress reports and developed a number of measures that could be reported even more frequently to assess progress. Heber also asked an international CPA firm to prepare an auditor's report that would comment on the reasonableness and fairness of Heber's approach to assessing and measuring environmental performance.
At the end of 2013, the controller had gathered data that would be used in preparing the environmental progress report. A sample of the data collected is as follows:
As part of its environmental cost reporting system, Heber tracks its total environmental costs. Consider the following cost and sales data:
Required:
1. Using the data, prepare a bar graph for each of the three environmental variables provided (registrations, energy, and greenhouse gases). Comment on the progress made on these three dimensions.
2. Prepare a bar graph for environmental costs expressed as a percentage of sales. Assuming that environmental performance has improved, explain why environmental costs have decreased.
3. Normalize energy consumption by expressing it as a multiple of sales (BTUs/Sales). Now, prepare a bar graph for energy. Comment on the progress made in reducing energy consumption. How does this compare with the conclusion that would be reached using a nonnormalized measure of progress? Which is the best approach? Explain.
Question
Question
Trend, Long-Range Performance Report
In 2012, Tru-Delite Frozen Desserts, Inc., instituted a quality improvement program. At the end of 2013, the management of the corporation requested a report to show the amount saved by the measures taken during the year. The actual sales and quality costs for 2012 and 2013 are as follows:
Tru-Delite's management believes that quality costs can be reduced to 2.5 percent of sales within the next five years. At the end of 2017, Tru-Delite's sales are projected to grow to $750,000. The projected relative distribution of quality costs at the end of 2017 is as follows:
Required:
1. Profits increased by what amount due to quality improvements made in 2013?
2. Prepare a long-range performance report that compares the quality costs incurred at the end of 2013 with the quality cost structure expected at the end of 2017.
3. Are the targeted costs in the year 2017 all value-added costs? How would you interpret the variances if the targeted costs are value-added costs?
4. What would be the profit increase in 2017 if the 2.5 percent performance standard is met in that year?
Question
Question

Unlock Deck
Sign up to unlock the cards in this deck!
Unlock Deck
Unlock Deck
1/67
Play
Full screen (f)
Deck 14: Quality and Environmental Cost Management
1
Quality Cost Report
Evans Company had total sales of $3,000,000 for fiscal 2013. The costs of quality-related activities are given below.
Required:
1. Prepare a quality cost report, classifying costs by category and expressing each category as a percentage of sales. What message does the cost report provide?
2. Prepare a bar graph and pie chart that illustrate each category's contribution to total quality costs. Comment on the significance of the distribution.
3. What if , five years from now, quality costs are 7.5 percent of sales, with control costs being 65 percent of the total quality costs? What would your conclusion be?
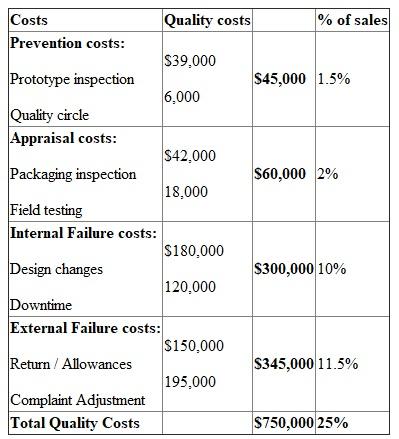
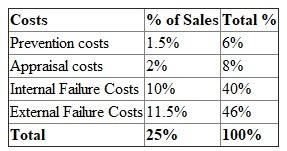
(1) Quality Cost Report:
Quality cost report is important for the organization regarding improving and controlling the quality costs.
First quality costs are categorized into four types:
(1) Prevention costs
(2) Detection (Appraisal) costs
(3) Internal failure costs
(4) External failure costs
Quality Costs Report of Evans Company
For the year ended 2013
 Note:
Note:
• Total sales is $3,000,000
• Prevention costs is 1.5% ($45,000 / $$3,000,000) and like wise
• Percentage of sales is (Cost / Total Sales) 100
100
Therefore, the report clearly indicates that quality costs are too high 25% of sales which is much greater than the desired 2 to 4 percent of sales that prevails for companies with good quality performance.
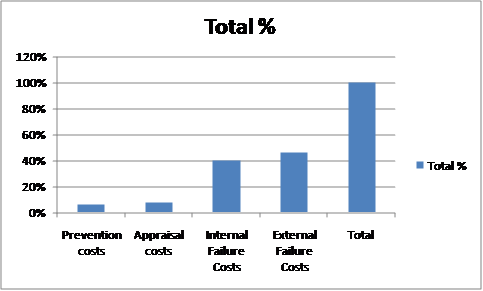
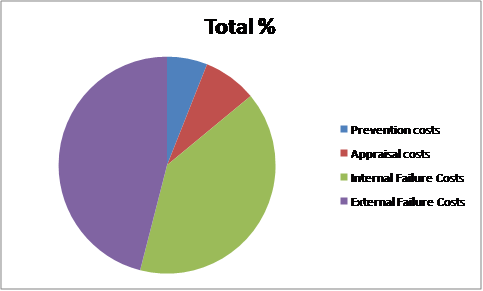
(2) Prepare the bar graph and pie chart:
Report Analysis:
• As per the data Failure Costs are 86% which is too high
• Compared to 14% relates to prevention cost and the appraisal costs
• It needs to invest more in control activities to drive down failure costs
• Total percentage is 6% (1.5 / 25) 100 and like wise
• Total prevention cost and the appraisal costs is 14% (6% + 8%)• While Failure Costs are 86% (40% + 46%)Table showing total percent
 (3) Conclusion:
• Reduction in the quality costs is due to the quality improvement, the 7.5% percent level reveals that the company is producing at a very high quality level.
• If quality costs are with the range of 2 to 4 percent than no failure costs, then the company has effectively and practically achieved Zero defects stage.
• It should be better to reduce the failure costs for the development of the firm.
Quality cost report is important for the organization regarding improving and controlling the quality costs.
First quality costs are categorized into four types:
(1) Prevention costs
(2) Detection (Appraisal) costs
(3) Internal failure costs
(4) External failure costs
Quality Costs Report of Evans Company
For the year ended 2013
Note: • Total sales is $3,000,000
• Prevention costs is 1.5% ($45,000 / $$3,000,000) and like wise
• Percentage of sales is (Cost / Total Sales)
100 Therefore, the report clearly indicates that quality costs are too high 25% of sales which is much greater than the desired 2 to 4 percent of sales that prevails for companies with good quality performance.
(2) Prepare the bar graph and pie chart:
Report Analysis:
• As per the data Failure Costs are 86% which is too high
• Compared to 14% relates to prevention cost and the appraisal costs
• It needs to invest more in control activities to drive down failure costs
• Total percentage is 6% (1.5 / 25)
100 and like wise• Total prevention cost and the appraisal costs is 14% (6% + 8%)• While Failure Costs are 86% (40% + 46%)Table showing total percent
(3) Conclusion: • Reduction in the quality costs is due to the quality improvement, the 7.5% percent level reveals that the company is producing at a very high quality level.
• If quality costs are with the range of 2 to 4 percent than no failure costs, then the company has effectively and practically achieved Zero defects stage.
• It should be better to reduce the failure costs for the development of the firm.
2
Describe the three types of quality performance reporting. How can managers use each report to help evaluate their quality improvement programs?
The three types of quality performance reporting are described below:
1. Interim quality reports: interim quality reports are prepared to determine the progress of quality in connection with current period standard. In fact, current reporting process takes in to account only the quality check of currently manufacturing products which are normally produced in current financial year and it is evaluated that how much these products are meeting the desired specifications.
2. Multiple-period reports : as far as multiple reporting is concerned it does not only take in account the current quality evaluation but compare it with former quality improvements as well, so as to boost the quality standard of the products manufactured.
3. Long-range reports: long range reporting is concerned with deterring the capability of the company to produce zero defected products. Hence this reporting is applied to evaluate the improvement of the company toward attaining the zero defect goal. This target can not be achieved in short run therefore it is considered as long range process.
3
What are the four objectives associated with ecoefficiency?
The four objectives associated with ecoefficiency are as under:
1. Minimization of environmental impact : ecoefficiency help the companies to reduce impacts associated with environment. By polluting environment by producing toxic acids, harmful residues, companies are more vulnerable to law suits, government actions and fines. Ecoefficiency thereby help the companies to get rid of these threats.
2. Reduce environmental liability : companies are directed by governments to follow the environment acts while doing their business, any violation thereof will result in lawsuit or fine. Ecoefficiency makes the company capable of producing low environmental pollutants hence prevents it from unnecessary law suits and fines.
3. Optimized resource utilization : optimized resource utilization is the min aim of coefficient. By attaining the ecoefficiency companies are capable of producing high quality products with fewer resources, which will obviously minimize wastes and lower costs.
4. Product value creation : ecoefficiency is based upon the strategy of high quality with fewer resources; hence products of the company become more competitive, less costly and running, thereby increasing the value of products.
4
Which of the following would be a hidden quality cost? a. Inspecting and testing prototypes
B) Repairing a computer still under warranty
C) Stopping work to correct process malfunction (discovered using statistical process control procedures)
D) Lost market share due to poor product performance
B) Repairing a computer still under warranty
C) Stopping work to correct process malfunction (discovered using statistical process control procedures)
D) Lost market share due to poor product performance
Unlock Deck
Unlock for access to all 67 flashcards in this deck.
Unlock Deck
k this deck
5
Environmental Financial Reporting, Ecoefficiency, Improving Environmental Performance
Refer to Problem 14.41. In the environmental benefits section of the report, three types of benefits are listed: income, savings, and cost avoidance. Now, consider the following data for selected items for a four-year period:
The engineering design costs were incurred to redesign the production processes and products. Redesign of the product allowed the substitution of a material that produced less ozonedepleting substances. Modifications in the design of the processes also accomplished the same objective. Because of the improvements, the company was able to reduce the demand for pollution control equipment (with its attendant depreciation and operating costs) and avoid fines and litigation costs. All of the savings generated in a given year represent costs avoided for future years. The engineering costs are investments in design projects. Once the results of the project are realized, design costs can be reduced to lower levels. However, since some ongoing design activity is required for maintaining the system and improving it as needed, the environmental engineering cost will not be reduced lower than the $90,000 reported in 2013.
Required:
1. Prepare a partial environmental financial statement, divided into benefit and cost sections for 2011, 2012, and 2013.
2. Evaluate and explain the outcomes. Does this result support or challenge ecoefficiency? Explain.
Unlock Deck
Unlock for access to all 67 flashcards in this deck.
Unlock Deck
k this deck
6
What is the difference between quality of design and quality of conformance?
Unlock Deck
Unlock for access to all 67 flashcards in this deck.
Unlock Deck
k this deck
7
Taguchi Loss Function
Stahman, Inc., estimates its hidden external failure costs using the Taguchi loss function. Stahlman produces plastic sheets that vary in thickness and grade. For one of its large-volume products, it was determined that k = $30,000 and T = 0.28 inches in diameter. A sample of four units produced the following values:
Required:
1. Calculate the average loss per unit.
2. Assuming that 100,000 units were produced, what is the total hidden cost?
3. Assume that the multiplier for Stahman's hidden external failure costs is six. What are the measured external costs? Explain the difference between measured costs and hidden costs.
Unlock Deck
Unlock for access to all 67 flashcards in this deck.
Unlock Deck
k this deck
8
Multiple-Year Trend Reports
The controller of Willson Company has computed quality costs as a percentage of sales for the past five years (2009 was the first year the company implemented a quality improvement program). This information is as follows:
Required:
1. Prepare a trend graph for total quality costs. Comment on what the graph has to say about the success of the quality improvement program.
2. Prepare a graph that shows the trend for each quality cost category. What does the graph have to say about the success of the quality improvement program? Does this graph supply more insight than the total cost trend graph does?
3. Prepare a graph that compares the trend in relative quality costs. What does this graph tell you?
Unlock Deck
Unlock for access to all 67 flashcards in this deck.
Unlock Deck
k this deck
9
Using the Taguchi quality loss function, an average loss of $20 per unit is calculated. During the year, 25,000 units were produced. Which of the following statements represents the correct application of the Taguchi loss function? a. The hidden costs of internal failure are $500,000.
B) The hidden costs of external failure are $500,000.
C) The costs of detection activities are $20 per unit inspected.
D) The total external costs are $500,000.
B) The hidden costs of external failure are $500,000.
C) The costs of detection activities are $20 per unit inspected.
D) The total external costs are $500,000.
Unlock Deck
Unlock for access to all 67 flashcards in this deck.
Unlock Deck
k this deck
10
Environmental Financial Report
The following environmental cost reports for 2011, 2012, and 2013 (year end December 31) are for the Communications Products Division of Kartel, a telecommunications company. In 2011, Kartel committed itself to a continuous environmental improvement program, which was implemented throughout the company.
At the beginning of 2013, Kartel began a new program of recycling nonhazardous scrap. The effort produced recycling income totaling $25,000. The marketing vice president and the environmental manager estimated that sales revenue had increased by $200,000 per year since 2011 because of an improved public image relative to environmental performance. The company's Finance Department also estimated that Kartel saved $80,000 in 2013 because of reduced finance and insurance costs, all attributable to improved environmental performance. All reductions in environmental costs from 2011 to 2013 are attributable to improvement efforts. Furthermore, any reductions represent ongoing savings.
Required:
1. Prepare an environmental financial statement for 2013 (for the Products Division). In the cost section, classify environmental costs by category (prevention, detection, etc.).
2. Evaluate the changes in environmental performance.
Unlock Deck
Unlock for access to all 67 flashcards in this deck.
Unlock Deck
k this deck
11
Interim Quality Performance Report
Davis, Inc., had the following quality costs for the years ended December 31, 2012 and 2013:
At the end of 2012, management decided to increase its investment in control costs by 50 percent for each category's items with the expectation that failure costs would decrease by 20 percent for each item of the failure categories. Sales were $12,000,000 for both 2012 and 2013.
Required:
1. Calculate the budgeted costs for 2013, and prepare an interim quality performance report.
2. Comment on the significance of the report. How much progress has Davis made?
3. What if sales were $12,000,000 for 2012 and $15,000,000 for 2013? What adjustment to budgeted rework costs would be made? Budgeted quality audits? Assuming the actual costs for 2013 do not change, what does this adjustment say about Davis's performance?
Unlock Deck
Unlock for access to all 67 flashcards in this deck.
Unlock Deck
k this deck
12
Discuss the different kinds of incentives that can be used to motivate employees to become involved in quality improvement programs. Explain gainsharing.
Unlock Deck
Unlock for access to all 67 flashcards in this deck.
Unlock Deck
k this deck
13
Describe the four opportunities for improving ecoefficiency.
Unlock Deck
Unlock for access to all 67 flashcards in this deck.
Unlock Deck
k this deck
14
Environmental costs are those costs incurred because poor environmental quality exists or may exist. As with quality costs, environmental costs can be placed into one of four categories. One of these categories is external failure costs. Which of the following describes one of the two external failure cost categories? a. Costs incurred to detect pollution caused by the firm
B) Costs incurred to prevent pollution from contaminating the environment after pollution has been produced
C) Pollution costs caused by the firm but paid for by society
D) Costs incurred to prevent the production of pollution
B) Costs incurred to prevent pollution from contaminating the environment after pollution has been produced
C) Pollution costs caused by the firm but paid for by society
D) Costs incurred to prevent the production of pollution
Unlock Deck
Unlock for access to all 67 flashcards in this deck.
Unlock Deck
k this deck
15
Assignment of Environmental Costs
Refer to Problem 14.43. In 2011, Jack Carter, president of Kartel, requested that environmental costs be assigned to the two major products produced by the company. He felt that knowledge of the environmental product costs would help guide the design decisions that would be necessary to improve environmental performance. The products represent two different models of a cellular phone (Model XA2 and Model KZ3). The models use different processes and materials. To assign the costs, the following data were gathered for 2011:
During 2011, Kartel's division produced 200,000 units of Model XA2 and 300,000 units of Model KZ3.
Required:
1. Using the activity data, calculate the environmental cost per unit for each model. How will this information be useful?
2. Upon examining the cost data produced in Requirement 1, an environmental engineer made the following suggestions: (1) substitute a new plastic for a material that appeared to be the source of much of the hazardous waste (the new material actually cost less than the contaminating material it would replace), and (2) redesign the processes to reduce the amount of air contaminants produced.
As a result of the first suggestion, by 2013, the amount of hazardous waste produced had diminished to 50 tons, 10 tons for Model XA2 and 40 tons for Model KZ3. The second suggestion reduced the contaminants released by 50 percent by 2013 (15 tons for Model XA2 and 110 tons for Model KZ3). The need for pollution equipment also diminished, and the hours required for operating this equipment for Model XA2 and Model KZ3 were reduced to 60,000 and 200,000, respectively. Calculate the unit cost reductions for the two models associated with the actions and outcomes described (assume the same production as in 2011). Do you think the efforts to reduce the environmental cost per unit were economically justified? Explain.
Unlock Deck
Unlock for access to all 67 flashcards in this deck.
Unlock Deck
k this deck
16
Why are quality costs the costs of doing things wrong?
Unlock Deck
Unlock for access to all 67 flashcards in this deck.
Unlock Deck
k this deck
17
Quality Cost Classification
Classify the following quality costs as prevention costs, appraisal costs, internal failure costs, or external failure costs:
1. Inspection of reworked units
2. Inspecting and testing a newly developed product (not yet being sold)
3. Retesting a reworked product
4. Repairing a computer still under warranty
5. Discount allowed to customers because products failed to meet customer specifications
6. Goods returned because they failed to meet specifications
7. The cost of evaluating and certifying suppliers
8. Stopping work to correct process malfunction (discovered using statistical process control procedures)
9. Testing products in the field
10. Discarding products that cannot be reworked
11. Lost sales because of recalled products
12. Inspection of incoming materials
13. Redesigning a product to eliminate the need to use an outside component with a high defect rate
14. Purchase order chan
15. Replacing a defective product
16. Inspecting and testing prototypes
17. Repairing products in the field
18. Correcting a design error discovered during product development
19. Engineering resources used to help selected suppliers improve their product quality
20. Packaging inspection
21. Processing and responding to consumer complaints
22. Training production line workers in new quality procedures
23. Sampling a batch of goods to determine if the batch has an acceptable defect rate
Unlock Deck
Unlock for access to all 67 flashcards in this deck.
Unlock Deck
k this deck
18
Ecoefficiency
For years, companies dealt with pollution problems through compliance management (ensuring that a company follows environmental laws and regulations as cheaply as possible). No effort was made to improve environmental performance beyond the minimal performance that satisfied environmental regulations (improving environmental performance and increasing economic efficiency were viewed as incompatible objectives). Recently, two alternative views of managing environmental cost have been proposed: (1) ecoefficiency and (2) guided ecoefficiency.
Required:
1. Explain why ecoefficiency may be a better view of the world than that espoused by compliance management. Discuss factors that may support this view.
2. Some believe that even if the ecoefficient view is true, regulatory intervention still may be needed. The type of intervention, however, must be carefully designed. Explain what is meant by properly designed regulation, and identify the key assumptions that must hold for the guided ecoefficiency view to be valid.
Unlock Deck
Unlock for access to all 67 flashcards in this deck.
Unlock Deck
k this deck
19
Two products, Product A and Product B, are associated with the following environmental activities and associated data:
Which of the two products has the greatest environmental impact?
A) Product A because its total environmental cost is $400,000.
B) Product A because it causes more waste and pollution control than Product B.
C) Product B because its total environmental cost is $400,000.
D) Product B because its environmental cost per unit is five times more than Product A's unit environmental cost.
Unlock Deck
Unlock for access to all 67 flashcards in this deck.
Unlock Deck
k this deck
20
Quality Trend Report Objective
Ross Company implemented a quality improvement program and tracked the following for the five years:
By cost category as a percentage of sales for the same period of time:
Required:
1. Prepare a bar graph that reveals the trend in quality cost as a percentage of sales (time on the horizontal axis and percentages on the vertical). Comment on the message of the graph.
2. Prepare a bar graph for each cost category as a percentage of sales. What does this graph tell you?
3. What if management would like to have the trend in relative distribution of quality costs? Express this as a bar graph and comment on its significance.
Ross Company implemented a quality improvement program and tracked the following for the five years:
By cost category as a percentage of sales for the same period of time:
Required:
1. Prepare a bar graph that reveals the trend in quality cost as a percentage of sales (time on the horizontal axis and percentages on the vertical). Comment on the message of the graph.
2. Prepare a bar graph for each cost category as a percentage of sales. What does this graph tell you?
3. What if management would like to have the trend in relative distribution of quality costs? Express this as a bar graph and comment on its significance.
Unlock Deck
Unlock for access to all 67 flashcards in this deck.
Unlock Deck
k this deck
21
If a firm's annual sales are $200 million, what percentage of sales should be spent on quality costs? Suppose that the firm is spending 18 percent of sales on quality costs. What is the potential savings from quality improvement?
Unlock Deck
Unlock for access to all 67 flashcards in this deck.
Unlock Deck
k this deck
22
What is an environmental cost?
Unlock Deck
Unlock for access to all 67 flashcards in this deck.
Unlock Deck
k this deck
23
Quality Cost Report, Taguchi Loss Function
Kathy Shorts, president of Oliver Company, was concerned with the trend in sales and profitability. The company had been losing customers at an alarming rate. Furthermore, the company was barely breaking even. Investigation revealed that poor quality was at the root of the problem. At the end of 2013, Kathy decided to begin a quality improvement program. As a first step, she identified the following costs in the accounting records as quality related:
Required:
1. Prepare a quality cost report by quality cost category.
2. Calculate the relative distribution percentages for each quality cost category. Comment on the distribution.
3. Using the Taguchi loss function, an average loss per unit is computed to be $15 per unit. What are the hidden costs of external failure? How does this affect the relative distribution?
4. Shorts's quality manager decided not to bother with the hidden costs. What do you think was his reasoning? Any efforts to reduce measured external failure costs will also reduce the hidden costs. Do you agree or disagree? Explain.
Unlock Deck
Unlock for access to all 67 flashcards in this deck.
Unlock Deck
k this deck
24
What is the difference between the zero-defects philosophy and the robust quality philosophy?
Unlock Deck
Unlock for access to all 67 flashcards in this deck.
Unlock Deck
k this deck
25
Activity-Based Quality Costing
Abernathy, Inc., produces two different generators and is concerned about their quality. The company has identified the following quality activities and costs associated with the two products:
Required:
1. Calculate the quality cost per unit for each product, and break this unit cost into quality cost categories. Which of the two seems to have the lowest quality?
2. How might a manager use the unit quality cost information?
Abernathy, Inc., produces two different generators and is concerned about their quality. The company has identified the following quality activities and costs associated with the two products:
Required:
1. Calculate the quality cost per unit for each product, and break this unit cost into quality cost categories. Which of the two seems to have the lowest quality?
2. How might a manager use the unit quality cost information?
Unlock Deck
Unlock for access to all 67 flashcards in this deck.
Unlock Deck
k this deck
26
Ecoefficiency and Sustainable Development
Achieving sustainable development will likely require the cooperation of communities, governments, and businesses. The World Business Council for Sustainable Development (WBCSD) claims that ecoefficiency is "the business contribution to sustainable development."
Required:
1. What is sustainable development?
2. Explain why the WBCSD's claim about ecoefficiency may be true.
3. WBCSD has recently noted (http://www.wbcsd.org): "the good news is that ecoefficiency is working in the companies that try it. The troubling news is that it is not being tried on a large enough scale, even though it makes good business sense." Why do you think the ecoefficiency paradigm is not as widely accepted as it perhaps ought to be? What would you suggest to increase the number of companies involved in ecoefficient projects?
Unlock Deck
Unlock for access to all 67 flashcards in this deck.
Unlock Deck
k this deck
27
Taguchi Loss Function
Panguitch Company manufactures a component for tablet computers. Weight and durability of the component are the two most important quality characteristics for the tablet manufacturers. With respect to the weight dimension, the component has a target value of 100 grams. Specification limits are 100 grams, plus or minus five grams. Products produced at the lower specification limit of 95 grams lose $20. A sample of five units produced the following weight measures:
During the first quarter, 100,000 units were produced.
Required:
1. Calculate the loss for each unit. Calculate the average loss for the sample of five.
2. Using the average loss, calculate the hidden quality costs for the first quarter.
3. Durability is another important quality characteristic. The target value is 20,000 hours of operation before failure. The lower specification limit set by engineering and marketing is 19,000 hours. They agreed that there should be no upper specification limit. They also noted that there is a $750 loss at the lower specification limit. Explain why there would be no upper specification limit. Use the lower limit and the left half of the Taguchi quadratic loss function to estimate the loss for components with the following lives: 6,500 hours, 11,000 hours, and 15,500 hours. What does this reveal about the importance of durability?
Unlock Deck
Unlock for access to all 67 flashcards in this deck.
Unlock Deck
k this deck
28
Long-Term Performance Report
Nabors Company had actual quality costs for the year ended June 30, 2013, as given below.
At the zero-defect state, Nabors expects to spend $375,000 on quality engineering, $75,000 on vendor certification, and $50,000 on packaging inspection. Assume sales to be $25,000,000.
Required:
1. Prepare a long-range performance report for 2013. What does this report tell the management of Nabors?
2. Explain why quality costs still are present for the zero-defect state.
3. What if Nabors achieves the zero-defect state reflected in the report? What are some of the implications of this achievement?
Unlock Deck
Unlock for access to all 67 flashcards in this deck.
Unlock Deck
k this deck
29
Explain why it is important for a manager to assess the relative distribution of quality costs among the four categories.
Unlock Deck
Unlock for access to all 67 flashcards in this deck.
Unlock Deck
k this deck
30
What are the four categories of environmental costs? Define each category.
Unlock Deck
Unlock for access to all 67 flashcards in this deck.
Unlock Deck
k this deck
31
Quality Costs, Pricing Decisions, Market Share
Gaston Company manufactures furniture. One of its product lines is an economy-line kitchen table. During the last year, Gaston produced and sold 100,000 units for $100 per unit. Sales of the table are on a bid basis, but Gaston has always been able to win sufficient bids using the $100 price. This year, however, Gaston was losing more than its share of bids. Concerned, Larry Franklin, owner and president of the company, called a meeting of his executive committee (Megan Johnson, marketing manager; Fred Davis, quality manager; Kevin Jones, production manager; and Helen Jackson, controller).
LARRY : I don't understand why we're losing bids. Megan, do you have an explanation?
MEGAN : Yes, as a matter of fact. Two competitors have lowered their price to $92 per unit. That's too big a difference for most of our buyers to ignore. If we want to keep selling our 100,000 units per year, we will need to lower our price to $92. Otherwise, our sales will drop to about 20,000 to 25,000 per year.
HELEN : The unit contribution margin on the table is $10. Lowering the price to $92 will cost us $8 per unit. Based on a sales volume of 100,000, we'd make $200,000 in contribution margin. If we keep the price at $100, our contribution margin would be $200,000 to $250,000. If we have to lose, let's just take the lower market share. It's better than lowering our prices.
MEGAN : Perhaps. But the same thing could happen to some of our other product lines. My sources tell me that these two companies are on the tail end of a major quality improvement program-one that allows them significant savings. We need to rethink our whole competitive strategy-at least if we want to stay in business. Ideally, we should match the price reduction and work to reduce the costs to recapture the lost contribution margin.
FRED : I think I have something to offer. We are about to embark on a new quality improvement program of our own. I have brought the following estimates of the current quality costs for this economy line. As you can see, these costs run about 16 percent of current sales. That's excessive, and we believe that they can be reduced to about 4 percent of sales over time.
LARRY : This sounds good. Fred, how long will it take for you to achieve this reduction?
FRED : All these costs vary with sales level, so I'll express their reduction rate in those terms. Our best guess is that we can reduce these costs by about 1 percent of sales per quarter. So it should take about 12 quarters, or three years, to achieve the full benefit. Keep in mind that this is with an improvement in quality.
MEGAN : This offers us some hope. If we meet the price immediately, we can maintain our market share. Furthermore, if we can ever reach the point of reducing the price below the $92 level, then we can increase our market share. I estimate that we can increase sales by about 10,000 units for every $1 of price reduction beyond the $92 level. Kevin, how much extra capacity for this line do we have?
KEVIN : We can handle an extra 30,000 or 40,000 tables per year.
Required:
1. Assume that Gaston immediately reduces the bid price to $92. How long will it be before the unit contribution margin is restored to $10, assuming that quality costs are reduced as expected and that sales are maintained at 100,000 units per year (25,000 per quarter)?
2. Assume that Gaston holds the price at $92 until the 4 percent target is achieved. At this new level of quality costs, should the price be reduced? If so, by how much should the price be reduced, and what is the increase in contribution margin? Assume that price can be reduced only in $1 increments.
3. Assume that Gaston immediately reduces the price to $92 and begins the quality improvement program. Now, suppose that Gaston does not wait until the end of the three-year period before reducing prices. Instead, prices will be reduced when profitable to do so. Assume that prices can be reduced only by $1 increments. Identify when the first future price change should occur (if any).
4. Discuss the differences in viewpoints concerning the decision to decrease prices and the short-run contribution margin analysis done by Helen, the controller. Did quality cost information play an important role in the strategic decision making illustrated by the problem?
Gaston Company manufactures furniture. One of its product lines is an economy-line kitchen table. During the last year, Gaston produced and sold 100,000 units for $100 per unit. Sales of the table are on a bid basis, but Gaston has always been able to win sufficient bids using the $100 price. This year, however, Gaston was losing more than its share of bids. Concerned, Larry Franklin, owner and president of the company, called a meeting of his executive committee (Megan Johnson, marketing manager; Fred Davis, quality manager; Kevin Jones, production manager; and Helen Jackson, controller).
LARRY : I don't understand why we're losing bids. Megan, do you have an explanation?
MEGAN : Yes, as a matter of fact. Two competitors have lowered their price to $92 per unit. That's too big a difference for most of our buyers to ignore. If we want to keep selling our 100,000 units per year, we will need to lower our price to $92. Otherwise, our sales will drop to about 20,000 to 25,000 per year.
HELEN : The unit contribution margin on the table is $10. Lowering the price to $92 will cost us $8 per unit. Based on a sales volume of 100,000, we'd make $200,000 in contribution margin. If we keep the price at $100, our contribution margin would be $200,000 to $250,000. If we have to lose, let's just take the lower market share. It's better than lowering our prices.
MEGAN : Perhaps. But the same thing could happen to some of our other product lines. My sources tell me that these two companies are on the tail end of a major quality improvement program-one that allows them significant savings. We need to rethink our whole competitive strategy-at least if we want to stay in business. Ideally, we should match the price reduction and work to reduce the costs to recapture the lost contribution margin.
FRED : I think I have something to offer. We are about to embark on a new quality improvement program of our own. I have brought the following estimates of the current quality costs for this economy line. As you can see, these costs run about 16 percent of current sales. That's excessive, and we believe that they can be reduced to about 4 percent of sales over time.
LARRY : This sounds good. Fred, how long will it take for you to achieve this reduction?
FRED : All these costs vary with sales level, so I'll express their reduction rate in those terms. Our best guess is that we can reduce these costs by about 1 percent of sales per quarter. So it should take about 12 quarters, or three years, to achieve the full benefit. Keep in mind that this is with an improvement in quality.
MEGAN : This offers us some hope. If we meet the price immediately, we can maintain our market share. Furthermore, if we can ever reach the point of reducing the price below the $92 level, then we can increase our market share. I estimate that we can increase sales by about 10,000 units for every $1 of price reduction beyond the $92 level. Kevin, how much extra capacity for this line do we have?
KEVIN : We can handle an extra 30,000 or 40,000 tables per year.
Required:
1. Assume that Gaston immediately reduces the bid price to $92. How long will it be before the unit contribution margin is restored to $10, assuming that quality costs are reduced as expected and that sales are maintained at 100,000 units per year (25,000 per quarter)?
2. Assume that Gaston holds the price at $92 until the 4 percent target is achieved. At this new level of quality costs, should the price be reduced? If so, by how much should the price be reduced, and what is the increase in contribution margin? Assume that price can be reduced only in $1 increments.
3. Assume that Gaston immediately reduces the price to $92 and begins the quality improvement program. Now, suppose that Gaston does not wait until the end of the three-year period before reducing prices. Instead, prices will be reduced when profitable to do so. Assume that prices can be reduced only by $1 increments. Identify when the first future price change should occur (if any).
4. Discuss the differences in viewpoints concerning the decision to decrease prices and the short-run contribution margin analysis done by Helen, the controller. Did quality cost information play an important role in the strategic decision making illustrated by the problem?
Unlock Deck
Unlock for access to all 67 flashcards in this deck.
Unlock Deck
k this deck
32
Describe the Taguchi quality loss function, and relate it to robust quality.
Unlock Deck
Unlock for access to all 67 flashcards in this deck.
Unlock Deck
k this deck
33
Quality Cost Report
Kang Company reported sales of $3,240,000 in 2013. At the end of the calendar year, the following quality costs were reported:
Required:
1. Prepare a quality cost report.
2. Prepare a graph (pie chart or bar graph) that shows the relative distribution of quality costs, and comment on the distribution.
Unlock Deck
Unlock for access to all 67 flashcards in this deck.
Unlock Deck
k this deck
34
Classification of Environmental Costs
Classify the following environmental activities as prevention costs, detection costs, internal failure costs, or external failure costs. For external failure costs, classify the costs as societal or private. Also, label those activities that are compatible with sustainable development (SD).
1. A company takes actions to reduce the amount of material in its packages.
2. After the activated carbon's useful life, a soft-drink producer returns this material used for purifying water for its beverages to the supplier. The supplier reactivates the carbon for a second use in nonfood applications. As a consequence, many tons of material are prevented from entering landfills.
3. An evaporator system is installed to treat wastewater and collect usable solids for other uses.
4. The inks used to print snack packages (for chips) contain heavy metals.
5. Processes are inspected to ensure compliance with environmental standards.
6. Delivery boxes are used five times and then recycled. This prevents 112 million pounds of cardboard from entering landfills and saves 2 million trees per year.
7. Scrubber equipment is installed to ensure that air emissions are less than the level permitted by law.
8. Local residents are incurring medical costs from illnesses caused by air pollution from automobile exhaust pollution.
9. As part of implementing an environmental perspective for the Balanced Scorecard, environmental performance measures are developed.
10. Because of liquid and solid residues being discharged into a local lake, the lake is no longer fit for swimming, fishing, and other recreational activities.
11. To reduce energy consumption, magnetic ballasts are replaced with electronic ballasts, and more efficient light bulbs and lighting sensors are installed. As a result, 2.3 million kilowatt-hours of electricity are saved per year.
12. Due to a legal settlement, a chemicals company must spend $20,000,000 to clean up contaminated soil.
13. A soft-drink company uses the following practice: In all bottling plants, packages damaged during filling are collected and recycled (glass, plastic, and aluminum).
14. Products are inspected to ensure that the gaseous emissions produced during operation follow legal and company guidelines.
15. Operating pollution control equipment incurs costs.
16. An internal audit is conducted to verify that environmental policies are being followed.
Unlock Deck
Unlock for access to all 67 flashcards in this deck.
Unlock Deck
k this deck
35
Classification of Quality Costs
Classify the following quality costs as prevention, appraisal, internal failure, or external failure. Also, label each cost as variable or fixed with respect to sales volume.
1. Quality engineering
2. Scrap
3. Product recalls
4. Returns and allowances because of quality problems
5. Sales data re-entered because of keying errors
6. Supervision of in-process inspection
7. Quality circles
8. Component inspection and testing
9. Quality training
10. Reinspection of reworked product
11. Product liability
12. Internal audit assessing the effectiveness of quality system
13. Disposal of defective product
14. Downtime attributable to quality problems
15. Quality reporting
16. Proofreading
17. Correction of typing errors
18. In-process inspection
19. Process controls
20. Pilot studies
Unlock Deck
Unlock for access to all 67 flashcards in this deck.
Unlock Deck
k this deck
36
Environmental Cost Report
Verde Company reported operating costs of $50,000,000 as of December 31, 2013, with the following environmental costs:
Required:
1. Prepare an environmental cost report, classifying costs by quality category and expressing each as a percentage of total operating costs. What is the message of this report?
2. Prepare a pie chart that shows the relative distribution of environmental costs by category. What does this report tell you?
3. What if Verde deliberately did not include the cost of damaging the ecosystem because of solid waste disposal in its environmental cost report? Offer possible reasons for this decision. If consciously avoided, is this decision unethical?
Unlock Deck
Unlock for access to all 67 flashcards in this deck.
Unlock Deck
k this deck
37
Discuss the benefits of quality cost reports that simply list the quality costs for each category.
Unlock Deck
Unlock for access to all 67 flashcards in this deck.
Unlock Deck
k this deck
38
What is the difference between a realized external failure cost (environmental) and an unrealized external failure (societal) cost?
Unlock Deck
Unlock for access to all 67 flashcards in this deck.
Unlock Deck
k this deck
39
Quality Cost Summary
Wayne Johnson, president of Banshee Company, recently returned from a conference on quality and productivity. At the conference, he was told that many American firms have quality costs totaling 20 to 30 percent of sales. He, however, was skeptical about this statistic. But even if the quality gurus were right, he was sure that his company's quality costs were much lower-probably less than 5 percent. On the other hand, if he was wrong, he would be passing up an opportunity to improve profits significantly and simultaneously strengthen his competitive position. The possibility was at least worth exploring. He knew that his company produced most of the information needed for quality cost reporting-but there never was a need to bother with any formal quality data gathering and analysis.
This conference, however, had convinced him that a firm's profitability can increase significantly by improving quality-provided the potential for improvement exists. Thus, before committing the company to a quality improvement program, Wayne requested a preliminary estimate of the total quality costs currently being incurred. He also indicated that the costs should be classified into four categories: prevention, appraisal, internal failure, or external failure. He has asked you to prepare a summary of quality costs and to compare the total costs to sales and profits. To assist you in this task, the following information has been prepared from the past year, 2013:
a. Sales revenue, $15,000,000; net income, $1,500,000.
b. During the year, customers returned 90,000 units needing repair. Repair cost averages $1 per unit.
c. Four inspectors are employed, each earning an annual salary of $60,000. These four inspectors are involved only with final inspection (product acceptance).
d. Total scrap is 150,000 units. Of this total, 60 percent is quality related. The cost of scrap is about $5 per unit.
e. Each year, approximately 450,000 units are rejected in final inspection. Of these units, 80 percent can be recovered through rework. The cost of rework is $0.75 per unit.
f. A customer cancelled an order that would have increased profits by $150,000. The customer's reason for cancellation was poor product performance.
g. The company employs three full-time employees in its complaint department. Each earns $40,500 a year.
h. The company gave sales allowances totaling $45,000 due to substandard products being sent to the customer.
i. The company requires all new employees to take its three-hour quality training program. The estimated annual cost of the program is $30,000.
Unlock Deck
Unlock for access to all 67 flashcards in this deck.
Unlock Deck
k this deck
40
Identify and discuss the four kinds of quality costs.
Unlock Deck
Unlock for access to all 67 flashcards in this deck.
Unlock Deck
k this deck
41
Quality Improvement and Profitability Objective
Gagnon Company reported the following sales and quality costs for the past four years. Assume that all quality costs are variable and that all changes in the quality cost ratios are due to a quality improvement program.
Required:
1. Compute the quality costs for all four years. By how much did net income increase from Year 1 to Year 2 because of quality improvements? From Year 2 to Year 3? From Year 3 to Year 4?
2. The management of Gagnon Company believes it is possible to reduce quality costs to 2.5 percent of sales. Assuming sales will continue at the Year 4 level, calculate the additional profit potential facing Gagnon. Is the expectation of improving quality and reducing costs to 2.5 percent of sales realistic? Explain.
3. Assume that Gagnon produces one type of product, which is sold on a bid basis. In Years 1 and 2, the average bid was $400. In Year 1, total variable costs were $250 per unit. In Year 3, competition forced the bid to drop to $380. Compute the total contribution margin in Year 3 assuming the same quality costs as in Year 1. Now, compute the total contribution margin in Year 3 using the actual quality costs for Year 3. What is the increase in profitability resulting from the quality improvements made from Year 1 to Year 3?
Unlock Deck
Unlock for access to all 67 flashcards in this deck.
Unlock Deck
k this deck
42
Environmental Cost Report
At the end of 2013, Bing Pharmaceuticals began to implement an environmental quality management program. As a first step, it identified the following costs in its accounting records as environmentally related for the calendar year just ended:
Required:
1. Prepare an environmental cost report by category. Assume that total operating costs are $150,000,000.
2. Use a pie chart to illustrate the relative distribution percentages for each environmental cost category. Comment on what this distribution communicates to a manager.
Unlock Deck
Unlock for access to all 67 flashcards in this deck.
Unlock Deck
k this deck
43
Quality Cost Report, Interim Performance Report
Recently, Ulrich Company received a report from an external consulting group on its quality costs. The consultants reported that the company's quality costs total about 21 percent of its sales revenues. Somewhat shocked by the magnitude of the costs, Rob Rustin, president of Ulrich Company, decided to launch a major quality improvement program. For the coming year, management decided to reduce quality costs to 17 percent of sales revenues. Although the amount of reduction was ambitious, most company officials believed that the goal could be realized. To improve the monitoring of the quality improvement program, Rob directed Pamela Golding, the controller, to prepare monthly performance reports comparing budgeted and actual quality costs. Budgeted costs and sales for the first two months of the year are as follows:
The following actual sales and actual quality costs were reported for January:
Required:
1. Reorganize the monthly budgets so that quality costs are grouped in one of four categories: appraisal, prevention, internal failure, or external failure. (Essentially, prepare a budgeted cost of quality report.) Also, identify each cost as variable (V) or fixed (F). (Assume that no costs are mixed.)
2. Prepare a performance report for January that compares actual costs with budgeted costs. Comment on the company's progress in improving quality and reducing its quality costs.
Unlock Deck
Unlock for access to all 67 flashcards in this deck.
Unlock Deck
k this deck
44
Activity-Based Environmental Cost Assignments
Pinter Company had the following environmental activities and product information:
1. Environmental activity costs
2. Driver data
3. Other production data
Required:
1. Calculate the activity rates that will be used to assign environmental costs to products.
2. Determine the unit environmental and unit costs of each product using ABC.
3. What if the design costs increased to $360,000 and the cost of toxic waste decreased to $750,000? Assume that Solvent Y uses 6,000 out of 12,000 design hours. Also assume that waste is cut by 50 percent and that Solvent Y is responsible for 14,250 of 15,000 pounds of toxic waste. What is the new environmental cost for Solvent Y?
Unlock Deck
Unlock for access to all 67 flashcards in this deck.
Unlock Deck
k this deck
45
Explain why the Accounting Department should be responsible for producing quality cost reports.
Unlock Deck
Unlock for access to all 67 flashcards in this deck.
Unlock Deck
k this deck
46
What does full environmental costing mean? Full private costing?
Unlock Deck
Unlock for access to all 67 flashcards in this deck.
Unlock Deck
k this deck
47
Quality Cost Performance Reporting: One-Year Trend, Long-Range Analysis
In 2013, Major Company initiated a full-scale, quality improvement program. At the end of the year, Jack Aldredge, the president, noted with some satisfaction that the defects per unit of product had dropped significantly compared to the prior year. He was also pleased that relationships with suppliers had improved and defective materials had declined. The new quality training program was also well accepted by employees. Of most interest to the president, however, was the impact of the quality improvements on profitability. To help assess the dollar impact of the quality improvements, the actual sales and the actual quality costs for 2012 and 2013 are as follows by quality category:
All prevention costs are fixed (by discretion). Assume all other quality costs are unit-level variable.
Required:
1. Compute the relative distribution of quality costs for each year and prepare a pie chart. Do you believe that the company is moving in the right direction in terms of the balance among the quality cost categories? Explain.
2. Prepare a one-year trend performance report for 2013 (compare the actual costs of 2013 with those of 2012, adjusted for differences in sales volume). How much have profits increased because of the quality improvements made by Major Company?
3. Estimate the additional improvement in profits if Major Company ultimately reduces its quality costs to 2.5 percent of sales revenues (assume sales of $10 million).
In 2013, Major Company initiated a full-scale, quality improvement program. At the end of the year, Jack Aldredge, the president, noted with some satisfaction that the defects per unit of product had dropped significantly compared to the prior year. He was also pleased that relationships with suppliers had improved and defective materials had declined. The new quality training program was also well accepted by employees. Of most interest to the president, however, was the impact of the quality improvements on profitability. To help assess the dollar impact of the quality improvements, the actual sales and the actual quality costs for 2012 and 2013 are as follows by quality category:
All prevention costs are fixed (by discretion). Assume all other quality costs are unit-level variable.
Required:
1. Compute the relative distribution of quality costs for each year and prepare a pie chart. Do you believe that the company is moving in the right direction in terms of the balance among the quality cost categories? Explain.
2. Prepare a one-year trend performance report for 2013 (compare the actual costs of 2013 with those of 2012, adjusted for differences in sales volume). How much have profits increased because of the quality improvements made by Major Company?
3. Estimate the additional improvement in profits if Major Company ultimately reduces its quality costs to 2.5 percent of sales revenues (assume sales of $10 million).
Unlock Deck
Unlock for access to all 67 flashcards in this deck.
Unlock Deck
k this deck
48
Explain why external failure costs can be more devastating to a firm than internal failure costs.
Unlock Deck
Unlock for access to all 67 flashcards in this deck.
Unlock Deck
k this deck
49
Quality Costs: Profit Improvement and Distribution Across Categories, Gainsharing
Muskogee Company had sales of $60,000,000 in 2009. In 2013, sales had increased to $75,000,000. A quality improvement program was implemented at the beginning of 2009. Overall conformance quality was targeted for improvement. The quality costs for 2009 and 2013 follow. Assume any changes in quality costs are attributable to improvements in quality.
Required:
1. Compute the quality cost-to-sales ratio for each year. Is this type of improvement possible?
2. Calculate the relative distribution of costs by category for 2009. What do you think of the way costs are distributed? (A pie chart or bar graph may be of some help.) How do you think they will be distributed as the company approaches a zero-defects state?
3. Calculate the relative distribution of costs by category for 2013. What do you think of the level and distribution of quality costs? (A pie chart or bar graph may be of some help.) Do you think further reductions are possible?
4. The quality manager for Muskogee indicated that the external failure costs reported are only the measured costs. He argued that the 2013 external costs were much higher than those reported and that additional investment ought to be made in control costs. Discuss the validity of his viewpoint.
5. Suppose that the manager of Muskogee received a bonus equal to 10 percent of the quality cost savings each year. Do you think that gainsharing is a good or a bad idea? Discuss the risks of gainsharing.
Unlock Deck
Unlock for access to all 67 flashcards in this deck.
Unlock Deck
k this deck
50
Reporting Social Costs
Refer to Exercise 14.21. Suppose that the newly hired environmental manager examines the report and makes the following comment: "This report understates the total environmental costs. It fails to consider the costs we are imposing on the local community. For example, we have polluted the river and lake so much that swimming and fishing are no longer possible. I have heard rumblings from the local citizens, and I'll bet that we will be facing a big cleanup bill in a few years."
Subsequent to the comment, environmental engineering estimated that cleanup costs for the river and lake will cost $7,500,000, assuming the cleanup efforts are required within five years. To pay for the cleanup, annual contributions of $1,312,500 will be invested with the expectation that the fund will grow to $7,500,000 by the end of the fifth year. Assume also that the loss of recreational opportunities is costing the local community $3,000,000 per year.
Required:
1. How would this information alter the report in Exercise 14.21?
2. Current financial reporting standards require that contingent liabilities be disclosed if certain conditions are met. Thus, it is possible that Bing may need to disclose the $7,500,000 cleanup liability. Yet, the opportunity cost for the recreational opportunities need not be disclosed to outside parties. Should Bing voluntarily disclose this cost? Is it likely that it would?
Unlock Deck
Unlock for access to all 67 flashcards in this deck.
Unlock Deck
k this deck
51
Distribution of Quality Costs
Paper Products Division produces paper diapers, napkins, and paper towels. The divisional manager has decided that quality costs can be minimized by distributing quality costs evenly among the four quality categories and reducing them to no more than 5 percent of sales. He has just received the following quality cost report:
Assume that all prevention costs are fixed and that the remaining quality costs are variable (unit-level).
Required:
1. Assume that the sales revenue for the year totaled $2 million, with sales for each product as follows: diapers, $1 million; napkins, $600,000; and paper towels, $400,000. Evaluate the distribution of costs for the division as a whole and for each product line. What recommendations do you have for the divisional manager?
2. Now, assume that total sales are $1 million and have this breakdown: diapers, $500,000; napkins, $300,000; and paper towels, $200,000. Evaluate the distribution of costs for the division as a whole and for each product line in this case. Do you think it is possible to reduce the quality costs to 5 percent of sales for each product line and for the division as a whole and, simultaneously, achieve an equal distribution of the quality costs? What recommendations do you have?
3. Assume total sales of $1 million with this breakdown: diapers, $500,000; napkins, $180,000; and paper towels, $320,000. Evaluate the distribution of quality costs. What recommendations do you have for the divisional manager?
4. Discuss the value of having quality costs reported by segment.
Unlock Deck
Unlock for access to all 67 flashcards in this deck.
Unlock Deck
k this deck
52
Many quality experts maintain that quality is free. Do you agree or disagree? Why or why not?
Unlock Deck
Unlock for access to all 67 flashcards in this deck.
Unlock Deck
k this deck
53
What is ISO 9000? Why do so many companies want this certification?
Unlock Deck
Unlock for access to all 67 flashcards in this deck.
Unlock Deck
k this deck
54
What information is communicated by the unit environmental cost of a product?
Unlock Deck
Unlock for access to all 67 flashcards in this deck.
Unlock Deck
k this deck
55
Trend Analysis, Quality Costs
In 2009, Milton Thayne, president of Carbondale Electronics, received a report indicating that quality costs were 31 percent of sales. Faced with increasing pressures from imported goods, Milton resolved to take measures to improve the overall quality of the company's products. After hiring a consultant in 2010, the company began an aggressive program of total quality control. At the end of 2013, Milton requested an analysis of the progress the company had made in reducing and controlling quality costs. The Accounting Department assembled the following data:
Required:
1. Compute the quality costs as a percentage of sales by category and in total for each year.
2. Prepare a multiple-year trend graph for quality costs, both by total costs and by category. Using the graph, assess the progress made in reducing and controlling quality costs. Does the graph provide evidence that quality has improved? Explain.
3. Using the 2009 quality cost relationships (assume all costs are variable), calculate the quality costs that would have prevailed in 2012. By how much did profits increase in 2012 because of the quality improvement program? Repeat for 2013.
Unlock Deck
Unlock for access to all 67 flashcards in this deck.
Unlock Deck
k this deck
56
Quality Definition and Quality Costs
Rachel Boyce, president of a company that manufactures electronic components, has a number of questions concerning quality and quality costs. She has heard a few things about quality and has asked you to respond to the following questions.
Required:
1. What does it mean to have a quality product or service? Explain how product quality and conformance are related.
2. Yesterday, my quality manager told me that we need to redefine what we mean by a defective product. He said that conforming to specifications ignores the cost of product variability and that further reduction of product variability is a veritable gold mine-just waiting to be mined. What did he mean?
Unlock Deck
Unlock for access to all 67 flashcards in this deck.
Unlock Deck
k this deck
57
Trade-Offs Among Quality Cost Categories, Total Quality Control, Gainsharing
Javier Company has sales of $8 million and quality costs of $1,600,000. The company is embarking on a major quality improvement program. During the next three years, Javier intends to attack failure costs by increasing its appraisal and prevention costs. The "right" prevention activities will be selected, and appraisal costs will be reduced according to the results achieved. For the coming year, management is considering six specific activities: quality training, process control, product inspection, supplier evaluation, prototype testing, and redesign of two major products. To encourage managers to focus on reducing non-value-added quality costs and select the right activities, a bonus pool is established relating to reduction of quality costs. The bonus pool is equal to 10 percent of the total reduction in quality costs.
Current quality costs and the costs of these six activities are given in the following table. Each activity is added sequentially so that its effect on the cost categories can be assessed. For example, after quality training is added, the control costs increase to $320,000, and the failure costs drop to $1,040,000. Even though the activities are presented sequentially, they are totally independent of each other. Thus, only beneficial activities need be selected.
Required:
1. Identify the control activities that should be implemented, and calculate the total quality costs associated with this selection. Assume that an activity is selected only if it increases the bonus pool.
2. Given the activities selected in Requirement 1, calculate the following:
a. The reduction in total quality costs
b. The percentage distribution for control and failure costs
c. The amount for this year's bonus pool
3. Suppose that a quality engineer complained about the gainsharing incentive system. Basically, he argued that the bonus should be based only on reductions of failure and appraisal costs. In this way, investment in prevention activities would be encouraged, and eventually, failure and appraisal costs would be eliminated. After eliminating the non-value-added costs, focus could then be placed on the level of prevention costs. If this approach were adopted, what activities would be selected? Do you agree or disagree with this approach? Explain.
Unlock Deck
Unlock for access to all 67 flashcards in this deck.
Unlock Deck
k this deck
58
Environmental Cost Assignment
Coyle Pharmaceuticals produces two organic chemicals (Org AB and Org XY) used in the production of two of its most wide-selling anti-cancer drugs. The controller and environmental manager have identified the following environmental activities and costs associated with the two products:
Required:
1. Calculate the environmental cost per pound for each product. Which of the two products appears to cause the most degradation to the environment?
2. In which environmental category would you classify excessive use of materials and energy?
3. Suppose that the toxin releases cause health problems for those who live near the chemical plant. The costs, due to missed work and medical treatments, are estimated at $2,025,000 per year. How would assignment of these costs change the unit cost? Should they be assigned?
Unlock Deck
Unlock for access to all 67 flashcards in this deck.
Unlock Deck
k this deck
59
Case on Quality Cost Performance Reports
Iona Company, a large printing company, is in its fourth year of a five-year, quality improvement program. The program began in 2009 with an internal study that revealed the quality costs being incurred. In that year, a five-year plan was developed to lower quality costs to 10 percent of sales by the end of 2013. Sales and quality costs for each year are as follows:
* Budgeted figures.
Quality costs by category are expressed as a percentage of sales as follows:
The detail of the 2013 budget for quality costs is also provided.
All prevention costs are fixed; all other quality costs are variable.
During 2013, the company had $12 million in sales. Actual quality costs for 2012 and 2013 are as follows:
Required:
1. Prepare an interim quality cost performance report for 2013 that compares actual quality costs with budgeted quality costs. Comment on the firm's ability to achieve its quality goals for the year.
2. Prepare a one-period quality performance report for 2013 that compares the actual quality costs of 2012 with the actual costs of 2013. How much did profits change because of improved quality?
3. Prepare a graph that shows the trend in total quality costs as a percentage of sales since the inception of the quality improvement program.
4. Prepare a graph that shows the trend for all four quality cost categories for 2009 through 2013. How does this graph help management know that the reduction in total quality costs is attributable to quality improvements?
5. Assume that the company is preparing a second five-year plan to reduce quality costs to 2.5 percent of sales. Prepare a long-range quality cost performance report assuming sales of $15 million at the end of five years. Assume that the final planned relative distribution of quality costs is as follows: proofreading, 50 percent; other inspection, 13 percent; quality training, 30 percent; and quality reporting, 7 percent.
Unlock Deck
Unlock for access to all 67 flashcards in this deck.
Unlock Deck
k this deck
60
What is the purpose of interim quality standards?
Unlock Deck
Unlock for access to all 67 flashcards in this deck.
Unlock Deck
k this deck
61
What is ecoefficiency?
Unlock Deck
Unlock for access to all 67 flashcards in this deck.
Unlock Deck
k this deck
62
Environmental Costing, Ecoefficiency, and Competitive Advantage
Refer to the data in Exercise 14.23. Suppose that Coyle's manager decides to launch an environmental performance improvement program. First, efforts were made to reduce the amount of packaging. The demand for packaging materials was reduced by 10 percent. Second, a way was found to reuse the packaging materials. Usage of packaging materials changed from one time to two times. Both changes together saved $1,856,250 in packaging costs. Third, the manufacturing processes were redesigned to produce a reduced environmental load. The new processes were able to reduce emissions by 50 percent and private emission costs by 75 percent. The new processes also reduced the demand for energy by one-third. Energy costs were also reduced by the same amount. There was no change in the demand or cost of operating pollution control equipment.
The cost of implementing the changes was $753,750 (salaries of $450,000 for hiring six environmental engineers and $303,750 for treating the packaging materials so they can be reused). Engineering hours used for each process are 11,250 for the Org AB process and 3,750 for the Org XY process.
Required:
1. Calculate the new cost per pound for each product. Assume that the environmental reductions for each product are in the same proportions as the total reductions.
2. Calculate the net savings produced by the environmental changes for each product, in total, and on a per-unit basis. Does this support the concept of ecoefficiency?
3. Classify the activities as prevention, detection, internal failure, or external failure.
4. Describe how the environmental improvements can contribute to improving the firm's competitive position.
Unlock Deck
Unlock for access to all 67 flashcards in this deck.
Unlock Deck
k this deck
63
Environmental Responsibility Accounting, Cost Trends
At the beginning of 2010, Heber Company, an international telecommunications company, embarked on an environmental improvement program. The company set a goal to have all its facilities ISO 14001 registered by 2013. (There are 60 facilities worldwide.) To communicate the environmental progress made, management decided to issue, on a voluntary basis, an annual environmental progress report. Internally, the Accounting Department issued monthly progress reports and developed a number of measures that could be reported even more frequently to assess progress. Heber also asked an international CPA firm to prepare an auditor's report that would comment on the reasonableness and fairness of Heber's approach to assessing and measuring environmental performance.
At the end of 2013, the controller had gathered data that would be used in preparing the environmental progress report. A sample of the data collected is as follows:
As part of its environmental cost reporting system, Heber tracks its total environmental costs. Consider the following cost and sales data:
Required:
1. Using the data, prepare a bar graph for each of the three environmental variables provided (registrations, energy, and greenhouse gases). Comment on the progress made on these three dimensions.
2. Prepare a bar graph for environmental costs expressed as a percentage of sales. Assuming that environmental performance has improved, explain why environmental costs have decreased.
3. Normalize energy consumption by expressing it as a multiple of sales (BTUs/Sales). Now, prepare a bar graph for energy. Comment on the progress made in reducing energy consumption. How does this compare with the conclusion that would be reached using a nonnormalized measure of progress? Which is the best approach? Explain.
Unlock Deck
Unlock for access to all 67 flashcards in this deck.
Unlock Deck
k this deck
64
Quality Definition and Quality Costs
Quality attributes such as performance and aesthetics are important to customers. Performance refers to how consistently and how well a product functions. Aesthetics is concerned with the appearance of tangible products as well as the appearance of the facilities, equipment, personnel, and communication materials associated with services.
Required:
1. Do you agree that aesthetics is an important quality dimension for services? Use dental services as the framework for providing your response.
2. For services, performance can be more carefully defined by expanding its definition to include responsiveness, assurance, and empathy. Describe what you think is meant by these three characteristics as applied to service quality.
Unlock Deck
Unlock for access to all 67 flashcards in this deck.
Unlock Deck
k this deck
65
Trend, Long-Range Performance Report
In 2012, Tru-Delite Frozen Desserts, Inc., instituted a quality improvement program. At the end of 2013, the management of the corporation requested a report to show the amount saved by the measures taken during the year. The actual sales and quality costs for 2012 and 2013 are as follows:
Tru-Delite's management believes that quality costs can be reduced to 2.5 percent of sales within the next five years. At the end of 2017, Tru-Delite's sales are projected to grow to $750,000. The projected relative distribution of quality costs at the end of 2017 is as follows:
Required:
1. Profits increased by what amount due to quality improvements made in 2013?
2. Prepare a long-range performance report that compares the quality costs incurred at the end of 2013 with the quality cost structure expected at the end of 2017.
3. Are the targeted costs in the year 2017 all value-added costs? How would you interpret the variances if the targeted costs are value-added costs?
4. What would be the profit increase in 2017 if the 2.5 percent performance standard is met in that year?
In 2012, Tru-Delite Frozen Desserts, Inc., instituted a quality improvement program. At the end of 2013, the management of the corporation requested a report to show the amount saved by the measures taken during the year. The actual sales and quality costs for 2012 and 2013 are as follows:
Tru-Delite's management believes that quality costs can be reduced to 2.5 percent of sales within the next five years. At the end of 2017, Tru-Delite's sales are projected to grow to $750,000. The projected relative distribution of quality costs at the end of 2017 is as follows:
Required:
1. Profits increased by what amount due to quality improvements made in 2013?
2. Prepare a long-range performance report that compares the quality costs incurred at the end of 2013 with the quality cost structure expected at the end of 2017.
3. Are the targeted costs in the year 2017 all value-added costs? How would you interpret the variances if the targeted costs are value-added costs?
4. What would be the profit increase in 2017 if the 2.5 percent performance standard is met in that year?
Unlock Deck
Unlock for access to all 67 flashcards in this deck.
Unlock Deck
k this deck
66
Which of the following quality costs is an internal failure cost? a. Inspection of reworked units
B) Lost sales because of products failing to meet specifications
C) Replacing a defective product
D) Training production line workers in new quality procedures
B) Lost sales because of products failing to meet specifications
C) Replacing a defective product
D) Training production line workers in new quality procedures
Unlock Deck
Unlock for access to all 67 flashcards in this deck.
Unlock Deck
k this deck
67
Cost Classification, Ecoefficiency, Strategic Environmental Objectives
The following items are listed in an environmental financial statement (issued as part of an environmental progress report):
Environmental benefits (savings, income, and cost avoidance):
• Ozone-depleting substances cost reductions
• Hazardous waste disposal cost reductions
• Hazardous waste material cost reductions
• Nonhazardous waste disposal cost reductions
• Nonhazardous waste material cost reductions
• Recycling income
• Energy conservation cost savings
• Packaging cost reductions
Environmental costs:
• Corporate-level administrative costs
• Auditor fees
• Environmental engineering
• Facility professionals and programs
• Packaging professionals and programs for packaging reductions
• Pollution controls: Operations and maintenance
• Pollution controls: Depreciation
• Attorney fees for cleanup claims, and notices of violations (NOVs)
• Settlements of government claims
• Waste disposal
• Environmental taxes for packaging
• Remediation/cleanup: On-site
• Remediation/cleanup: Off-site
Required:
1. Classify each item in the statement as prevention, detection, internal failure, or external failure. In classifying the items listed in the environmental benefits category, first classify the underlying cost item (e.g., the cost of hazardous waste disposal). Next, think of how you would classify the cost of the activities that led to the cost reduction. That is, how would you classify the macro activity: reducing hazardous waste cost disposal?
2. Assuming ecoefficiency, what relationship over time would you expect to observe between the environmental benefits category and the environmental costs category?
Unlock Deck
Unlock for access to all 67 flashcards in this deck.
Unlock Deck
k this deck
Unlock Deck
Unlock for access to all 67 flashcards in this deck.


