Deck 21: Cases
Full screen (f)
Question
Beauville Furniture Corporation produces sofas, recliners, and lounge chairs. Beauville is located in a medium-sized community in the southeastern part of the United States. It is a major employer in the community. In fact, the economic well-being of the community is tied very strongly to Beauville. Beauville operates a sawmill, a fabric plant, and a furniture plant in the same community.
The sawmill buys logs from independent producers. The sawmill then processes the logs into four grades of lumber: firsts and seconds, No. 1 common, No. 2 common, and No. 3 common. All costs incurred in the mill are common to the four grades of lumber. All four grades of lumber are used by the furniture plant. The mill transfers everything it produces to the furniture plant, and the grades are transferred at cost. Trucks are used to move the lumber from the mill to the furniture plant. Although no outside sales exist, the mill could sell to external customers, and the selling prices of the four grades are known.
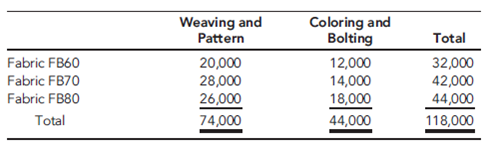
The fabric plant is responsible for producing the fabric that is used by the furniture plant. To produce three totally different fabrics (identified by fabric ID codes FB60, FB70, and FB80, respectively), the plant has three separate production operations-one for each fabric. Thus, production of all three fabrics occurs at the same time in different locations in the plant. Each fabric's production operation has two processes: the weaving and pattern process and the coloring and bolting process. In the weaving and pattern process, yarn is used to create yards of fabric with different designs. In the next process, the fabric is dyed, cut into 25-yard sections, and wrapped around cardboard rods to form 25-yard bolts. The bolts are transported by forklift to the furniture plant's Receiving Department. All of the output of the fabric plant is used by the furniture plant (to produce the sofas and chairs). For accounting purposes, the fabric is transferred at cost to the furniture plant.
The furniture plant produces orders for customers on a special-order basis. The customers specify the quantity, style, fabric, lumber grade, and pattern. Typically, jobs are large (involving at least 500 units). The plant has two production departments: Cutting and Assembly. In the Cutting Department, the fabric and wooden frame components are sized and cut. Other components are purchased from external suppliers and are removed from stores as needed for assembly. After the fabric and wooden components are finished for the entire job, they are moved to the Assembly Department. The Assembly Department takes the individual components and assembles the sofas (or chairs).
Beauville Furniture has been in business for over two decades and has a good reputation. However, during the past five years, Beauville experienced eroding profits and declining sales. Bids were increasingly lost (even aggressive bids) on the more popular models. Yet, the company was winning bids on some of the more-difficult-to-produce items. Lance Hays, the owner and manager, was frustrated. He simply couldn't understand how some of his competitors could sell for such low prices. On a common sofa job involving 500 units, Beauville's bids were running $25 per unit, or $12,500 per job more than the winning bids (on average). Yet, on the more difficult items, Beauville's bids were running about $60 per unit less than the next closest bid. Gisela Berling, vice president of finance, was assigned the task of preparing a cost analysis of the company's product lines. Lance wanted to know if the company's costs were excessive. Perhaps the company was being wasteful, and it was simply costing more to produce furniture than it was costing its competitors.
Gisela prepared herself by reading recent literature on cost management and product costing and attending several conferences that explored the same issues. She then reviewed the costing procedures of the company's mill and two plants and did a preliminary assessment of their soundness. The production costs of the mill were common to all lumber grades and were assigned using the physical units method. Since the output and production costs were fairly uniform throughout the year, the mill used an actual costing system. Although Gisela had no difficulty with actual costing, she decided to explore the effects of using the sales-value-at-split-off method. Thus, cost and production data for the mill were gathered so that an analysis could be conducted. The two plants used normal costing systems. The fabric plant used process costing, and the furniture plant used job-order costing. Both plants used plantwide overhead rates based on direct labor hours. Based on her initial reviews, she concluded that the costing procedures for the fabric plant were satisfactory. Essentially, there was no evidence of product diversity. A statistical analysis revealed that about 90 percent of the variability in the plant's overhead cost could be explained by direct labor hours. Thus, the use of a plantwide overhead rate based on direct labor hours seemed justified. What did concern her, though, was the material waste that she observed in the plant. Maybe a standard cost system would be useful for increasing the overall cost efficiency of the plant. Consequently, as part of her report to Lance, she decided to include a description of the fabric plant's costing procedures-at least for one of the fabric types. She also decided to develop a standard cost sheet for the chosen fabric. The furniture plant, however, was a more difficult matter. Product diversity was present and could be causing some distortions in product costs. Furthermore, statistical analysis revealed that only about 40 percent of the variability in overhead cost was explained by the direct labor hours. She decided that additional analysis was needed so that a sound product costing method could be recommended. One possibility would be to increase the number of overhead rates. Thus, she decided to include departmental data so that the effect of moving to departmental rates could be assessed. Finally, she also wanted to explore the possibility of converting the sawmill and fabric plant into profit centers and changing the existing transfer pricing policy.
With the cooperation of the cost accounting manager for the mill and each plant's controller, she gathered the following data for last year:
Sawmill:
Joint manufacturing costs: $900,000

Fabric Plant:
Budgeted overhead: $1,200,000 (50% fixed)
Practical volume (direct labor hours): 120,000 hours
Actual overhead: $1,150,000 (50% fixed)
Actual hours worked:
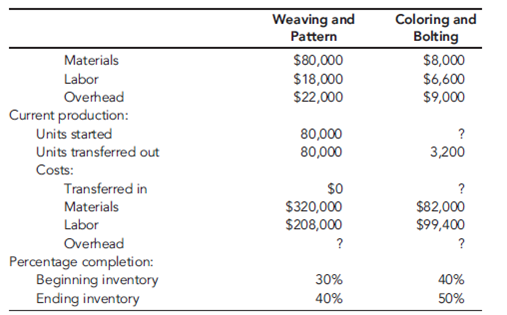
Departmental data on Fabric FB70 (actual costs and actual outcomes):


*Unitsare measured in yards for the Weaving and Pattern Department and in bolts forthe Coloring and Bolting Department. Note: With the exception of the cardboard bolt rods, materials are added at the beginning of each process. The cost of the rods is relatively insignificant and is included in overhead.
Proposed standard cost sheet for Fabric FB70 (for the Coloring and Bolting Department only):

Furniture Plant:
Departmental data (budgeted):
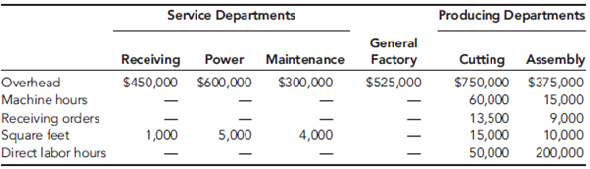
After some discussion with the furniture plant controller, Gisela decided to use machine hours to calculate the overhead rate for the Cutting Department and direct labor hours for the Assembly Department rate (the Cutting Department was more automated than the Assembly Department). As part of her report, she wanted to compare the effects of plantwide rates and departmental rates on the cost of jobs. She wanted to know if overhead costing could be the source of the pricing problems the company was experiencing.
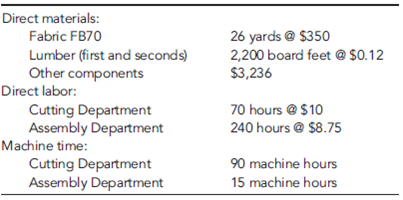
To assess the effect of the different overhead assignment procedures, Gisela decided to examine two prospective jobs. One job, Job A500, could produce 500 sofas, using a frequently requested style and Fabric FB70. Bids on this type of job were being lost more frequently to competitors. The second job, Job B75, would produce 75 specially designed recliners. This job involved a new design and was more difficult for the workers to build. It involved some special cutting requirements and an unfamiliar assembly. Recently, the company seemed to be winning more bids on jobs of this type. To compute the costs of the two jobs, Gisela assembled the following information on the two jobs:
Job A500:

Job B75:

Required
Allocate the joint manufacturing costs to each grade, and calculate the cost per board foot for each grade: (a) using the physical units method of allocation, and (b) using the sales-value-at- split-off method. Which method should the mill use? Explain. What is the effect on the cost of each proposed job if the mill switches to the sales-value-at-split-off method?
The sawmill buys logs from independent producers. The sawmill then processes the logs into four grades of lumber: firsts and seconds, No. 1 common, No. 2 common, and No. 3 common. All costs incurred in the mill are common to the four grades of lumber. All four grades of lumber are used by the furniture plant. The mill transfers everything it produces to the furniture plant, and the grades are transferred at cost. Trucks are used to move the lumber from the mill to the furniture plant. Although no outside sales exist, the mill could sell to external customers, and the selling prices of the four grades are known.
The fabric plant is responsible for producing the fabric that is used by the furniture plant. To produce three totally different fabrics (identified by fabric ID codes FB60, FB70, and FB80, respectively), the plant has three separate production operations-one for each fabric. Thus, production of all three fabrics occurs at the same time in different locations in the plant. Each fabric's production operation has two processes: the weaving and pattern process and the coloring and bolting process. In the weaving and pattern process, yarn is used to create yards of fabric with different designs. In the next process, the fabric is dyed, cut into 25-yard sections, and wrapped around cardboard rods to form 25-yard bolts. The bolts are transported by forklift to the furniture plant's Receiving Department. All of the output of the fabric plant is used by the furniture plant (to produce the sofas and chairs). For accounting purposes, the fabric is transferred at cost to the furniture plant.
The furniture plant produces orders for customers on a special-order basis. The customers specify the quantity, style, fabric, lumber grade, and pattern. Typically, jobs are large (involving at least 500 units). The plant has two production departments: Cutting and Assembly. In the Cutting Department, the fabric and wooden frame components are sized and cut. Other components are purchased from external suppliers and are removed from stores as needed for assembly. After the fabric and wooden components are finished for the entire job, they are moved to the Assembly Department. The Assembly Department takes the individual components and assembles the sofas (or chairs).
Beauville Furniture has been in business for over two decades and has a good reputation. However, during the past five years, Beauville experienced eroding profits and declining sales. Bids were increasingly lost (even aggressive bids) on the more popular models. Yet, the company was winning bids on some of the more-difficult-to-produce items. Lance Hays, the owner and manager, was frustrated. He simply couldn't understand how some of his competitors could sell for such low prices. On a common sofa job involving 500 units, Beauville's bids were running $25 per unit, or $12,500 per job more than the winning bids (on average). Yet, on the more difficult items, Beauville's bids were running about $60 per unit less than the next closest bid. Gisela Berling, vice president of finance, was assigned the task of preparing a cost analysis of the company's product lines. Lance wanted to know if the company's costs were excessive. Perhaps the company was being wasteful, and it was simply costing more to produce furniture than it was costing its competitors.
Gisela prepared herself by reading recent literature on cost management and product costing and attending several conferences that explored the same issues. She then reviewed the costing procedures of the company's mill and two plants and did a preliminary assessment of their soundness. The production costs of the mill were common to all lumber grades and were assigned using the physical units method. Since the output and production costs were fairly uniform throughout the year, the mill used an actual costing system. Although Gisela had no difficulty with actual costing, she decided to explore the effects of using the sales-value-at-split-off method. Thus, cost and production data for the mill were gathered so that an analysis could be conducted. The two plants used normal costing systems. The fabric plant used process costing, and the furniture plant used job-order costing. Both plants used plantwide overhead rates based on direct labor hours. Based on her initial reviews, she concluded that the costing procedures for the fabric plant were satisfactory. Essentially, there was no evidence of product diversity. A statistical analysis revealed that about 90 percent of the variability in the plant's overhead cost could be explained by direct labor hours. Thus, the use of a plantwide overhead rate based on direct labor hours seemed justified. What did concern her, though, was the material waste that she observed in the plant. Maybe a standard cost system would be useful for increasing the overall cost efficiency of the plant. Consequently, as part of her report to Lance, she decided to include a description of the fabric plant's costing procedures-at least for one of the fabric types. She also decided to develop a standard cost sheet for the chosen fabric. The furniture plant, however, was a more difficult matter. Product diversity was present and could be causing some distortions in product costs. Furthermore, statistical analysis revealed that only about 40 percent of the variability in overhead cost was explained by the direct labor hours. She decided that additional analysis was needed so that a sound product costing method could be recommended. One possibility would be to increase the number of overhead rates. Thus, she decided to include departmental data so that the effect of moving to departmental rates could be assessed. Finally, she also wanted to explore the possibility of converting the sawmill and fabric plant into profit centers and changing the existing transfer pricing policy.
With the cooperation of the cost accounting manager for the mill and each plant's controller, she gathered the following data for last year:
Sawmill:
Joint manufacturing costs: $900,000
Fabric Plant:
Budgeted overhead: $1,200,000 (50% fixed)
Practical volume (direct labor hours): 120,000 hours
Actual overhead: $1,150,000 (50% fixed)
Actual hours worked:
Departmental data on Fabric FB70 (actual costs and actual outcomes):
*Unitsare measured in yards for the Weaving and Pattern Department and in bolts forthe Coloring and Bolting Department. Note: With the exception of the cardboard bolt rods, materials are added at the beginning of each process. The cost of the rods is relatively insignificant and is included in overhead.
Proposed standard cost sheet for Fabric FB70 (for the Coloring and Bolting Department only):
Furniture Plant:
Departmental data (budgeted):
After some discussion with the furniture plant controller, Gisela decided to use machine hours to calculate the overhead rate for the Cutting Department and direct labor hours for the Assembly Department rate (the Cutting Department was more automated than the Assembly Department). As part of her report, she wanted to compare the effects of plantwide rates and departmental rates on the cost of jobs. She wanted to know if overhead costing could be the source of the pricing problems the company was experiencing.
To assess the effect of the different overhead assignment procedures, Gisela decided to examine two prospective jobs. One job, Job A500, could produce 500 sofas, using a frequently requested style and Fabric FB70. Bids on this type of job were being lost more frequently to competitors. The second job, Job B75, would produce 75 specially designed recliners. This job involved a new design and was more difficult for the workers to build. It involved some special cutting requirements and an unfamiliar assembly. Recently, the company seemed to be winning more bids on jobs of this type. To compute the costs of the two jobs, Gisela assembled the following information on the two jobs:
Job A500:
Job B75:
Required
Allocate the joint manufacturing costs to each grade, and calculate the cost per board foot for each grade: (a) using the physical units method of allocation, and (b) using the sales-value-at- split-off method. Which method should the mill use? Explain. What is the effect on the cost of each proposed job if the mill switches to the sales-value-at-split-off method?
Question
Zando Pharmaceuticals is an affiliate of the German-based Heisenberg Corporation, which employs 40,000 worldwide. Zando's St. Louis facility houses the U.S. corporate headquarters and Research and Development (R D). It produces 30 products, using 28 different batch processes. The facility has 2,000 employees on-site. In recent years, Zando's profitability has suffered, which can be attributed to increased competition, customer dissatisfaction, and regulatory pressures. Luis Alvarado, president of Zando, called a meeting to consider ways to improve profitability. He labeled the meeting a strategic planning session and invited the following officers: Kathy Shorts, environmental manager; Troy Lewis, head of R D; Johnny Mizukawa, vice president of production and quality; Larry Sower, vice president of finance; and Doreen Savara, marketing vice president.
Luis : "You all have received the quarterly financial reports for the last two years. The trends are negative. We are losing market share, profits are decreasing, and our costs seem to be increasing. We need to take actions to increase sales and reduce costs, and we need to do so as quickly as possible. Given our research strengths, it seems to me that our best bet is to grow revenues by introducing new products with proprietary rights. As far as costs are concerned, we need to improve our performance on that dimension as well. Lower per-unit costs for new and existing products are needed. Any suggestions?"
Troy : "For our products, our ability to control costs resides in development-my area-rather than manufacturing. We probably need to pay more attention to product and process design issues to ensure a reasonably level per-unit cost. Revenues are also affected in this stage. Once we patent a drug, the clock begins to tick, and we need to reduce time to market. Significantly, reducing time to market will allow us to generate revenues for a longer period of time than we are currently experiencing. It would also be helpful if we could reduce the cycle time for product development. Both actions would increase revenues. Finally, we can increase revenues by increasing the volume of new products."
Johnny : "There is a lot of merit to the observation that cost reduction opportunities reside mostly in product development. Once a drug is approved, its approval includes the manufacturing process. Any future changes in the manufacturing process require approval from the U.S. Food and Drug Administration. Because of this, we have been reluctant, historically, to engage in process improvement or reengineering. However, I wonder if we shouldn't reconsider this longstanding policy. Some of the quality problems we have could be corrected by changing some of our existing processes, and the costs saved may easily exceed any cost incurred from seeking FDA approval. I think our quality costs are at least 15 percent of sales. That's a lot of opportunity for improvement."
Kathy : "I agree that cost reduction-both in the product development stage and the manufacturing stage-should be a key strategic theme. The environmental area also offers some very good opportunities. A recent pollution prevention act passed by the legislature requires that we calculate the costs of generating hazardous substances for each process. This act was the incentive we needed to begin developing an environmental cost management system. The results so far indicate that environmental costs are much more than we realized. They are estimated to be in the range of 20 to 30 percent of total operating costs. Environmental costs can be reduced by such things as computerizing chemical inventory, eliminating the use of chlorinated solvents and other hazardous materials, reducing our use of virgin feedstocks, and redesigning processes and products so that we can reduce toxic residue release. We can really have a positive environmental impact while simultaneously reducing costs if more attention is paid to environmental issues during product development."
Doreen : "I like what I am hearing because I think that it also affects our ability to increase market share and revenues. For example, environmental impact is one of our major concerns. Some retail pharmacy chains pay particular attention to green products, and right now we are not competing well. Our environmental image is negative and needs to be improved. I am convinced that doing so will allow us to increase market share. Quality is another important matter. We have had to recall two batches of products during the past two years due to poor quality, and this has hurt our image more than the environmental issue. Improving the processes to avoid these kinds of problems will save us a lot of grief. Product image and reputation are essential to increasing customer satisfaction and market share."
Luis : "We started with the need to improve financial performance by increasing revenues and reducing costs. So far, we have some very good suggestions to help achieve these two objectives, but I have some concerns. First, do we have the talent and capabilities to improve quality and environmental performance? Troy, do your professionals really understand what they need to do to improve process and product designs so that we can see the desired quality and environmental improvements? Also, how can we reduce the cycle time for products and the time to market once patented?"
Troy : "Let me answer those questions in order. First, we probably are lacking the understanding on the design issues. We will need to do some training to help our research scientists and chemical engineers understand the consequences. We may need to hire a couple of professionals who have experience in dealing with these issues. Second, we may need to make cycle time and time to market significant performance measures and reward our people for actions that reduce those measures. Our employees need to align their interests with those of the company. If we can achieve this, we should see more revenue produced per employee."
Luis : "Good. Now, Johnny, tell us about production and quality. Do our manufacturing engineers and production workers need help with environmental and quality issues?"
Johnny : "Without question, training will be needed. Moreover, I really need to hire a couple of quality engineers."
Kathy : "I also think that we need an environmental engineer with experience in pharmaceutical manufacturing processes."
Luis : "Good. We certainly shouldn't ignore the necessary infrastructure to bring about the needed changes. Larry, you have been relatively quiet, what do you think about all this? Do you have any suggestions?"
Larry : "Infrastructure is important. If this is all going to work, timely and accurate information will be needed. It is hard to design products and processes with cost being a significant issue without providing the right kind of cost information. We are in the process of revamping the cost management information system so that it is activity based and so that we can provide quality and environmental cost information. After listening to the comments made here, I might also suggest that we need a strategic measurement system that can be used to align the interests of our employees with our improvement strategy. People need to know what is important, that the important factors are being measured, and that they are going to be evaluated and rewarded based on these factors. Finally, I would encourage the use of target costing to help manage costs during product development. To help you all understand the importance of good information, I have assembled some activity data relating to two new products currently under development. These two products will use the same process, using different setups. The data are organized into resource, activity, and cost object modules with an accompanying list of activity drivers to facilitate the use of an ABC software package recently acquired by Zando."
Resource Module (Projected General Ledger Costs of Manufacturing Process Associated with the Two Products)

Activity Module

Cost Object Module (Products and Projected Activity Usage)

List of Activity Drivers

Required
Following Larry's suggestion, Luis decided to use target costing to help improve new product profitability. Based on analyses by Luis and Doreen, the target prices for XK1 and XK5 are $50 per pound and $35 per pound, respectively. Luis has indicated that any new product should earn a gross profit equal to 20 percent of sales. Based on this information, answer the following:
a. What is the target cost for each product? Given this information, what should be done?
b. Suppose Doreen indicates that sales for each product can be increased by 50 percent if the selling price is lowered by 10 percent. Assuming the same target profit (Luis wants the original target profit per pound maintained), calculate the new target costs. If all non-value-added costs were eliminated, could the target be met? (Calculate the unit cost at the 50,000-unit level.) Now, calculate the effect on total profits under a scenario where non-value-added costs are not eliminated versus a scenario where all non-value-added costs are eliminated. (Include in this analysis any possible increase in sales volume.)
Luis : "You all have received the quarterly financial reports for the last two years. The trends are negative. We are losing market share, profits are decreasing, and our costs seem to be increasing. We need to take actions to increase sales and reduce costs, and we need to do so as quickly as possible. Given our research strengths, it seems to me that our best bet is to grow revenues by introducing new products with proprietary rights. As far as costs are concerned, we need to improve our performance on that dimension as well. Lower per-unit costs for new and existing products are needed. Any suggestions?"
Troy : "For our products, our ability to control costs resides in development-my area-rather than manufacturing. We probably need to pay more attention to product and process design issues to ensure a reasonably level per-unit cost. Revenues are also affected in this stage. Once we patent a drug, the clock begins to tick, and we need to reduce time to market. Significantly, reducing time to market will allow us to generate revenues for a longer period of time than we are currently experiencing. It would also be helpful if we could reduce the cycle time for product development. Both actions would increase revenues. Finally, we can increase revenues by increasing the volume of new products."
Johnny : "There is a lot of merit to the observation that cost reduction opportunities reside mostly in product development. Once a drug is approved, its approval includes the manufacturing process. Any future changes in the manufacturing process require approval from the U.S. Food and Drug Administration. Because of this, we have been reluctant, historically, to engage in process improvement or reengineering. However, I wonder if we shouldn't reconsider this longstanding policy. Some of the quality problems we have could be corrected by changing some of our existing processes, and the costs saved may easily exceed any cost incurred from seeking FDA approval. I think our quality costs are at least 15 percent of sales. That's a lot of opportunity for improvement."
Kathy : "I agree that cost reduction-both in the product development stage and the manufacturing stage-should be a key strategic theme. The environmental area also offers some very good opportunities. A recent pollution prevention act passed by the legislature requires that we calculate the costs of generating hazardous substances for each process. This act was the incentive we needed to begin developing an environmental cost management system. The results so far indicate that environmental costs are much more than we realized. They are estimated to be in the range of 20 to 30 percent of total operating costs. Environmental costs can be reduced by such things as computerizing chemical inventory, eliminating the use of chlorinated solvents and other hazardous materials, reducing our use of virgin feedstocks, and redesigning processes and products so that we can reduce toxic residue release. We can really have a positive environmental impact while simultaneously reducing costs if more attention is paid to environmental issues during product development."
Doreen : "I like what I am hearing because I think that it also affects our ability to increase market share and revenues. For example, environmental impact is one of our major concerns. Some retail pharmacy chains pay particular attention to green products, and right now we are not competing well. Our environmental image is negative and needs to be improved. I am convinced that doing so will allow us to increase market share. Quality is another important matter. We have had to recall two batches of products during the past two years due to poor quality, and this has hurt our image more than the environmental issue. Improving the processes to avoid these kinds of problems will save us a lot of grief. Product image and reputation are essential to increasing customer satisfaction and market share."
Luis : "We started with the need to improve financial performance by increasing revenues and reducing costs. So far, we have some very good suggestions to help achieve these two objectives, but I have some concerns. First, do we have the talent and capabilities to improve quality and environmental performance? Troy, do your professionals really understand what they need to do to improve process and product designs so that we can see the desired quality and environmental improvements? Also, how can we reduce the cycle time for products and the time to market once patented?"
Troy : "Let me answer those questions in order. First, we probably are lacking the understanding on the design issues. We will need to do some training to help our research scientists and chemical engineers understand the consequences. We may need to hire a couple of professionals who have experience in dealing with these issues. Second, we may need to make cycle time and time to market significant performance measures and reward our people for actions that reduce those measures. Our employees need to align their interests with those of the company. If we can achieve this, we should see more revenue produced per employee."
Luis : "Good. Now, Johnny, tell us about production and quality. Do our manufacturing engineers and production workers need help with environmental and quality issues?"
Johnny : "Without question, training will be needed. Moreover, I really need to hire a couple of quality engineers."
Kathy : "I also think that we need an environmental engineer with experience in pharmaceutical manufacturing processes."
Luis : "Good. We certainly shouldn't ignore the necessary infrastructure to bring about the needed changes. Larry, you have been relatively quiet, what do you think about all this? Do you have any suggestions?"
Larry : "Infrastructure is important. If this is all going to work, timely and accurate information will be needed. It is hard to design products and processes with cost being a significant issue without providing the right kind of cost information. We are in the process of revamping the cost management information system so that it is activity based and so that we can provide quality and environmental cost information. After listening to the comments made here, I might also suggest that we need a strategic measurement system that can be used to align the interests of our employees with our improvement strategy. People need to know what is important, that the important factors are being measured, and that they are going to be evaluated and rewarded based on these factors. Finally, I would encourage the use of target costing to help manage costs during product development. To help you all understand the importance of good information, I have assembled some activity data relating to two new products currently under development. These two products will use the same process, using different setups. The data are organized into resource, activity, and cost object modules with an accompanying list of activity drivers to facilitate the use of an ABC software package recently acquired by Zando."
Resource Module (Projected General Ledger Costs of Manufacturing Process Associated with the Two Products)
Activity Module
Cost Object Module (Products and Projected Activity Usage)
List of Activity Drivers
Required
Following Larry's suggestion, Luis decided to use target costing to help improve new product profitability. Based on analyses by Luis and Doreen, the target prices for XK1 and XK5 are $50 per pound and $35 per pound, respectively. Luis has indicated that any new product should earn a gross profit equal to 20 percent of sales. Based on this information, answer the following:
a. What is the target cost for each product? Given this information, what should be done?
b. Suppose Doreen indicates that sales for each product can be increased by 50 percent if the selling price is lowered by 10 percent. Assuming the same target profit (Luis wants the original target profit per pound maintained), calculate the new target costs. If all non-value-added costs were eliminated, could the target be met? (Calculate the unit cost at the 50,000-unit level.) Now, calculate the effect on total profits under a scenario where non-value-added costs are not eliminated versus a scenario where all non-value-added costs are eliminated. (Include in this analysis any possible increase in sales volume.)
Question
Beauville Furniture Corporation produces sofas, recliners, and lounge chairs. Beauville is located in a medium-sized community in the southeastern part of the United States. It is a major employer in the community. In fact, the economic well-being of the community is tied very strongly to Beauville. Beauville operates a sawmill, a fabric plant, and a furniture plant in the same community.
The sawmill buys logs from independent producers. The sawmill then processes the logs into four grades of lumber: firsts and seconds, No. 1 common, No. 2 common, and No. 3 common. All costs incurred in the mill are common to the four grades of lumber. All four grades of lumber are used by the furniture plant. The mill transfers everything it produces to the furniture plant, and the grades are transferred at cost. Trucks are used to move the lumber from the mill to the furniture plant. Although no outside sales exist, the mill could sell to external customers, and the selling prices of the four grades are known.
The fabric plant is responsible for producing the fabric that is used by the furniture plant. To produce three totally different fabrics (identified by fabric ID codes FB60, FB70, and FB80, respectively), the plant has three separate production operations-one for each fabric. Thus, production of all three fabrics occurs at the same time in different locations in the plant. Each fabric's production operation has two processes: the weaving and pattern process and the coloring and bolting process. In the weaving and pattern process, yarn is used to create yards of fabric with different designs. In the next process, the fabric is dyed, cut into 25-yard sections, and wrapped around cardboard rods to form 25-yard bolts. The bolts are transported by forklift to the furniture plant's Receiving Department. All of the output of the fabric plant is used by the furniture plant (to produce the sofas and chairs). For accounting purposes, the fabric is transferred at cost to the furniture plant.
The furniture plant produces orders for customers on a special-order basis. The customers specify the quantity, style, fabric, lumber grade, and pattern. Typically, jobs are large (involving at least 500 units). The plant has two production departments: Cutting and Assembly. In the Cutting Department, the fabric and wooden frame components are sized and cut. Other components are purchased from external suppliers and are removed from stores as needed for assembly. After the fabric and wooden components are finished for the entire job, they are moved to the Assembly Department. The Assembly Department takes the individual components and assembles the sofas (or chairs).
Beauville Furniture has been in business for over two decades and has a good reputation. However, during the past five years, Beauville experienced eroding profits and declining sales. Bids were increasingly lost (even aggressive bids) on the more popular models. Yet, the company was winning bids on some of the more-difficult-to-produce items. Lance Hays, the owner and manager, was frustrated. He simply couldn't understand how some of his competitors could sell for such low prices. On a common sofa job involving 500 units, Beauville's bids were running $25 per unit, or $12,500 per job more than the winning bids (on average). Yet, on the more difficult items, Beauville's bids were running about $60 per unit less than the next closest bid. Gisela Berling, vice president of finance, was assigned the task of preparing a cost analysis of the company's product lines. Lance wanted to know if the company's costs were excessive. Perhaps the company was being wasteful, and it was simply costing more to produce furniture than it was costing its competitors.
Gisela prepared herself by reading recent literature on cost management and product costing and attending several conferences that explored the same issues. She then reviewed the costing procedures of the company's mill and two plants and did a preliminary assessment of their soundness. The production costs of the mill were common to all lumber grades and were assigned using the physical units method. Since the output and production costs were fairly uniform throughout the year, the mill used an actual costing system. Although Gisela had no difficulty with actual costing, she decided to explore the effects of using the sales-value-at-split-off method. Thus, cost and production data for the mill were gathered so that an analysis could be conducted. The two plants used normal costing systems. The fabric plant used process costing, and the furniture plant used job-order costing. Both plants used plantwide overhead rates based on direct labor hours. Based on her initial reviews, she concluded that the costing procedures for the fabric plant were satisfactory. Essentially, there was no evidence of product diversity. A statistical analysis revealed that about 90 percent of the variability in the plant's overhead cost could be explained by direct labor hours. Thus, the use of a plantwide overhead rate based on direct labor hours seemed justified. What did concern her, though, was the material waste that she observed in the plant. Maybe a standard cost system would be useful for increasing the overall cost efficiency of the plant. Consequently, as part of her report to Lance, she decided to include a description of the fabric plant's costing procedures-at least for one of the fabric types. She also decided to develop a standard cost sheet for the chosen fabric. The furniture plant, however, was a more difficult matter. Product diversity was present and could be causing some distortions in product costs. Furthermore, statistical analysis revealed that only about 40 percent of the variability in overhead cost was explained by the direct labor hours. She decided that additional analysis was needed so that a sound product costing method could be recommended. One possibility would be to increase the number of overhead rates. Thus, she decided to include departmental data so that the effect of moving to departmental rates could be assessed. Finally, she also wanted to explore the possibility of converting the sawmill and fabric plant into profit centers and changing the existing transfer pricing policy.
With the cooperation of the cost accounting manager for the mill and each plant's controller, she gathered the following data for last year:
Sawmill:
Joint manufacturing costs: $900,000

Fabric Plant:
Budgeted overhead: $1,200,000 (50% fixed)
Practical volume (direct labor hours): 120,000 hours
Actual overhead: $1,150,000 (50% fixed)
Actual hours worked:

Departmental data on Fabric FB70 (actual costs and actual outcomes):


*Unitsare measured in yards for the Weaving and Pattern Department and in bolts forthe Coloring and Bolting Department. Note: With the exception of the cardboard bolt rods, materials are added at the beginning of each process. The cost of the rods is relatively insignificant and is included in overhead.
Proposed standard cost sheet for Fabric FB70 (for the Coloring and Bolting Department only):

Furniture Plant:
Departmental data (budgeted):

After some discussion with the furniture plant controller, Gisela decided to use machine hours to calculate the overhead rate for the Cutting Department and direct labor hours for the Assembly Department rate (the Cutting Department was more automated than the Assembly Department). As part of her report, she wanted to compare the effects of plantwide rates and departmental rates on the cost of jobs. She wanted to know if overhead costing could be the source of the pricing problems the company was experiencing.
To assess the effect of the different overhead assignment procedures, Gisela decided to examine two prospective jobs. One job, Job A500, could produce 500 sofas, using a frequently requested style and Fabric FB70. Bids on this type of job were being lost more frequently to competitors. The second job, Job B75, would produce 75 specially designed recliners. This job involved a new design and was more difficult for the workers to build. It involved some special cutting requirements and an unfamiliar assembly. Recently, the company seemed to be winning more bids on jobs of this type. To compute the costs of the two jobs, Gisela assembled the following information on the two jobs:
Job A500:

Job B75:
Required
Calculate the plantwide overhead rate for the fabric plant.
The sawmill buys logs from independent producers. The sawmill then processes the logs into four grades of lumber: firsts and seconds, No. 1 common, No. 2 common, and No. 3 common. All costs incurred in the mill are common to the four grades of lumber. All four grades of lumber are used by the furniture plant. The mill transfers everything it produces to the furniture plant, and the grades are transferred at cost. Trucks are used to move the lumber from the mill to the furniture plant. Although no outside sales exist, the mill could sell to external customers, and the selling prices of the four grades are known.
The fabric plant is responsible for producing the fabric that is used by the furniture plant. To produce three totally different fabrics (identified by fabric ID codes FB60, FB70, and FB80, respectively), the plant has three separate production operations-one for each fabric. Thus, production of all three fabrics occurs at the same time in different locations in the plant. Each fabric's production operation has two processes: the weaving and pattern process and the coloring and bolting process. In the weaving and pattern process, yarn is used to create yards of fabric with different designs. In the next process, the fabric is dyed, cut into 25-yard sections, and wrapped around cardboard rods to form 25-yard bolts. The bolts are transported by forklift to the furniture plant's Receiving Department. All of the output of the fabric plant is used by the furniture plant (to produce the sofas and chairs). For accounting purposes, the fabric is transferred at cost to the furniture plant.
The furniture plant produces orders for customers on a special-order basis. The customers specify the quantity, style, fabric, lumber grade, and pattern. Typically, jobs are large (involving at least 500 units). The plant has two production departments: Cutting and Assembly. In the Cutting Department, the fabric and wooden frame components are sized and cut. Other components are purchased from external suppliers and are removed from stores as needed for assembly. After the fabric and wooden components are finished for the entire job, they are moved to the Assembly Department. The Assembly Department takes the individual components and assembles the sofas (or chairs).
Beauville Furniture has been in business for over two decades and has a good reputation. However, during the past five years, Beauville experienced eroding profits and declining sales. Bids were increasingly lost (even aggressive bids) on the more popular models. Yet, the company was winning bids on some of the more-difficult-to-produce items. Lance Hays, the owner and manager, was frustrated. He simply couldn't understand how some of his competitors could sell for such low prices. On a common sofa job involving 500 units, Beauville's bids were running $25 per unit, or $12,500 per job more than the winning bids (on average). Yet, on the more difficult items, Beauville's bids were running about $60 per unit less than the next closest bid. Gisela Berling, vice president of finance, was assigned the task of preparing a cost analysis of the company's product lines. Lance wanted to know if the company's costs were excessive. Perhaps the company was being wasteful, and it was simply costing more to produce furniture than it was costing its competitors.
Gisela prepared herself by reading recent literature on cost management and product costing and attending several conferences that explored the same issues. She then reviewed the costing procedures of the company's mill and two plants and did a preliminary assessment of their soundness. The production costs of the mill were common to all lumber grades and were assigned using the physical units method. Since the output and production costs were fairly uniform throughout the year, the mill used an actual costing system. Although Gisela had no difficulty with actual costing, she decided to explore the effects of using the sales-value-at-split-off method. Thus, cost and production data for the mill were gathered so that an analysis could be conducted. The two plants used normal costing systems. The fabric plant used process costing, and the furniture plant used job-order costing. Both plants used plantwide overhead rates based on direct labor hours. Based on her initial reviews, she concluded that the costing procedures for the fabric plant were satisfactory. Essentially, there was no evidence of product diversity. A statistical analysis revealed that about 90 percent of the variability in the plant's overhead cost could be explained by direct labor hours. Thus, the use of a plantwide overhead rate based on direct labor hours seemed justified. What did concern her, though, was the material waste that she observed in the plant. Maybe a standard cost system would be useful for increasing the overall cost efficiency of the plant. Consequently, as part of her report to Lance, she decided to include a description of the fabric plant's costing procedures-at least for one of the fabric types. She also decided to develop a standard cost sheet for the chosen fabric. The furniture plant, however, was a more difficult matter. Product diversity was present and could be causing some distortions in product costs. Furthermore, statistical analysis revealed that only about 40 percent of the variability in overhead cost was explained by the direct labor hours. She decided that additional analysis was needed so that a sound product costing method could be recommended. One possibility would be to increase the number of overhead rates. Thus, she decided to include departmental data so that the effect of moving to departmental rates could be assessed. Finally, she also wanted to explore the possibility of converting the sawmill and fabric plant into profit centers and changing the existing transfer pricing policy.
With the cooperation of the cost accounting manager for the mill and each plant's controller, she gathered the following data for last year:
Sawmill:
Joint manufacturing costs: $900,000
Fabric Plant:
Budgeted overhead: $1,200,000 (50% fixed)
Practical volume (direct labor hours): 120,000 hours
Actual overhead: $1,150,000 (50% fixed)
Actual hours worked:
Departmental data on Fabric FB70 (actual costs and actual outcomes):
*Unitsare measured in yards for the Weaving and Pattern Department and in bolts forthe Coloring and Bolting Department. Note: With the exception of the cardboard bolt rods, materials are added at the beginning of each process. The cost of the rods is relatively insignificant and is included in overhead.
Proposed standard cost sheet for Fabric FB70 (for the Coloring and Bolting Department only):
Furniture Plant:
Departmental data (budgeted):
After some discussion with the furniture plant controller, Gisela decided to use machine hours to calculate the overhead rate for the Cutting Department and direct labor hours for the Assembly Department rate (the Cutting Department was more automated than the Assembly Department). As part of her report, she wanted to compare the effects of plantwide rates and departmental rates on the cost of jobs. She wanted to know if overhead costing could be the source of the pricing problems the company was experiencing.
To assess the effect of the different overhead assignment procedures, Gisela decided to examine two prospective jobs. One job, Job A500, could produce 500 sofas, using a frequently requested style and Fabric FB70. Bids on this type of job were being lost more frequently to competitors. The second job, Job B75, would produce 75 specially designed recliners. This job involved a new design and was more difficult for the workers to build. It involved some special cutting requirements and an unfamiliar assembly. Recently, the company seemed to be winning more bids on jobs of this type. To compute the costs of the two jobs, Gisela assembled the following information on the two jobs:
Job A500:
Job B75:
Required
Calculate the plantwide overhead rate for the fabric plant.
Question
Sabrina Hoffman is founder and CEO of Golden Care, Inc., which owns and operates several assisted- living facilities. The facilities are apartment-style buildings with 25 to 30 one- or two-bedroom apartments. While each apartment has its own complete kitchen, in every building Golden Care offers communal dining options and an on-site nurse who is available 24 hours a day. Residents can choose monthly meal options that include one or two meals per day in the dining room. Residents who require nursing services (e.g., blood pressure monitoring and injections) can receive those services from the nurse. However, Golden Care facilities are not nursing homes, all residents are ambulatory, and custodial care is not an option. In the five years it has been in operation, the company has expanded from one facility to five, located in southwestern cities. The income statement for last year follows.

Sabrina originally got into the business because she had trouble finding adequate facilities for her mother. The concept worked well, and income over the past five years had grown nicely at 20 percent per year. However, Sabrina sensed clouds on the horizon. She knew that the population was aging and that her current clients would be moving to more traditional forms of nursing care. As a result, Sabrina wanted to consider adding one or more nursing homes to Golden Care. These nursing homes would be staffed around the clock with RNs and LPNs. The residents would likely have more severe medical problems and would be confined to beds or wheelchairs. Sabrina knew that quality care of this type was needed. So, she contacted Peter Verdon, her marketing manager, and Bernadette Masters, her accountant, for a brainstorming session.
Peter : "Sabrina, I really like the concept. As you know, several of our facilities have faced seeing their long-term residents move out to local nursing homes. Not only are these homes of lower quality than what we could provide, but losing a resident is heartrending for the staff, as well as for the remaining residents. I like the idea of providing a transition from less care to more."
Bernadette : "I agree with you, Peter. But let's not forget the differences between assisted-living and full-time, nursing-home-type care. Our expenses will really increase."
Sabrina : "That's why I wanted to talk with both of you. As you know, Golden Care's mission statement emphasizes the need to make a profit. We can't continue to serve our residents and provide high- quality care if we don't make enough money to pay our staff a living wage and earn enough of a profit to smooth over the rough patches and continue to improve our business. Could the two of you look into this idea, and get back to me in a week or so?"
Throughout the following week, the three communicated by e-mail. By the end of the week, a number of possibilities had surfaced, and these were summarized in a message from Bernadette to the others.
TO: [email protected], [email protected]
FROM: [email protected]
MESSAGE:
I've compiled the ideas from all of our e-mails into the following list. This may be a good starting point for our meeting tomorrow.
1. Buy an existing nursing home in one of Golden Care's current locations.
2. Buy an existing nursing home in another city.
3. Build a new nursing home facility in one of Golden Care's current locations.
4. Build a new nursing home facility in another city.
5. Build a wing on to an existing Golden Care facility. The Apache Junction facility has sufficient open land for an addition.
The next day, Sabrina, Peter, and Bernadette met again in Sabrina's office.
Sabrina : "I didn't realize there were so many possibilities. Are we going to have to work up numbers on each of them?"
Bernadette : "No, I think we can eliminate a few of them pretty quickly. For example, building a new facility would cost more than the other options, and it would involve the most risk."
Peter : "I agree, and I also think we might eliminate the purchase of an existing nursing home for the same reasons. Also, existing homes would not give us the option of building a facility that is state of the art and meets our needs, and it would lock us into a preexisting patient mix."
Sabrina : "I like that thinking. Let's restrict our attention to Option 5."
Bernadette : "I thought you might like that option, so Peter and I sketched out two alternatives for an extension of the Apache Junction building. We call the alternatives Basic Care and Lifestyle Care."
Peter : "There are different markets for each type of care. If we want to concentrate on Medicare and Medicaid patients, the reimbursement is lower, and we would want to offer the Basic Care option. Private insurance and private-pay patients could afford more services; if we are marketing to these patients, we could offer the Lifestyle Care option. Both alternatives provide high-quality nursing care. Basic Care concentrates on the quality nursing and maintenance activities. For example, the addition would have 25 double rooms, two nursing stations, two recreation rooms, a treatment room, and an office. The Lifestyle Care option adds physical and recreational therapy with a specially equipped gym and pool. That addition would have 30 single rooms, two nursing stations, a recreation room, a swimming pool, a hydrotherapy spa and gym, a treatment room, and an office. In each case, there would be cable TV and telephone hookups in each room and a buffer area between the nursing home and the apartments."
Sabrina : "Why the buffer area? Won't that add unnecessary cost?"
Peter : "It adds cost, but it will be well worth it. Sabrina, you must remember that the nursing home patients are different from the apartment residents. Some of the patients will have advanced dementia. We'll lose apartment residents in a hurry if they have to be reminded every day of what might be in store for them later on."
Sabrina : "I see your point. Bernadette, what will these two plans cost? I'll tell you right now that I like the Lifestyle Care option better. It fits with our history of doing whatever we can to make life better for our residents."
Bernadette : "I've checked into the costs of putting on a new wing and operating both alternatives. Here's a listing."


"In both cases, total administrative costs for Golden Care would increase by $30,000 per year. This seems high, but the increased legal and insurance requirements will add significantly more paperwork and accounting."
Sabrina : "All this sounds reasonable, but why is reimbursement such an important factor?"
Peter : "Well, if you admit Medicaid patients, the state will reimburse at most $30,000 per year. Private insurance policies will pay roughly $46,000 per year. We can charge up to about $65,000 for private patients, but this type of care is so expensive that many of these patients exhaust their funds and go on Medicaid. The nice aspect of Medicaid is that we can be virtually assured that we will operate at capacity."
Sabrina : "Can we cross that bridge when we come to it?"
Peter : " No, not really. Once the patient is a resident of our facility, it is hard to evict him or her. Also, while it is legal to force patients out before they go on Medicaid and to refuse to accept Medicaid patients, once we do accept Medicaid patients, we are prevented by law from evicting them-no matter how high our costs go."
Sabrina : "OK, it looks as if we have some hard work ahead of us to decide whether or not to get into this line of business."
Required
How did Sabrina, Bernadette, and Peter use the tactical decision-making model of Chapter 17?
Sabrina originally got into the business because she had trouble finding adequate facilities for her mother. The concept worked well, and income over the past five years had grown nicely at 20 percent per year. However, Sabrina sensed clouds on the horizon. She knew that the population was aging and that her current clients would be moving to more traditional forms of nursing care. As a result, Sabrina wanted to consider adding one or more nursing homes to Golden Care. These nursing homes would be staffed around the clock with RNs and LPNs. The residents would likely have more severe medical problems and would be confined to beds or wheelchairs. Sabrina knew that quality care of this type was needed. So, she contacted Peter Verdon, her marketing manager, and Bernadette Masters, her accountant, for a brainstorming session.
Peter : "Sabrina, I really like the concept. As you know, several of our facilities have faced seeing their long-term residents move out to local nursing homes. Not only are these homes of lower quality than what we could provide, but losing a resident is heartrending for the staff, as well as for the remaining residents. I like the idea of providing a transition from less care to more."
Bernadette : "I agree with you, Peter. But let's not forget the differences between assisted-living and full-time, nursing-home-type care. Our expenses will really increase."
Sabrina : "That's why I wanted to talk with both of you. As you know, Golden Care's mission statement emphasizes the need to make a profit. We can't continue to serve our residents and provide high- quality care if we don't make enough money to pay our staff a living wage and earn enough of a profit to smooth over the rough patches and continue to improve our business. Could the two of you look into this idea, and get back to me in a week or so?"
Throughout the following week, the three communicated by e-mail. By the end of the week, a number of possibilities had surfaced, and these were summarized in a message from Bernadette to the others.
TO: [email protected], [email protected]
FROM: [email protected]
MESSAGE:
I've compiled the ideas from all of our e-mails into the following list. This may be a good starting point for our meeting tomorrow.
1. Buy an existing nursing home in one of Golden Care's current locations.
2. Buy an existing nursing home in another city.
3. Build a new nursing home facility in one of Golden Care's current locations.
4. Build a new nursing home facility in another city.
5. Build a wing on to an existing Golden Care facility. The Apache Junction facility has sufficient open land for an addition.
The next day, Sabrina, Peter, and Bernadette met again in Sabrina's office.
Sabrina : "I didn't realize there were so many possibilities. Are we going to have to work up numbers on each of them?"
Bernadette : "No, I think we can eliminate a few of them pretty quickly. For example, building a new facility would cost more than the other options, and it would involve the most risk."
Peter : "I agree, and I also think we might eliminate the purchase of an existing nursing home for the same reasons. Also, existing homes would not give us the option of building a facility that is state of the art and meets our needs, and it would lock us into a preexisting patient mix."
Sabrina : "I like that thinking. Let's restrict our attention to Option 5."
Bernadette : "I thought you might like that option, so Peter and I sketched out two alternatives for an extension of the Apache Junction building. We call the alternatives Basic Care and Lifestyle Care."
Peter : "There are different markets for each type of care. If we want to concentrate on Medicare and Medicaid patients, the reimbursement is lower, and we would want to offer the Basic Care option. Private insurance and private-pay patients could afford more services; if we are marketing to these patients, we could offer the Lifestyle Care option. Both alternatives provide high-quality nursing care. Basic Care concentrates on the quality nursing and maintenance activities. For example, the addition would have 25 double rooms, two nursing stations, two recreation rooms, a treatment room, and an office. The Lifestyle Care option adds physical and recreational therapy with a specially equipped gym and pool. That addition would have 30 single rooms, two nursing stations, a recreation room, a swimming pool, a hydrotherapy spa and gym, a treatment room, and an office. In each case, there would be cable TV and telephone hookups in each room and a buffer area between the nursing home and the apartments."
Sabrina : "Why the buffer area? Won't that add unnecessary cost?"
Peter : "It adds cost, but it will be well worth it. Sabrina, you must remember that the nursing home patients are different from the apartment residents. Some of the patients will have advanced dementia. We'll lose apartment residents in a hurry if they have to be reminded every day of what might be in store for them later on."
Sabrina : "I see your point. Bernadette, what will these two plans cost? I'll tell you right now that I like the Lifestyle Care option better. It fits with our history of doing whatever we can to make life better for our residents."
Bernadette : "I've checked into the costs of putting on a new wing and operating both alternatives. Here's a listing."
"In both cases, total administrative costs for Golden Care would increase by $30,000 per year. This seems high, but the increased legal and insurance requirements will add significantly more paperwork and accounting."
Sabrina : "All this sounds reasonable, but why is reimbursement such an important factor?"
Peter : "Well, if you admit Medicaid patients, the state will reimburse at most $30,000 per year. Private insurance policies will pay roughly $46,000 per year. We can charge up to about $65,000 for private patients, but this type of care is so expensive that many of these patients exhaust their funds and go on Medicaid. The nice aspect of Medicaid is that we can be virtually assured that we will operate at capacity."
Sabrina : "Can we cross that bridge when we come to it?"
Peter : " No, not really. Once the patient is a resident of our facility, it is hard to evict him or her. Also, while it is legal to force patients out before they go on Medicaid and to refuse to accept Medicaid patients, once we do accept Medicaid patients, we are prevented by law from evicting them-no matter how high our costs go."
Sabrina : "OK, it looks as if we have some hard work ahead of us to decide whether or not to get into this line of business."
Required
How did Sabrina, Bernadette, and Peter use the tactical decision-making model of Chapter 17?
Question
Beauville Furniture Corporation produces sofas, recliners, and lounge chairs. Beauville is located in a medium-sized community in the southeastern part of the United States. It is a major employer in the community. In fact, the economic well-being of the community is tied very strongly to Beauville. Beauville operates a sawmill, a fabric plant, and a furniture plant in the same community.
The sawmill buys logs from independent producers. The sawmill then processes the logs into four grades of lumber: firsts and seconds, No. 1 common, No. 2 common, and No. 3 common. All costs incurred in the mill are common to the four grades of lumber. All four grades of lumber are used by the furniture plant. The mill transfers everything it produces to the furniture plant, and the grades are transferred at cost. Trucks are used to move the lumber from the mill to the furniture plant. Although no outside sales exist, the mill could sell to external customers, and the selling prices of the four grades are known.
The fabric plant is responsible for producing the fabric that is used by the furniture plant. To produce three totally different fabrics (identified by fabric ID codes FB60, FB70, and FB80, respectively), the plant has three separate production operations-one for each fabric. Thus, production of all three fabrics occurs at the same time in different locations in the plant. Each fabric's production operation has two processes: the weaving and pattern process and the coloring and bolting process. In the weaving and pattern process, yarn is used to create yards of fabric with different designs. In the next process, the fabric is dyed, cut into 25-yard sections, and wrapped around cardboard rods to form 25-yard bolts. The bolts are transported by forklift to the furniture plant's Receiving Department. All of the output of the fabric plant is used by the furniture plant (to produce the sofas and chairs). For accounting purposes, the fabric is transferred at cost to the furniture plant.
The furniture plant produces orders for customers on a special-order basis. The customers specify the quantity, style, fabric, lumber grade, and pattern. Typically, jobs are large (involving at least 500 units). The plant has two production departments: Cutting and Assembly. In the Cutting Department, the fabric and wooden frame components are sized and cut. Other components are purchased from external suppliers and are removed from stores as needed for assembly. After the fabric and wooden components are finished for the entire job, they are moved to the Assembly Department. The Assembly Department takes the individual components and assembles the sofas (or chairs).
Beauville Furniture has been in business for over two decades and has a good reputation. However, during the past five years, Beauville experienced eroding profits and declining sales. Bids were increasingly lost (even aggressive bids) on the more popular models. Yet, the company was winning bids on some of the more-difficult-to-produce items. Lance Hays, the owner and manager, was frustrated. He simply couldn't understand how some of his competitors could sell for such low prices. On a common sofa job involving 500 units, Beauville's bids were running $25 per unit, or $12,500 per job more than the winning bids (on average). Yet, on the more difficult items, Beauville's bids were running about $60 per unit less than the next closest bid. Gisela Berling, vice president of finance, was assigned the task of preparing a cost analysis of the company's product lines. Lance wanted to know if the company's costs were excessive. Perhaps the company was being wasteful, and it was simply costing more to produce furniture than it was costing its competitors.
Gisela prepared herself by reading recent literature on cost management and product costing and attending several conferences that explored the same issues. She then reviewed the costing procedures of the company's mill and two plants and did a preliminary assessment of their soundness. The production costs of the mill were common to all lumber grades and were assigned using the physical units method. Since the output and production costs were fairly uniform throughout the year, the mill used an actual costing system. Although Gisela had no difficulty with actual costing, she decided to explore the effects of using the sales-value-at-split-off method. Thus, cost and production data for the mill were gathered so that an analysis could be conducted. The two plants used normal costing systems. The fabric plant used process costing, and the furniture plant used job-order costing. Both plants used plantwide overhead rates based on direct labor hours. Based on her initial reviews, she concluded that the costing procedures for the fabric plant were satisfactory. Essentially, there was no evidence of product diversity. A statistical analysis revealed that about 90 percent of the variability in the plant's overhead cost could be explained by direct labor hours. Thus, the use of a plantwide overhead rate based on direct labor hours seemed justified. What did concern her, though, was the material waste that she observed in the plant. Maybe a standard cost system would be useful for increasing the overall cost efficiency of the plant. Consequently, as part of her report to Lance, she decided to include a description of the fabric plant's costing procedures-at least for one of the fabric types. She also decided to develop a standard cost sheet for the chosen fabric. The furniture plant, however, was a more difficult matter. Product diversity was present and could be causing some distortions in product costs. Furthermore, statistical analysis revealed that only about 40 percent of the variability in overhead cost was explained by the direct labor hours. She decided that additional analysis was needed so that a sound product costing method could be recommended. One possibility would be to increase the number of overhead rates. Thus, she decided to include departmental data so that the effect of moving to departmental rates could be assessed. Finally, she also wanted to explore the possibility of converting the sawmill and fabric plant into profit centers and changing the existing transfer pricing policy.
With the cooperation of the cost accounting manager for the mill and each plant's controller, she gathered the following data for last year:
Sawmill:
Joint manufacturing costs: $900,000

Fabric Plant:
Budgeted overhead: $1,200,000 (50% fixed)
Practical volume (direct labor hours): 120,000 hours
Actual overhead: $1,150,000 (50% fixed)
Actual hours worked:

Departmental data on Fabric FB70 (actual costs and actual outcomes):

*Unitsare measured in yards for the Weaving and Pattern Department and in bolts forthe Coloring and Bolting Department. Note: With the exception of the cardboard bolt rods, materials are added at the beginning of each process. The cost of the rods is relatively insignificant and is included in overhead.
Proposed standard cost sheet for Fabric FB70 (for the Coloring and Bolting Department only):

Furniture Plant:
Departmental data (budgeted):

After some discussion with the furniture plant controller, Gisela decided to use machine hours to calculate the overhead rate for the Cutting Department and direct labor hours for the Assembly Department rate (the Cutting Department was more automated than the Assembly Department). As part of her report, she wanted to compare the effects of plantwide rates and departmental rates on the cost of jobs. She wanted to know if overhead costing could be the source of the pricing problems the company was experiencing.
To assess the effect of the different overhead assignment procedures, Gisela decided to examine two prospective jobs. One job, Job A500, could produce 500 sofas, using a frequently requested style and Fabric FB70. Bids on this type of job were being lost more frequently to competitors. The second job, Job B75, would produce 75 specially designed recliners. This job involved a new design and was more difficult for the workers to build. It involved some special cutting requirements and an unfamiliar assembly. Recently, the company seemed to be winning more bids on jobs of this type. To compute the costs of the two jobs, Gisela assembled the following information on the two jobs:
Job A500:

Job B75:

Required
Calculate the amount of under- or overapplied overhead for the fabric plant.
The sawmill buys logs from independent producers. The sawmill then processes the logs into four grades of lumber: firsts and seconds, No. 1 common, No. 2 common, and No. 3 common. All costs incurred in the mill are common to the four grades of lumber. All four grades of lumber are used by the furniture plant. The mill transfers everything it produces to the furniture plant, and the grades are transferred at cost. Trucks are used to move the lumber from the mill to the furniture plant. Although no outside sales exist, the mill could sell to external customers, and the selling prices of the four grades are known.
The fabric plant is responsible for producing the fabric that is used by the furniture plant. To produce three totally different fabrics (identified by fabric ID codes FB60, FB70, and FB80, respectively), the plant has three separate production operations-one for each fabric. Thus, production of all three fabrics occurs at the same time in different locations in the plant. Each fabric's production operation has two processes: the weaving and pattern process and the coloring and bolting process. In the weaving and pattern process, yarn is used to create yards of fabric with different designs. In the next process, the fabric is dyed, cut into 25-yard sections, and wrapped around cardboard rods to form 25-yard bolts. The bolts are transported by forklift to the furniture plant's Receiving Department. All of the output of the fabric plant is used by the furniture plant (to produce the sofas and chairs). For accounting purposes, the fabric is transferred at cost to the furniture plant.
The furniture plant produces orders for customers on a special-order basis. The customers specify the quantity, style, fabric, lumber grade, and pattern. Typically, jobs are large (involving at least 500 units). The plant has two production departments: Cutting and Assembly. In the Cutting Department, the fabric and wooden frame components are sized and cut. Other components are purchased from external suppliers and are removed from stores as needed for assembly. After the fabric and wooden components are finished for the entire job, they are moved to the Assembly Department. The Assembly Department takes the individual components and assembles the sofas (or chairs).
Beauville Furniture has been in business for over two decades and has a good reputation. However, during the past five years, Beauville experienced eroding profits and declining sales. Bids were increasingly lost (even aggressive bids) on the more popular models. Yet, the company was winning bids on some of the more-difficult-to-produce items. Lance Hays, the owner and manager, was frustrated. He simply couldn't understand how some of his competitors could sell for such low prices. On a common sofa job involving 500 units, Beauville's bids were running $25 per unit, or $12,500 per job more than the winning bids (on average). Yet, on the more difficult items, Beauville's bids were running about $60 per unit less than the next closest bid. Gisela Berling, vice president of finance, was assigned the task of preparing a cost analysis of the company's product lines. Lance wanted to know if the company's costs were excessive. Perhaps the company was being wasteful, and it was simply costing more to produce furniture than it was costing its competitors.
Gisela prepared herself by reading recent literature on cost management and product costing and attending several conferences that explored the same issues. She then reviewed the costing procedures of the company's mill and two plants and did a preliminary assessment of their soundness. The production costs of the mill were common to all lumber grades and were assigned using the physical units method. Since the output and production costs were fairly uniform throughout the year, the mill used an actual costing system. Although Gisela had no difficulty with actual costing, she decided to explore the effects of using the sales-value-at-split-off method. Thus, cost and production data for the mill were gathered so that an analysis could be conducted. The two plants used normal costing systems. The fabric plant used process costing, and the furniture plant used job-order costing. Both plants used plantwide overhead rates based on direct labor hours. Based on her initial reviews, she concluded that the costing procedures for the fabric plant were satisfactory. Essentially, there was no evidence of product diversity. A statistical analysis revealed that about 90 percent of the variability in the plant's overhead cost could be explained by direct labor hours. Thus, the use of a plantwide overhead rate based on direct labor hours seemed justified. What did concern her, though, was the material waste that she observed in the plant. Maybe a standard cost system would be useful for increasing the overall cost efficiency of the plant. Consequently, as part of her report to Lance, she decided to include a description of the fabric plant's costing procedures-at least for one of the fabric types. She also decided to develop a standard cost sheet for the chosen fabric. The furniture plant, however, was a more difficult matter. Product diversity was present and could be causing some distortions in product costs. Furthermore, statistical analysis revealed that only about 40 percent of the variability in overhead cost was explained by the direct labor hours. She decided that additional analysis was needed so that a sound product costing method could be recommended. One possibility would be to increase the number of overhead rates. Thus, she decided to include departmental data so that the effect of moving to departmental rates could be assessed. Finally, she also wanted to explore the possibility of converting the sawmill and fabric plant into profit centers and changing the existing transfer pricing policy.
With the cooperation of the cost accounting manager for the mill and each plant's controller, she gathered the following data for last year:
Sawmill:
Joint manufacturing costs: $900,000
Fabric Plant:
Budgeted overhead: $1,200,000 (50% fixed)
Practical volume (direct labor hours): 120,000 hours
Actual overhead: $1,150,000 (50% fixed)
Actual hours worked:
Departmental data on Fabric FB70 (actual costs and actual outcomes):
*Unitsare measured in yards for the Weaving and Pattern Department and in bolts forthe Coloring and Bolting Department. Note: With the exception of the cardboard bolt rods, materials are added at the beginning of each process. The cost of the rods is relatively insignificant and is included in overhead.
Proposed standard cost sheet for Fabric FB70 (for the Coloring and Bolting Department only):
Furniture Plant:
Departmental data (budgeted):
After some discussion with the furniture plant controller, Gisela decided to use machine hours to calculate the overhead rate for the Cutting Department and direct labor hours for the Assembly Department rate (the Cutting Department was more automated than the Assembly Department). As part of her report, she wanted to compare the effects of plantwide rates and departmental rates on the cost of jobs. She wanted to know if overhead costing could be the source of the pricing problems the company was experiencing.
To assess the effect of the different overhead assignment procedures, Gisela decided to examine two prospective jobs. One job, Job A500, could produce 500 sofas, using a frequently requested style and Fabric FB70. Bids on this type of job were being lost more frequently to competitors. The second job, Job B75, would produce 75 specially designed recliners. This job involved a new design and was more difficult for the workers to build. It involved some special cutting requirements and an unfamiliar assembly. Recently, the company seemed to be winning more bids on jobs of this type. To compute the costs of the two jobs, Gisela assembled the following information on the two jobs:
Job A500:
Job B75:
Required
Calculate the amount of under- or overapplied overhead for the fabric plant.
Question
Sabrina Hoffman is founder and CEO of Golden Care, Inc., which owns and operates several assisted- living facilities. The facilities are apartment-style buildings with 25 to 30 one- or two-bedroom apartments. While each apartment has its own complete kitchen, in every building Golden Care offers communal dining options and an on-site nurse who is available 24 hours a day. Residents can choose monthly meal options that include one or two meals per day in the dining room. Residents who require nursing services (e.g., blood pressure monitoring and injections) can receive those services from the nurse. However, Golden Care facilities are not nursing homes, all residents are ambulatory, and custodial care is not an option. In the five years it has been in operation, the company has expanded from one facility to five, located in southwestern cities. The income statement for last year follows.

Sabrina originally got into the business because she had trouble finding adequate facilities for her mother. The concept worked well, and income over the past five years had grown nicely at 20 percent per year. However, Sabrina sensed clouds on the horizon. She knew that the population was aging and that her current clients would be moving to more traditional forms of nursing care. As a result, Sabrina wanted to consider adding one or more nursing homes to Golden Care. These nursing homes would be staffed around the clock with RNs and LPNs. The residents would likely have more severe medical problems and would be confined to beds or wheelchairs. Sabrina knew that quality care of this type was needed. So, she contacted Peter Verdon, her marketing manager, and Bernadette Masters, her accountant, for a brainstorming session.
Peter : "Sabrina, I really like the concept. As you know, several of our facilities have faced seeing their long-term residents move out to local nursing homes. Not only are these homes of lower quality than what we could provide, but losing a resident is heartrending for the staff, as well as for the remaining residents. I like the idea of providing a transition from less care to more."
Bernadette : "I agree with you, Peter. But let's not forget the differences between assisted-living and full-time, nursing-home-type care. Our expenses will really increase."
Sabrina : "That's why I wanted to talk with both of you. As you know, Golden Care's mission statement emphasizes the need to make a profit. We can't continue to serve our residents and provide high- quality care if we don't make enough money to pay our staff a living wage and earn enough of a profit to smooth over the rough patches and continue to improve our business. Could the two of you look into this idea, and get back to me in a week or so?"
Throughout the following week, the three communicated by e-mail. By the end of the week, a number of possibilities had surfaced, and these were summarized in a message from Bernadette to the others.
TO: [email protected], [email protected]
FROM: [email protected]
MESSAGE:
I've compiled the ideas from all of our e-mails into the following list. This may be a good starting point for our meeting tomorrow.
1. Buy an existing nursing home in one of Golden Care's current locations.
2. Buy an existing nursing home in another city.
3. Build a new nursing home facility in one of Golden Care's current locations.
4. Build a new nursing home facility in another city.
5. Build a wing on to an existing Golden Care facility. The Apache Junction facility has sufficient open land for an addition.
The next day, Sabrina, Peter, and Bernadette met again in Sabrina's office.
Sabrina : "I didn't realize there were so many possibilities. Are we going to have to work up numbers on each of them?"
Bernadette : "No, I think we can eliminate a few of them pretty quickly. For example, building a new facility would cost more than the other options, and it would involve the most risk."
Peter : "I agree, and I also think we might eliminate the purchase of an existing nursing home for the same reasons. Also, existing homes would not give us the option of building a facility that is state of the art and meets our needs, and it would lock us into a preexisting patient mix."
Sabrina : "I like that thinking. Let's restrict our attention to Option 5."
Bernadette : "I thought you might like that option, so Peter and I sketched out two alternatives for an extension of the Apache Junction building. We call the alternatives Basic Care and Lifestyle Care."
Peter : "There are different markets for each type of care. If we want to concentrate on Medicare and Medicaid patients, the reimbursement is lower, and we would want to offer the Basic Care option. Private insurance and private-pay patients could afford more services; if we are marketing to these patients, we could offer the Lifestyle Care option. Both alternatives provide high-quality nursing care. Basic Care concentrates on the quality nursing and maintenance activities. For example, the addition would have 25 double rooms, two nursing stations, two recreation rooms, a treatment room, and an office. The Lifestyle Care option adds physical and recreational therapy with a specially equipped gym and pool. That addition would have 30 single rooms, two nursing stations, a recreation room, a swimming pool, a hydrotherapy spa and gym, a treatment room, and an office. In each case, there would be cable TV and telephone hookups in each room and a buffer area between the nursing home and the apartments."
Sabrina : "Why the buffer area? Won't that add unnecessary cost?"
Peter : "It adds cost, but it will be well worth it. Sabrina, you must remember that the nursing home patients are different from the apartment residents. Some of the patients will have advanced dementia. We'll lose apartment residents in a hurry if they have to be reminded every day of what might be in store for them later on."
Sabrina : "I see your point. Bernadette, what will these two plans cost? I'll tell you right now that I like the Lifestyle Care option better. It fits with our history of doing whatever we can to make life better for our residents."
Bernadette : "I've checked into the costs of putting on a new wing and operating both alternatives. Here's a listing."


"In both cases, total administrative costs for Golden Care would increase by $30,000 per year. This seems high, but the increased legal and insurance requirements will add significantly more paperwork and accounting."
Sabrina : "All this sounds reasonable, but why is reimbursement such an important factor?"
Peter : "Well, if you admit Medicaid patients, the state will reimburse at most $30,000 per year. Private insurance policies will pay roughly $46,000 per year. We can charge up to about $65,000 for private patients, but this type of care is so expensive that many of these patients exhaust their funds and go on Medicaid. The nice aspect of Medicaid is that we can be virtually assured that we will operate at capacity."
Sabrina : "Can we cross that bridge when we come to it?"
Peter : " No, not really. Once the patient is a resident of our facility, it is hard to evict him or her. Also, while it is legal to force patients out before they go on Medicaid and to refuse to accept Medicaid patients, once we do accept Medicaid patients, we are prevented by law from evicting them-no matter how high our costs go."
Sabrina : "OK, it looks as if we have some hard work ahead of us to decide whether or not to get into this line of business."
Required
Categorize each of the expenses for the Basic Care and Lifestyle Care options as flexible or committed. Further categorize the committed expenses as committed fixed or committed step costs.
Sabrina originally got into the business because she had trouble finding adequate facilities for her mother. The concept worked well, and income over the past five years had grown nicely at 20 percent per year. However, Sabrina sensed clouds on the horizon. She knew that the population was aging and that her current clients would be moving to more traditional forms of nursing care. As a result, Sabrina wanted to consider adding one or more nursing homes to Golden Care. These nursing homes would be staffed around the clock with RNs and LPNs. The residents would likely have more severe medical problems and would be confined to beds or wheelchairs. Sabrina knew that quality care of this type was needed. So, she contacted Peter Verdon, her marketing manager, and Bernadette Masters, her accountant, for a brainstorming session.
Peter : "Sabrina, I really like the concept. As you know, several of our facilities have faced seeing their long-term residents move out to local nursing homes. Not only are these homes of lower quality than what we could provide, but losing a resident is heartrending for the staff, as well as for the remaining residents. I like the idea of providing a transition from less care to more."
Bernadette : "I agree with you, Peter. But let's not forget the differences between assisted-living and full-time, nursing-home-type care. Our expenses will really increase."
Sabrina : "That's why I wanted to talk with both of you. As you know, Golden Care's mission statement emphasizes the need to make a profit. We can't continue to serve our residents and provide high- quality care if we don't make enough money to pay our staff a living wage and earn enough of a profit to smooth over the rough patches and continue to improve our business. Could the two of you look into this idea, and get back to me in a week or so?"
Throughout the following week, the three communicated by e-mail. By the end of the week, a number of possibilities had surfaced, and these were summarized in a message from Bernadette to the others.
TO: [email protected], [email protected]
FROM: [email protected]
MESSAGE:
I've compiled the ideas from all of our e-mails into the following list. This may be a good starting point for our meeting tomorrow.
1. Buy an existing nursing home in one of Golden Care's current locations.
2. Buy an existing nursing home in another city.
3. Build a new nursing home facility in one of Golden Care's current locations.
4. Build a new nursing home facility in another city.
5. Build a wing on to an existing Golden Care facility. The Apache Junction facility has sufficient open land for an addition.
The next day, Sabrina, Peter, and Bernadette met again in Sabrina's office.
Sabrina : "I didn't realize there were so many possibilities. Are we going to have to work up numbers on each of them?"
Bernadette : "No, I think we can eliminate a few of them pretty quickly. For example, building a new facility would cost more than the other options, and it would involve the most risk."
Peter : "I agree, and I also think we might eliminate the purchase of an existing nursing home for the same reasons. Also, existing homes would not give us the option of building a facility that is state of the art and meets our needs, and it would lock us into a preexisting patient mix."
Sabrina : "I like that thinking. Let's restrict our attention to Option 5."
Bernadette : "I thought you might like that option, so Peter and I sketched out two alternatives for an extension of the Apache Junction building. We call the alternatives Basic Care and Lifestyle Care."
Peter : "There are different markets for each type of care. If we want to concentrate on Medicare and Medicaid patients, the reimbursement is lower, and we would want to offer the Basic Care option. Private insurance and private-pay patients could afford more services; if we are marketing to these patients, we could offer the Lifestyle Care option. Both alternatives provide high-quality nursing care. Basic Care concentrates on the quality nursing and maintenance activities. For example, the addition would have 25 double rooms, two nursing stations, two recreation rooms, a treatment room, and an office. The Lifestyle Care option adds physical and recreational therapy with a specially equipped gym and pool. That addition would have 30 single rooms, two nursing stations, a recreation room, a swimming pool, a hydrotherapy spa and gym, a treatment room, and an office. In each case, there would be cable TV and telephone hookups in each room and a buffer area between the nursing home and the apartments."
Sabrina : "Why the buffer area? Won't that add unnecessary cost?"
Peter : "It adds cost, but it will be well worth it. Sabrina, you must remember that the nursing home patients are different from the apartment residents. Some of the patients will have advanced dementia. We'll lose apartment residents in a hurry if they have to be reminded every day of what might be in store for them later on."
Sabrina : "I see your point. Bernadette, what will these two plans cost? I'll tell you right now that I like the Lifestyle Care option better. It fits with our history of doing whatever we can to make life better for our residents."
Bernadette : "I've checked into the costs of putting on a new wing and operating both alternatives. Here's a listing."
"In both cases, total administrative costs for Golden Care would increase by $30,000 per year. This seems high, but the increased legal and insurance requirements will add significantly more paperwork and accounting."
Sabrina : "All this sounds reasonable, but why is reimbursement such an important factor?"
Peter : "Well, if you admit Medicaid patients, the state will reimburse at most $30,000 per year. Private insurance policies will pay roughly $46,000 per year. We can charge up to about $65,000 for private patients, but this type of care is so expensive that many of these patients exhaust their funds and go on Medicaid. The nice aspect of Medicaid is that we can be virtually assured that we will operate at capacity."
Sabrina : "Can we cross that bridge when we come to it?"
Peter : " No, not really. Once the patient is a resident of our facility, it is hard to evict him or her. Also, while it is legal to force patients out before they go on Medicaid and to refuse to accept Medicaid patients, once we do accept Medicaid patients, we are prevented by law from evicting them-no matter how high our costs go."
Sabrina : "OK, it looks as if we have some hard work ahead of us to decide whether or not to get into this line of business."
Required
Categorize each of the expenses for the Basic Care and Lifestyle Care options as flexible or committed. Further categorize the committed expenses as committed fixed or committed step costs.
Question
Beauville Furniture Corporation produces sofas, recliners, and lounge chairs. Beauville is located in a medium-sized community in the southeastern part of the United States. It is a major employer in the community. In fact, the economic well-being of the community is tied very strongly to Beauville. Beauville operates a sawmill, a fabric plant, and a furniture plant in the same community.
The sawmill buys logs from independent producers. The sawmill then processes the logs into four grades of lumber: firsts and seconds, No. 1 common, No. 2 common, and No. 3 common. All costs incurred in the mill are common to the four grades of lumber. All four grades of lumber are used by the furniture plant. The mill transfers everything it produces to the furniture plant, and the grades are transferred at cost. Trucks are used to move the lumber from the mill to the furniture plant. Although no outside sales exist, the mill could sell to external customers, and the selling prices of the four grades are known.
The fabric plant is responsible for producing the fabric that is used by the furniture plant. To produce three totally different fabrics (identified by fabric ID codes FB60, FB70, and FB80, respectively), the plant has three separate production operations-one for each fabric. Thus, production of all three fabrics occurs at the same time in different locations in the plant. Each fabric's production operation has two processes: the weaving and pattern process and the coloring and bolting process. In the weaving and pattern process, yarn is used to create yards of fabric with different designs. In the next process, the fabric is dyed, cut into 25-yard sections, and wrapped around cardboard rods to form 25-yard bolts. The bolts are transported by forklift to the furniture plant's Receiving Department. All of the output of the fabric plant is used by the furniture plant (to produce the sofas and chairs). For accounting purposes, the fabric is transferred at cost to the furniture plant.
The furniture plant produces orders for customers on a special-order basis. The customers specify the quantity, style, fabric, lumber grade, and pattern. Typically, jobs are large (involving at least 500 units). The plant has two production departments: Cutting and Assembly. In the Cutting Department, the fabric and wooden frame components are sized and cut. Other components are purchased from external suppliers and are removed from stores as needed for assembly. After the fabric and wooden components are finished for the entire job, they are moved to the Assembly Department. The Assembly Department takes the individual components and assembles the sofas (or chairs).
Beauville Furniture has been in business for over two decades and has a good reputation. However, during the past five years, Beauville experienced eroding profits and declining sales. Bids were increasingly lost (even aggressive bids) on the more popular models. Yet, the company was winning bids on some of the more-difficult-to-produce items. Lance Hays, the owner and manager, was frustrated. He simply couldn't understand how some of his competitors could sell for such low prices. On a common sofa job involving 500 units, Beauville's bids were running $25 per unit, or $12,500 per job more than the winning bids (on average). Yet, on the more difficult items, Beauville's bids were running about $60 per unit less than the next closest bid. Gisela Berling, vice president of finance, was assigned the task of preparing a cost analysis of the company's product lines. Lance wanted to know if the company's costs were excessive. Perhaps the company was being wasteful, and it was simply costing more to produce furniture than it was costing its competitors.
Gisela prepared herself by reading recent literature on cost management and product costing and attending several conferences that explored the same issues. She then reviewed the costing procedures of the company's mill and two plants and did a preliminary assessment of their soundness. The production costs of the mill were common to all lumber grades and were assigned using the physical units method. Since the output and production costs were fairly uniform throughout the year, the mill used an actual costing system. Although Gisela had no difficulty with actual costing, she decided to explore the effects of using the sales-value-at-split-off method. Thus, cost and production data for the mill were gathered so that an analysis could be conducted. The two plants used normal costing systems. The fabric plant used process costing, and the furniture plant used job-order costing. Both plants used plantwide overhead rates based on direct labor hours. Based on her initial reviews, she concluded that the costing procedures for the fabric plant were satisfactory. Essentially, there was no evidence of product diversity. A statistical analysis revealed that about 90 percent of the variability in the plant's overhead cost could be explained by direct labor hours. Thus, the use of a plantwide overhead rate based on direct labor hours seemed justified. What did concern her, though, was the material waste that she observed in the plant. Maybe a standard cost system would be useful for increasing the overall cost efficiency of the plant. Consequently, as part of her report to Lance, she decided to include a description of the fabric plant's costing procedures-at least for one of the fabric types. She also decided to develop a standard cost sheet for the chosen fabric. The furniture plant, however, was a more difficult matter. Product diversity was present and could be causing some distortions in product costs. Furthermore, statistical analysis revealed that only about 40 percent of the variability in overhead cost was explained by the direct labor hours. She decided that additional analysis was needed so that a sound product costing method could be recommended. One possibility would be to increase the number of overhead rates. Thus, she decided to include departmental data so that the effect of moving to departmental rates could be assessed. Finally, she also wanted to explore the possibility of converting the sawmill and fabric plant into profit centers and changing the existing transfer pricing policy.
With the cooperation of the cost accounting manager for the mill and each plant's controller, she gathered the following data for last year:
Sawmill:
Joint manufacturing costs: $900,000

Fabric Plant:
Budgeted overhead: $1,200,000 (50% fixed)
Practical volume (direct labor hours): 120,000 hours
Actual overhead: $1,150,000 (50% fixed)
Actual hours worked:

Departmental data on Fabric FB70 (actual costs and actual outcomes):
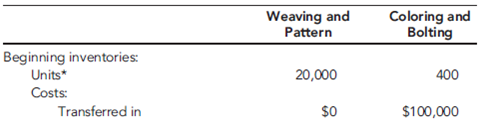

*Unitsare measured in yards for the Weaving and Pattern Department and in bolts forthe Coloring and Bolting Department. Note: With the exception of the cardboard bolt rods, materials are added at the beginning of each process. The cost of the rods is relatively insignificant and is included in overhead.
Proposed standard cost sheet for Fabric FB70 (for the Coloring and Bolting Department only):
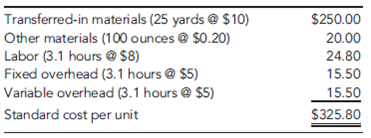
Furniture Plant:
Departmental data (budgeted):

After some discussion with the furniture plant controller, Gisela decided to use machine hours to calculate the overhead rate for the Cutting Department and direct labor hours for the Assembly Department rate (the Cutting Department was more automated than the Assembly Department). As part of her report, she wanted to compare the effects of plantwide rates and departmental rates on the cost of jobs. She wanted to know if overhead costing could be the source of the pricing problems the company was experiencing.
To assess the effect of the different overhead assignment procedures, Gisela decided to examine two prospective jobs. One job, Job A500, could produce 500 sofas, using a frequently requested style and Fabric FB70. Bids on this type of job were being lost more frequently to competitors. The second job, Job B75, would produce 75 specially designed recliners. This job involved a new design and was more difficult for the workers to build. It involved some special cutting requirements and an unfamiliar assembly. Recently, the company seemed to be winning more bids on jobs of this type. To compute the costs of the two jobs, Gisela assembled the following information on the two jobs:
Job A500:

Job B75:

Required
Using the weighted average method, calculate the cost per bolt for Fabric FB70.
The sawmill buys logs from independent producers. The sawmill then processes the logs into four grades of lumber: firsts and seconds, No. 1 common, No. 2 common, and No. 3 common. All costs incurred in the mill are common to the four grades of lumber. All four grades of lumber are used by the furniture plant. The mill transfers everything it produces to the furniture plant, and the grades are transferred at cost. Trucks are used to move the lumber from the mill to the furniture plant. Although no outside sales exist, the mill could sell to external customers, and the selling prices of the four grades are known.
The fabric plant is responsible for producing the fabric that is used by the furniture plant. To produce three totally different fabrics (identified by fabric ID codes FB60, FB70, and FB80, respectively), the plant has three separate production operations-one for each fabric. Thus, production of all three fabrics occurs at the same time in different locations in the plant. Each fabric's production operation has two processes: the weaving and pattern process and the coloring and bolting process. In the weaving and pattern process, yarn is used to create yards of fabric with different designs. In the next process, the fabric is dyed, cut into 25-yard sections, and wrapped around cardboard rods to form 25-yard bolts. The bolts are transported by forklift to the furniture plant's Receiving Department. All of the output of the fabric plant is used by the furniture plant (to produce the sofas and chairs). For accounting purposes, the fabric is transferred at cost to the furniture plant.
The furniture plant produces orders for customers on a special-order basis. The customers specify the quantity, style, fabric, lumber grade, and pattern. Typically, jobs are large (involving at least 500 units). The plant has two production departments: Cutting and Assembly. In the Cutting Department, the fabric and wooden frame components are sized and cut. Other components are purchased from external suppliers and are removed from stores as needed for assembly. After the fabric and wooden components are finished for the entire job, they are moved to the Assembly Department. The Assembly Department takes the individual components and assembles the sofas (or chairs).
Beauville Furniture has been in business for over two decades and has a good reputation. However, during the past five years, Beauville experienced eroding profits and declining sales. Bids were increasingly lost (even aggressive bids) on the more popular models. Yet, the company was winning bids on some of the more-difficult-to-produce items. Lance Hays, the owner and manager, was frustrated. He simply couldn't understand how some of his competitors could sell for such low prices. On a common sofa job involving 500 units, Beauville's bids were running $25 per unit, or $12,500 per job more than the winning bids (on average). Yet, on the more difficult items, Beauville's bids were running about $60 per unit less than the next closest bid. Gisela Berling, vice president of finance, was assigned the task of preparing a cost analysis of the company's product lines. Lance wanted to know if the company's costs were excessive. Perhaps the company was being wasteful, and it was simply costing more to produce furniture than it was costing its competitors.
Gisela prepared herself by reading recent literature on cost management and product costing and attending several conferences that explored the same issues. She then reviewed the costing procedures of the company's mill and two plants and did a preliminary assessment of their soundness. The production costs of the mill were common to all lumber grades and were assigned using the physical units method. Since the output and production costs were fairly uniform throughout the year, the mill used an actual costing system. Although Gisela had no difficulty with actual costing, she decided to explore the effects of using the sales-value-at-split-off method. Thus, cost and production data for the mill were gathered so that an analysis could be conducted. The two plants used normal costing systems. The fabric plant used process costing, and the furniture plant used job-order costing. Both plants used plantwide overhead rates based on direct labor hours. Based on her initial reviews, she concluded that the costing procedures for the fabric plant were satisfactory. Essentially, there was no evidence of product diversity. A statistical analysis revealed that about 90 percent of the variability in the plant's overhead cost could be explained by direct labor hours. Thus, the use of a plantwide overhead rate based on direct labor hours seemed justified. What did concern her, though, was the material waste that she observed in the plant. Maybe a standard cost system would be useful for increasing the overall cost efficiency of the plant. Consequently, as part of her report to Lance, she decided to include a description of the fabric plant's costing procedures-at least for one of the fabric types. She also decided to develop a standard cost sheet for the chosen fabric. The furniture plant, however, was a more difficult matter. Product diversity was present and could be causing some distortions in product costs. Furthermore, statistical analysis revealed that only about 40 percent of the variability in overhead cost was explained by the direct labor hours. She decided that additional analysis was needed so that a sound product costing method could be recommended. One possibility would be to increase the number of overhead rates. Thus, she decided to include departmental data so that the effect of moving to departmental rates could be assessed. Finally, she also wanted to explore the possibility of converting the sawmill and fabric plant into profit centers and changing the existing transfer pricing policy.
With the cooperation of the cost accounting manager for the mill and each plant's controller, she gathered the following data for last year:
Sawmill:
Joint manufacturing costs: $900,000
Fabric Plant:
Budgeted overhead: $1,200,000 (50% fixed)
Practical volume (direct labor hours): 120,000 hours
Actual overhead: $1,150,000 (50% fixed)
Actual hours worked:
Departmental data on Fabric FB70 (actual costs and actual outcomes):
*Unitsare measured in yards for the Weaving and Pattern Department and in bolts forthe Coloring and Bolting Department. Note: With the exception of the cardboard bolt rods, materials are added at the beginning of each process. The cost of the rods is relatively insignificant and is included in overhead.
Proposed standard cost sheet for Fabric FB70 (for the Coloring and Bolting Department only):
Furniture Plant:
Departmental data (budgeted):
After some discussion with the furniture plant controller, Gisela decided to use machine hours to calculate the overhead rate for the Cutting Department and direct labor hours for the Assembly Department rate (the Cutting Department was more automated than the Assembly Department). As part of her report, she wanted to compare the effects of plantwide rates and departmental rates on the cost of jobs. She wanted to know if overhead costing could be the source of the pricing problems the company was experiencing.
To assess the effect of the different overhead assignment procedures, Gisela decided to examine two prospective jobs. One job, Job A500, could produce 500 sofas, using a frequently requested style and Fabric FB70. Bids on this type of job were being lost more frequently to competitors. The second job, Job B75, would produce 75 specially designed recliners. This job involved a new design and was more difficult for the workers to build. It involved some special cutting requirements and an unfamiliar assembly. Recently, the company seemed to be winning more bids on jobs of this type. To compute the costs of the two jobs, Gisela assembled the following information on the two jobs:
Job A500:
Job B75:
Required
Using the weighted average method, calculate the cost per bolt for Fabric FB70.
Question
Sabrina Hoffman is founder and CEO of Golden Care, Inc., which owns and operates several assisted- living facilities. The facilities are apartment-style buildings with 25 to 30 one- or two-bedroom apartments. While each apartment has its own complete kitchen, in every building Golden Care offers communal dining options and an on-site nurse who is available 24 hours a day. Residents can choose monthly meal options that include one or two meals per day in the dining room. Residents who require nursing services (e.g., blood pressure monitoring and injections) can receive those services from the nurse. However, Golden Care facilities are not nursing homes, all residents are ambulatory, and custodial care is not an option. In the five years it has been in operation, the company has expanded from one facility to five, located in southwestern cities. The income statement for last year follows.

Sabrina originally got into the business because she had trouble finding adequate facilities for her mother. The concept worked well, and income over the past five years had grown nicely at 20 percent per year. However, Sabrina sensed clouds on the horizon. She knew that the population was aging and that her current clients would be moving to more traditional forms of nursing care. As a result, Sabrina wanted to consider adding one or more nursing homes to Golden Care. These nursing homes would be staffed around the clock with RNs and LPNs. The residents would likely have more severe medical problems and would be confined to beds or wheelchairs. Sabrina knew that quality care of this type was needed. So, she contacted Peter Verdon, her marketing manager, and Bernadette Masters, her accountant, for a brainstorming session.
Peter : "Sabrina, I really like the concept. As you know, several of our facilities have faced seeing their long-term residents move out to local nursing homes. Not only are these homes of lower quality than what we could provide, but losing a resident is heartrending for the staff, as well as for the remaining residents. I like the idea of providing a transition from less care to more."
Bernadette : "I agree with you, Peter. But let's not forget the differences between assisted-living and full-time, nursing-home-type care. Our expenses will really increase."
Sabrina : "That's why I wanted to talk with both of you. As you know, Golden Care's mission statement emphasizes the need to make a profit. We can't continue to serve our residents and provide high- quality care if we don't make enough money to pay our staff a living wage and earn enough of a profit to smooth over the rough patches and continue to improve our business. Could the two of you look into this idea, and get back to me in a week or so?"
Throughout the following week, the three communicated by e-mail. By the end of the week, a number of possibilities had surfaced, and these were summarized in a message from Bernadette to the others.
TO: [email protected], [email protected]
FROM: [email protected]
MESSAGE:
I've compiled the ideas from all of our e-mails into the following list. This may be a good starting point for our meeting tomorrow.
1. Buy an existing nursing home in one of Golden Care's current locations.
2. Buy an existing nursing home in another city.
3. Build a new nursing home facility in one of Golden Care's current locations.
4. Build a new nursing home facility in another city.
5. Build a wing on to an existing Golden Care facility. The Apache Junction facility has sufficient open land for an addition.
The next day, Sabrina, Peter, and Bernadette met again in Sabrina's office.
Sabrina : "I didn't realize there were so many possibilities. Are we going to have to work up numbers on each of them?"
Bernadette : "No, I think we can eliminate a few of them pretty quickly. For example, building a new facility would cost more than the other options, and it would involve the most risk."
Peter : "I agree, and I also think we might eliminate the purchase of an existing nursing home for the same reasons. Also, existing homes would not give us the option of building a facility that is state of the art and meets our needs, and it would lock us into a preexisting patient mix."
Sabrina : "I like that thinking. Let's restrict our attention to Option 5."
Bernadette : "I thought you might like that option, so Peter and I sketched out two alternatives for an extension of the Apache Junction building. We call the alternatives Basic Care and Lifestyle Care."
Peter : "There are different markets for each type of care. If we want to concentrate on Medicare and Medicaid patients, the reimbursement is lower, and we would want to offer the Basic Care option. Private insurance and private-pay patients could afford more services; if we are marketing to these patients, we could offer the Lifestyle Care option. Both alternatives provide high-quality nursing care. Basic Care concentrates on the quality nursing and maintenance activities. For example, the addition would have 25 double rooms, two nursing stations, two recreation rooms, a treatment room, and an office. The Lifestyle Care option adds physical and recreational therapy with a specially equipped gym and pool. That addition would have 30 single rooms, two nursing stations, a recreation room, a swimming pool, a hydrotherapy spa and gym, a treatment room, and an office. In each case, there would be cable TV and telephone hookups in each room and a buffer area between the nursing home and the apartments."
Sabrina : "Why the buffer area? Won't that add unnecessary cost?"
Peter : "It adds cost, but it will be well worth it. Sabrina, you must remember that the nursing home patients are different from the apartment residents. Some of the patients will have advanced dementia. We'll lose apartment residents in a hurry if they have to be reminded every day of what might be in store for them later on."
Sabrina : "I see your point. Bernadette, what will these two plans cost? I'll tell you right now that I like the Lifestyle Care option better. It fits with our history of doing whatever we can to make life better for our residents."
Bernadette : "I've checked into the costs of putting on a new wing and operating both alternatives. Here's a listing."
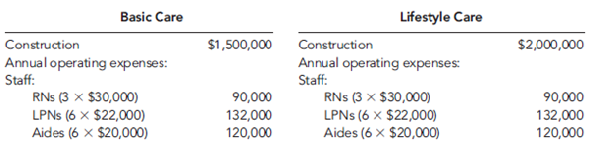

"In both cases, total administrative costs for Golden Care would increase by $30,000 per year. This seems high, but the increased legal and insurance requirements will add significantly more paperwork and accounting."
Sabrina : "All this sounds reasonable, but why is reimbursement such an important factor?"
Peter : "Well, if you admit Medicaid patients, the state will reimburse at most $30,000 per year. Private insurance policies will pay roughly $46,000 per year. We can charge up to about $65,000 for private patients, but this type of care is so expensive that many of these patients exhaust their funds and go on Medicaid. The nice aspect of Medicaid is that we can be virtually assured that we will operate at capacity."
Sabrina : "Can we cross that bridge when we come to it?"
Peter : " No, not really. Once the patient is a resident of our facility, it is hard to evict him or her. Also, while it is legal to force patients out before they go on Medicaid and to refuse to accept Medicaid patients, once we do accept Medicaid patients, we are prevented by law from evicting them-no matter how high our costs go."
Sabrina : "OK, it looks as if we have some hard work ahead of us to decide whether or not to get into this line of business."
Required
Calculate the break-even number of patients (in total and for each type of reimbursement) for each of the following scenarios:
a. Basic Care option, 20 percent private insurance, and 80 percent Medicaid
b. Basic Care option, no Medicaid
c. Lifestyle Care option, no Medicaid, 75 percent private insurance, and 25 percent private pay
d. Lifestyle Care option, all insurance reimbursement
Sabrina originally got into the business because she had trouble finding adequate facilities for her mother. The concept worked well, and income over the past five years had grown nicely at 20 percent per year. However, Sabrina sensed clouds on the horizon. She knew that the population was aging and that her current clients would be moving to more traditional forms of nursing care. As a result, Sabrina wanted to consider adding one or more nursing homes to Golden Care. These nursing homes would be staffed around the clock with RNs and LPNs. The residents would likely have more severe medical problems and would be confined to beds or wheelchairs. Sabrina knew that quality care of this type was needed. So, she contacted Peter Verdon, her marketing manager, and Bernadette Masters, her accountant, for a brainstorming session.
Peter : "Sabrina, I really like the concept. As you know, several of our facilities have faced seeing their long-term residents move out to local nursing homes. Not only are these homes of lower quality than what we could provide, but losing a resident is heartrending for the staff, as well as for the remaining residents. I like the idea of providing a transition from less care to more."
Bernadette : "I agree with you, Peter. But let's not forget the differences between assisted-living and full-time, nursing-home-type care. Our expenses will really increase."
Sabrina : "That's why I wanted to talk with both of you. As you know, Golden Care's mission statement emphasizes the need to make a profit. We can't continue to serve our residents and provide high- quality care if we don't make enough money to pay our staff a living wage and earn enough of a profit to smooth over the rough patches and continue to improve our business. Could the two of you look into this idea, and get back to me in a week or so?"
Throughout the following week, the three communicated by e-mail. By the end of the week, a number of possibilities had surfaced, and these were summarized in a message from Bernadette to the others.
TO: [email protected], [email protected]
FROM: [email protected]
MESSAGE:
I've compiled the ideas from all of our e-mails into the following list. This may be a good starting point for our meeting tomorrow.
1. Buy an existing nursing home in one of Golden Care's current locations.
2. Buy an existing nursing home in another city.
3. Build a new nursing home facility in one of Golden Care's current locations.
4. Build a new nursing home facility in another city.
5. Build a wing on to an existing Golden Care facility. The Apache Junction facility has sufficient open land for an addition.
The next day, Sabrina, Peter, and Bernadette met again in Sabrina's office.
Sabrina : "I didn't realize there were so many possibilities. Are we going to have to work up numbers on each of them?"
Bernadette : "No, I think we can eliminate a few of them pretty quickly. For example, building a new facility would cost more than the other options, and it would involve the most risk."
Peter : "I agree, and I also think we might eliminate the purchase of an existing nursing home for the same reasons. Also, existing homes would not give us the option of building a facility that is state of the art and meets our needs, and it would lock us into a preexisting patient mix."
Sabrina : "I like that thinking. Let's restrict our attention to Option 5."
Bernadette : "I thought you might like that option, so Peter and I sketched out two alternatives for an extension of the Apache Junction building. We call the alternatives Basic Care and Lifestyle Care."
Peter : "There are different markets for each type of care. If we want to concentrate on Medicare and Medicaid patients, the reimbursement is lower, and we would want to offer the Basic Care option. Private insurance and private-pay patients could afford more services; if we are marketing to these patients, we could offer the Lifestyle Care option. Both alternatives provide high-quality nursing care. Basic Care concentrates on the quality nursing and maintenance activities. For example, the addition would have 25 double rooms, two nursing stations, two recreation rooms, a treatment room, and an office. The Lifestyle Care option adds physical and recreational therapy with a specially equipped gym and pool. That addition would have 30 single rooms, two nursing stations, a recreation room, a swimming pool, a hydrotherapy spa and gym, a treatment room, and an office. In each case, there would be cable TV and telephone hookups in each room and a buffer area between the nursing home and the apartments."
Sabrina : "Why the buffer area? Won't that add unnecessary cost?"
Peter : "It adds cost, but it will be well worth it. Sabrina, you must remember that the nursing home patients are different from the apartment residents. Some of the patients will have advanced dementia. We'll lose apartment residents in a hurry if they have to be reminded every day of what might be in store for them later on."
Sabrina : "I see your point. Bernadette, what will these two plans cost? I'll tell you right now that I like the Lifestyle Care option better. It fits with our history of doing whatever we can to make life better for our residents."
Bernadette : "I've checked into the costs of putting on a new wing and operating both alternatives. Here's a listing."
"In both cases, total administrative costs for Golden Care would increase by $30,000 per year. This seems high, but the increased legal and insurance requirements will add significantly more paperwork and accounting."
Sabrina : "All this sounds reasonable, but why is reimbursement such an important factor?"
Peter : "Well, if you admit Medicaid patients, the state will reimburse at most $30,000 per year. Private insurance policies will pay roughly $46,000 per year. We can charge up to about $65,000 for private patients, but this type of care is so expensive that many of these patients exhaust their funds and go on Medicaid. The nice aspect of Medicaid is that we can be virtually assured that we will operate at capacity."
Sabrina : "Can we cross that bridge when we come to it?"
Peter : " No, not really. Once the patient is a resident of our facility, it is hard to evict him or her. Also, while it is legal to force patients out before they go on Medicaid and to refuse to accept Medicaid patients, once we do accept Medicaid patients, we are prevented by law from evicting them-no matter how high our costs go."
Sabrina : "OK, it looks as if we have some hard work ahead of us to decide whether or not to get into this line of business."
Required
Calculate the break-even number of patients (in total and for each type of reimbursement) for each of the following scenarios:
a. Basic Care option, 20 percent private insurance, and 80 percent Medicaid
b. Basic Care option, no Medicaid
c. Lifestyle Care option, no Medicaid, 75 percent private insurance, and 25 percent private pay
d. Lifestyle Care option, all insurance reimbursement
Question
Beauville Furniture Corporation produces sofas, recliners, and lounge chairs. Beauville is located in a medium-sized community in the southeastern part of the United States. It is a major employer in the community. In fact, the economic well-being of the community is tied very strongly to Beauville. Beauville operates a sawmill, a fabric plant, and a furniture plant in the same community.
The sawmill buys logs from independent producers. The sawmill then processes the logs into four grades of lumber: firsts and seconds, No. 1 common, No. 2 common, and No. 3 common. All costs incurred in the mill are common to the four grades of lumber. All four grades of lumber are used by the furniture plant. The mill transfers everything it produces to the furniture plant, and the grades are transferred at cost. Trucks are used to move the lumber from the mill to the furniture plant. Although no outside sales exist, the mill could sell to external customers, and the selling prices of the four grades are known.
The fabric plant is responsible for producing the fabric that is used by the furniture plant. To produce three totally different fabrics (identified by fabric ID codes FB60, FB70, and FB80, respectively), the plant has three separate production operations-one for each fabric. Thus, production of all three fabrics occurs at the same time in different locations in the plant. Each fabric's production operation has two processes: the weaving and pattern process and the coloring and bolting process. In the weaving and pattern process, yarn is used to create yards of fabric with different designs. In the next process, the fabric is dyed, cut into 25-yard sections, and wrapped around cardboard rods to form 25-yard bolts. The bolts are transported by forklift to the furniture plant's Receiving Department. All of the output of the fabric plant is used by the furniture plant (to produce the sofas and chairs). For accounting purposes, the fabric is transferred at cost to the furniture plant.
The furniture plant produces orders for customers on a special-order basis. The customers specify the quantity, style, fabric, lumber grade, and pattern. Typically, jobs are large (involving at least 500 units). The plant has two production departments: Cutting and Assembly. In the Cutting Department, the fabric and wooden frame components are sized and cut. Other components are purchased from external suppliers and are removed from stores as needed for assembly. After the fabric and wooden components are finished for the entire job, they are moved to the Assembly Department. The Assembly Department takes the individual components and assembles the sofas (or chairs).
Beauville Furniture has been in business for over two decades and has a good reputation. However, during the past five years, Beauville experienced eroding profits and declining sales. Bids were increasingly lost (even aggressive bids) on the more popular models. Yet, the company was winning bids on some of the more-difficult-to-produce items. Lance Hays, the owner and manager, was frustrated. He simply couldn't understand how some of his competitors could sell for such low prices. On a common sofa job involving 500 units, Beauville's bids were running $25 per unit, or $12,500 per job more than the winning bids (on average). Yet, on the more difficult items, Beauville's bids were running about $60 per unit less than the next closest bid. Gisela Berling, vice president of finance, was assigned the task of preparing a cost analysis of the company's product lines. Lance wanted to know if the company's costs were excessive. Perhaps the company was being wasteful, and it was simply costing more to produce furniture than it was costing its competitors.
Gisela prepared herself by reading recent literature on cost management and product costing and attending several conferences that explored the same issues. She then reviewed the costing procedures of the company's mill and two plants and did a preliminary assessment of their soundness. The production costs of the mill were common to all lumber grades and were assigned using the physical units method. Since the output and production costs were fairly uniform throughout the year, the mill used an actual costing system. Although Gisela had no difficulty with actual costing, she decided to explore the effects of using the sales-value-at-split-off method. Thus, cost and production data for the mill were gathered so that an analysis could be conducted. The two plants used normal costing systems. The fabric plant used process costing, and the furniture plant used job-order costing. Both plants used plantwide overhead rates based on direct labor hours. Based on her initial reviews, she concluded that the costing procedures for the fabric plant were satisfactory. Essentially, there was no evidence of product diversity. A statistical analysis revealed that about 90 percent of the variability in the plant's overhead cost could be explained by direct labor hours. Thus, the use of a plantwide overhead rate based on direct labor hours seemed justified. What did concern her, though, was the material waste that she observed in the plant. Maybe a standard cost system would be useful for increasing the overall cost efficiency of the plant. Consequently, as part of her report to Lance, she decided to include a description of the fabric plant's costing procedures-at least for one of the fabric types. She also decided to develop a standard cost sheet for the chosen fabric. The furniture plant, however, was a more difficult matter. Product diversity was present and could be causing some distortions in product costs. Furthermore, statistical analysis revealed that only about 40 percent of the variability in overhead cost was explained by the direct labor hours. She decided that additional analysis was needed so that a sound product costing method could be recommended. One possibility would be to increase the number of overhead rates. Thus, she decided to include departmental data so that the effect of moving to departmental rates could be assessed. Finally, she also wanted to explore the possibility of converting the sawmill and fabric plant into profit centers and changing the existing transfer pricing policy.
With the cooperation of the cost accounting manager for the mill and each plant's controller, she gathered the following data for last year:
Sawmill:
Joint manufacturing costs: $900,000

Fabric Plant:
Budgeted overhead: $1,200,000 (50% fixed)
Practical volume (direct labor hours): 120,000 hours
Actual overhead: $1,150,000 (50% fixed)
Actual hours worked:

Departmental data on Fabric FB70 (actual costs and actual outcomes):


*Unitsare measured in yards for the Weaving and Pattern Department and in bolts forthe Coloring and Bolting Department. Note: With the exception of the cardboard bolt rods, materials are added at the beginning of each process. The cost of the rods is relatively insignificant and is included in overhead.
Proposed standard cost sheet for Fabric FB70 (for the Coloring and Bolting Department only):

Furniture Plant:
Departmental data (budgeted):

After some discussion with the furniture plant controller, Gisela decided to use machine hours to calculate the overhead rate for the Cutting Department and direct labor hours for the Assembly Department rate (the Cutting Department was more automated than the Assembly Department). As part of her report, she wanted to compare the effects of plantwide rates and departmental rates on the cost of jobs. She wanted to know if overhead costing could be the source of the pricing problems the company was experiencing.
To assess the effect of the different overhead assignment procedures, Gisela decided to examine two prospective jobs. One job, Job A500, could produce 500 sofas, using a frequently requested style and Fabric FB70. Bids on this type of job were being lost more frequently to competitors. The second job, Job B75, would produce 75 specially designed recliners. This job involved a new design and was more difficult for the workers to build. It involved some special cutting requirements and an unfamiliar assembly. Recently, the company seemed to be winning more bids on jobs of this type. To compute the costs of the two jobs, Gisela assembled the following information on the two jobs:
Job A500:
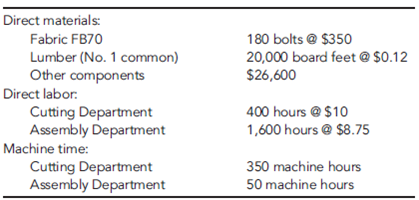
Job B75:

Required
Assume that the weaving and pattern process is not a separate process for each fabric. Also, assume that the yarn used for each fabric differs significantly in cost. In this case, would process costing be appropriate for the weaving and pattern process? What costing approach would you recommend? Describe your approach in detail.
The sawmill buys logs from independent producers. The sawmill then processes the logs into four grades of lumber: firsts and seconds, No. 1 common, No. 2 common, and No. 3 common. All costs incurred in the mill are common to the four grades of lumber. All four grades of lumber are used by the furniture plant. The mill transfers everything it produces to the furniture plant, and the grades are transferred at cost. Trucks are used to move the lumber from the mill to the furniture plant. Although no outside sales exist, the mill could sell to external customers, and the selling prices of the four grades are known.
The fabric plant is responsible for producing the fabric that is used by the furniture plant. To produce three totally different fabrics (identified by fabric ID codes FB60, FB70, and FB80, respectively), the plant has three separate production operations-one for each fabric. Thus, production of all three fabrics occurs at the same time in different locations in the plant. Each fabric's production operation has two processes: the weaving and pattern process and the coloring and bolting process. In the weaving and pattern process, yarn is used to create yards of fabric with different designs. In the next process, the fabric is dyed, cut into 25-yard sections, and wrapped around cardboard rods to form 25-yard bolts. The bolts are transported by forklift to the furniture plant's Receiving Department. All of the output of the fabric plant is used by the furniture plant (to produce the sofas and chairs). For accounting purposes, the fabric is transferred at cost to the furniture plant.
The furniture plant produces orders for customers on a special-order basis. The customers specify the quantity, style, fabric, lumber grade, and pattern. Typically, jobs are large (involving at least 500 units). The plant has two production departments: Cutting and Assembly. In the Cutting Department, the fabric and wooden frame components are sized and cut. Other components are purchased from external suppliers and are removed from stores as needed for assembly. After the fabric and wooden components are finished for the entire job, they are moved to the Assembly Department. The Assembly Department takes the individual components and assembles the sofas (or chairs).
Beauville Furniture has been in business for over two decades and has a good reputation. However, during the past five years, Beauville experienced eroding profits and declining sales. Bids were increasingly lost (even aggressive bids) on the more popular models. Yet, the company was winning bids on some of the more-difficult-to-produce items. Lance Hays, the owner and manager, was frustrated. He simply couldn't understand how some of his competitors could sell for such low prices. On a common sofa job involving 500 units, Beauville's bids were running $25 per unit, or $12,500 per job more than the winning bids (on average). Yet, on the more difficult items, Beauville's bids were running about $60 per unit less than the next closest bid. Gisela Berling, vice president of finance, was assigned the task of preparing a cost analysis of the company's product lines. Lance wanted to know if the company's costs were excessive. Perhaps the company was being wasteful, and it was simply costing more to produce furniture than it was costing its competitors.
Gisela prepared herself by reading recent literature on cost management and product costing and attending several conferences that explored the same issues. She then reviewed the costing procedures of the company's mill and two plants and did a preliminary assessment of their soundness. The production costs of the mill were common to all lumber grades and were assigned using the physical units method. Since the output and production costs were fairly uniform throughout the year, the mill used an actual costing system. Although Gisela had no difficulty with actual costing, she decided to explore the effects of using the sales-value-at-split-off method. Thus, cost and production data for the mill were gathered so that an analysis could be conducted. The two plants used normal costing systems. The fabric plant used process costing, and the furniture plant used job-order costing. Both plants used plantwide overhead rates based on direct labor hours. Based on her initial reviews, she concluded that the costing procedures for the fabric plant were satisfactory. Essentially, there was no evidence of product diversity. A statistical analysis revealed that about 90 percent of the variability in the plant's overhead cost could be explained by direct labor hours. Thus, the use of a plantwide overhead rate based on direct labor hours seemed justified. What did concern her, though, was the material waste that she observed in the plant. Maybe a standard cost system would be useful for increasing the overall cost efficiency of the plant. Consequently, as part of her report to Lance, she decided to include a description of the fabric plant's costing procedures-at least for one of the fabric types. She also decided to develop a standard cost sheet for the chosen fabric. The furniture plant, however, was a more difficult matter. Product diversity was present and could be causing some distortions in product costs. Furthermore, statistical analysis revealed that only about 40 percent of the variability in overhead cost was explained by the direct labor hours. She decided that additional analysis was needed so that a sound product costing method could be recommended. One possibility would be to increase the number of overhead rates. Thus, she decided to include departmental data so that the effect of moving to departmental rates could be assessed. Finally, she also wanted to explore the possibility of converting the sawmill and fabric plant into profit centers and changing the existing transfer pricing policy.
With the cooperation of the cost accounting manager for the mill and each plant's controller, she gathered the following data for last year:
Sawmill:
Joint manufacturing costs: $900,000
Fabric Plant:
Budgeted overhead: $1,200,000 (50% fixed)
Practical volume (direct labor hours): 120,000 hours
Actual overhead: $1,150,000 (50% fixed)
Actual hours worked:
Departmental data on Fabric FB70 (actual costs and actual outcomes):
*Unitsare measured in yards for the Weaving and Pattern Department and in bolts forthe Coloring and Bolting Department. Note: With the exception of the cardboard bolt rods, materials are added at the beginning of each process. The cost of the rods is relatively insignificant and is included in overhead.
Proposed standard cost sheet for Fabric FB70 (for the Coloring and Bolting Department only):
Furniture Plant:
Departmental data (budgeted):
After some discussion with the furniture plant controller, Gisela decided to use machine hours to calculate the overhead rate for the Cutting Department and direct labor hours for the Assembly Department rate (the Cutting Department was more automated than the Assembly Department). As part of her report, she wanted to compare the effects of plantwide rates and departmental rates on the cost of jobs. She wanted to know if overhead costing could be the source of the pricing problems the company was experiencing.
To assess the effect of the different overhead assignment procedures, Gisela decided to examine two prospective jobs. One job, Job A500, could produce 500 sofas, using a frequently requested style and Fabric FB70. Bids on this type of job were being lost more frequently to competitors. The second job, Job B75, would produce 75 specially designed recliners. This job involved a new design and was more difficult for the workers to build. It involved some special cutting requirements and an unfamiliar assembly. Recently, the company seemed to be winning more bids on jobs of this type. To compute the costs of the two jobs, Gisela assembled the following information on the two jobs:
Job A500:
Job B75:
Required
Assume that the weaving and pattern process is not a separate process for each fabric. Also, assume that the yarn used for each fabric differs significantly in cost. In this case, would process costing be appropriate for the weaving and pattern process? What costing approach would you recommend? Describe your approach in detail.
Question
Sabrina Hoffman is founder and CEO of Golden Care, Inc., which owns and operates several assisted- living facilities. The facilities are apartment-style buildings with 25 to 30 one- or two-bedroom apartments. While each apartment has its own complete kitchen, in every building Golden Care offers communal dining options and an on-site nurse who is available 24 hours a day. Residents can choose monthly meal options that include one or two meals per day in the dining room. Residents who require nursing services (e.g., blood pressure monitoring and injections) can receive those services from the nurse. However, Golden Care facilities are not nursing homes, all residents are ambulatory, and custodial care is not an option. In the five years it has been in operation, the company has expanded from one facility to five, located in southwestern cities. The income statement for last year follows.

Sabrina originally got into the business because she had trouble finding adequate facilities for her mother. The concept worked well, and income over the past five years had grown nicely at 20 percent per year. However, Sabrina sensed clouds on the horizon. She knew that the population was aging and that her current clients would be moving to more traditional forms of nursing care. As a result, Sabrina wanted to consider adding one or more nursing homes to Golden Care. These nursing homes would be staffed around the clock with RNs and LPNs. The residents would likely have more severe medical problems and would be confined to beds or wheelchairs. Sabrina knew that quality care of this type was needed. So, she contacted Peter Verdon, her marketing manager, and Bernadette Masters, her accountant, for a brainstorming session.
Peter : "Sabrina, I really like the concept. As you know, several of our facilities have faced seeing their long-term residents move out to local nursing homes. Not only are these homes of lower quality than what we could provide, but losing a resident is heartrending for the staff, as well as for the remaining residents. I like the idea of providing a transition from less care to more."
Bernadette : "I agree with you, Peter. But let's not forget the differences between assisted-living and full-time, nursing-home-type care. Our expenses will really increase."
Sabrina : "That's why I wanted to talk with both of you. As you know, Golden Care's mission statement emphasizes the need to make a profit. We can't continue to serve our residents and provide high- quality care if we don't make enough money to pay our staff a living wage and earn enough of a profit to smooth over the rough patches and continue to improve our business. Could the two of you look into this idea, and get back to me in a week or so?"
Throughout the following week, the three communicated by e-mail. By the end of the week, a number of possibilities had surfaced, and these were summarized in a message from Bernadette to the others.
TO: [email protected], [email protected]
FROM: [email protected]
MESSAGE:
I've compiled the ideas from all of our e-mails into the following list. This may be a good starting point for our meeting tomorrow.
1. Buy an existing nursing home in one of Golden Care's current locations.
2. Buy an existing nursing home in another city.
3. Build a new nursing home facility in one of Golden Care's current locations.
4. Build a new nursing home facility in another city.
5. Build a wing on to an existing Golden Care facility. The Apache Junction facility has sufficient open land for an addition.
The next day, Sabrina, Peter, and Bernadette met again in Sabrina's office.
Sabrina : "I didn't realize there were so many possibilities. Are we going to have to work up numbers on each of them?"
Bernadette : "No, I think we can eliminate a few of them pretty quickly. For example, building a new facility would cost more than the other options, and it would involve the most risk."
Peter : "I agree, and I also think we might eliminate the purchase of an existing nursing home for the same reasons. Also, existing homes would not give us the option of building a facility that is state of the art and meets our needs, and it would lock us into a preexisting patient mix."
Sabrina : "I like that thinking. Let's restrict our attention to Option 5."
Bernadette : "I thought you might like that option, so Peter and I sketched out two alternatives for an extension of the Apache Junction building. We call the alternatives Basic Care and Lifestyle Care."
Peter : "There are different markets for each type of care. If we want to concentrate on Medicare and Medicaid patients, the reimbursement is lower, and we would want to offer the Basic Care option. Private insurance and private-pay patients could afford more services; if we are marketing to these patients, we could offer the Lifestyle Care option. Both alternatives provide high-quality nursing care. Basic Care concentrates on the quality nursing and maintenance activities. For example, the addition would have 25 double rooms, two nursing stations, two recreation rooms, a treatment room, and an office. The Lifestyle Care option adds physical and recreational therapy with a specially equipped gym and pool. That addition would have 30 single rooms, two nursing stations, a recreation room, a swimming pool, a hydrotherapy spa and gym, a treatment room, and an office. In each case, there would be cable TV and telephone hookups in each room and a buffer area between the nursing home and the apartments."
Sabrina : "Why the buffer area? Won't that add unnecessary cost?"
Peter : "It adds cost, but it will be well worth it. Sabrina, you must remember that the nursing home patients are different from the apartment residents. Some of the patients will have advanced dementia. We'll lose apartment residents in a hurry if they have to be reminded every day of what might be in store for them later on."
Sabrina : "I see your point. Bernadette, what will these two plans cost? I'll tell you right now that I like the Lifestyle Care option better. It fits with our history of doing whatever we can to make life better for our residents."
Bernadette : "I've checked into the costs of putting on a new wing and operating both alternatives. Here's a listing."

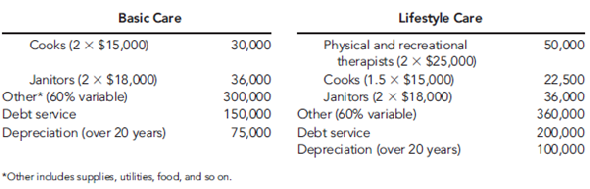
"In both cases, total administrative costs for Golden Care would increase by $30,000 per year. This seems high, but the increased legal and insurance requirements will add significantly more paperwork and accounting."
Sabrina : "All this sounds reasonable, but why is reimbursement such an important factor?"
Peter : "Well, if you admit Medicaid patients, the state will reimburse at most $30,000 per year. Private insurance policies will pay roughly $46,000 per year. We can charge up to about $65,000 for private patients, but this type of care is so expensive that many of these patients exhaust their funds and go on Medicaid. The nice aspect of Medicaid is that we can be virtually assured that we will operate at capacity."
Sabrina : "Can we cross that bridge when we come to it?"
Peter : " No, not really. Once the patient is a resident of our facility, it is hard to evict him or her. Also, while it is legal to force patients out before they go on Medicaid and to refuse to accept Medicaid patients, once we do accept Medicaid patients, we are prevented by law from evicting them-no matter how high our costs go."
Sabrina : "OK, it looks as if we have some hard work ahead of us to decide whether or not to get into this line of business."
Required
What is the markup percent of cost of services charged on the assisted-living expenses? What would the price per month for a Basic Care patient be if the same markup were used? For a Lifestyle Care patient? (Assume in both cases that occupancy is at 80 percent of capacity.)
Sabrina originally got into the business because she had trouble finding adequate facilities for her mother. The concept worked well, and income over the past five years had grown nicely at 20 percent per year. However, Sabrina sensed clouds on the horizon. She knew that the population was aging and that her current clients would be moving to more traditional forms of nursing care. As a result, Sabrina wanted to consider adding one or more nursing homes to Golden Care. These nursing homes would be staffed around the clock with RNs and LPNs. The residents would likely have more severe medical problems and would be confined to beds or wheelchairs. Sabrina knew that quality care of this type was needed. So, she contacted Peter Verdon, her marketing manager, and Bernadette Masters, her accountant, for a brainstorming session.
Peter : "Sabrina, I really like the concept. As you know, several of our facilities have faced seeing their long-term residents move out to local nursing homes. Not only are these homes of lower quality than what we could provide, but losing a resident is heartrending for the staff, as well as for the remaining residents. I like the idea of providing a transition from less care to more."
Bernadette : "I agree with you, Peter. But let's not forget the differences between assisted-living and full-time, nursing-home-type care. Our expenses will really increase."
Sabrina : "That's why I wanted to talk with both of you. As you know, Golden Care's mission statement emphasizes the need to make a profit. We can't continue to serve our residents and provide high- quality care if we don't make enough money to pay our staff a living wage and earn enough of a profit to smooth over the rough patches and continue to improve our business. Could the two of you look into this idea, and get back to me in a week or so?"
Throughout the following week, the three communicated by e-mail. By the end of the week, a number of possibilities had surfaced, and these were summarized in a message from Bernadette to the others.
TO: [email protected], [email protected]
FROM: [email protected]
MESSAGE:
I've compiled the ideas from all of our e-mails into the following list. This may be a good starting point for our meeting tomorrow.
1. Buy an existing nursing home in one of Golden Care's current locations.
2. Buy an existing nursing home in another city.
3. Build a new nursing home facility in one of Golden Care's current locations.
4. Build a new nursing home facility in another city.
5. Build a wing on to an existing Golden Care facility. The Apache Junction facility has sufficient open land for an addition.
The next day, Sabrina, Peter, and Bernadette met again in Sabrina's office.
Sabrina : "I didn't realize there were so many possibilities. Are we going to have to work up numbers on each of them?"
Bernadette : "No, I think we can eliminate a few of them pretty quickly. For example, building a new facility would cost more than the other options, and it would involve the most risk."
Peter : "I agree, and I also think we might eliminate the purchase of an existing nursing home for the same reasons. Also, existing homes would not give us the option of building a facility that is state of the art and meets our needs, and it would lock us into a preexisting patient mix."
Sabrina : "I like that thinking. Let's restrict our attention to Option 5."
Bernadette : "I thought you might like that option, so Peter and I sketched out two alternatives for an extension of the Apache Junction building. We call the alternatives Basic Care and Lifestyle Care."
Peter : "There are different markets for each type of care. If we want to concentrate on Medicare and Medicaid patients, the reimbursement is lower, and we would want to offer the Basic Care option. Private insurance and private-pay patients could afford more services; if we are marketing to these patients, we could offer the Lifestyle Care option. Both alternatives provide high-quality nursing care. Basic Care concentrates on the quality nursing and maintenance activities. For example, the addition would have 25 double rooms, two nursing stations, two recreation rooms, a treatment room, and an office. The Lifestyle Care option adds physical and recreational therapy with a specially equipped gym and pool. That addition would have 30 single rooms, two nursing stations, a recreation room, a swimming pool, a hydrotherapy spa and gym, a treatment room, and an office. In each case, there would be cable TV and telephone hookups in each room and a buffer area between the nursing home and the apartments."
Sabrina : "Why the buffer area? Won't that add unnecessary cost?"
Peter : "It adds cost, but it will be well worth it. Sabrina, you must remember that the nursing home patients are different from the apartment residents. Some of the patients will have advanced dementia. We'll lose apartment residents in a hurry if they have to be reminded every day of what might be in store for them later on."
Sabrina : "I see your point. Bernadette, what will these two plans cost? I'll tell you right now that I like the Lifestyle Care option better. It fits with our history of doing whatever we can to make life better for our residents."
Bernadette : "I've checked into the costs of putting on a new wing and operating both alternatives. Here's a listing."
"In both cases, total administrative costs for Golden Care would increase by $30,000 per year. This seems high, but the increased legal and insurance requirements will add significantly more paperwork and accounting."
Sabrina : "All this sounds reasonable, but why is reimbursement such an important factor?"
Peter : "Well, if you admit Medicaid patients, the state will reimburse at most $30,000 per year. Private insurance policies will pay roughly $46,000 per year. We can charge up to about $65,000 for private patients, but this type of care is so expensive that many of these patients exhaust their funds and go on Medicaid. The nice aspect of Medicaid is that we can be virtually assured that we will operate at capacity."
Sabrina : "Can we cross that bridge when we come to it?"
Peter : " No, not really. Once the patient is a resident of our facility, it is hard to evict him or her. Also, while it is legal to force patients out before they go on Medicaid and to refuse to accept Medicaid patients, once we do accept Medicaid patients, we are prevented by law from evicting them-no matter how high our costs go."
Sabrina : "OK, it looks as if we have some hard work ahead of us to decide whether or not to get into this line of business."
Required
What is the markup percent of cost of services charged on the assisted-living expenses? What would the price per month for a Basic Care patient be if the same markup were used? For a Lifestyle Care patient? (Assume in both cases that occupancy is at 80 percent of capacity.)
Question
CableTech Bell Corporation (CTB) operates in the telecommunications industry. CTB has two divisions: the Phone Division and the Cable Service Division. The Phone Division manufactures telephones in several plants located in the Midwest. The product lines run from relatively inexpensive touch-tone wall and desk phones to expensive, high-quality cellular phones. CTB also operates a cable TV service in Ohio. The Cable Service Division offers three products: a basic package with 25 channels; an enhanced package, which is the basic package plus 15 additional channels and two movie channels; and a premium package, which is the basic package plus 25 additional channels and three movie channels.
The Cable Service Division reported the following activity for the month of March:

The unit costs are divided as follows: 70 percent production and 30 percent marketing and customer service. Direct labor cost is the only driver used for tracing. Typically, the division uses only production costs to define unit costs. The preceding unit product cost information was provided at the request of the marketing manager and was the result of a special study.
Bryce Youngers, the president of CTB, is reasonably satisfied with the performance of the Cable Service Division. March's performance is fairly typical of what has been happening over the past two years. The Phone Division, however, is another matter. Its overall profit performance has been declining. Two years ago, income before income taxes had been about 25 percent of sales. March's dismal performance was also typical for what has been happening this year and is expected to continue-unless some action by management is taken to reverse the trend. During March, the Phone Division reported the following results:
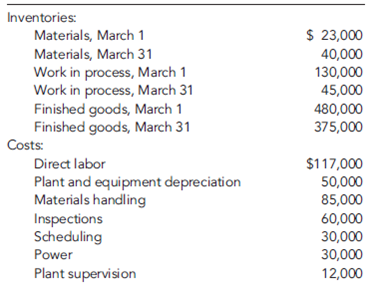

During March, the Phone Division purchased materials totaling $312,000. There are no significant inventories of supplies (beginning or ending). Supplies are accounted for separately from materials. CTB's Phone Division had sales totaling $1,170,000 for March.
Based on March's results, Bryce decided to meet with three of the Phone Division's managers: Kim Breashears, divisional manager; Jacob Carder, divisional controller; and Larry Hartley, sales manager. A transcript of their recorded conversation is given next:
Bryce: "March's profit performance is down once again, and I think we need to see if we can identify the problem and correct it-before it's too late. Kim, what's your assessment of the situation?"
Kim: "Foreign competition is eating us alive. They are coming in with lower-priced phones of comparable or higher quality than our own. I've talked with several of the retailers that carry our lines, and they say the same. They are convinced that we can sell more if we lower our prices."
Larry: "They're right. If we could lower our prices by 10 to 15 percent, I think that we'd regain most ofour lost market share. But we also need to make sure that the quality of our products meets that of our competitors. As you know, we are spending a lot of money each month on rework and warranties. That worries me. I'd like to see that warranty cost cut by 70 to 80 percent. If we could do that, then customers would be more satisfied with our products, and I bet that we would not only regain our market share but increase it."
Jacob: "Lowering prices without lowering per-unit costs will not help us increase our profitability.
I think we need to improve our cost accounting system. I am not confident that we really know how much each of our product lines is costing us. It may be that we are overpricing some of our units because we are overcosting them. We may be underpricing other units."
Larry: "This sounds promising-especially if the overcosting is for some of our high-volume lines. A price decrease for these products would make the biggest difference-and if we knew they were overcosted, then we could offer immediate price reductions."
Bryce: "Jacob, I need more explanation. We have been using the same cost accounting system for the last 10 years. Why would it be a problem?"
Jacob: "I think that our manufacturing environment has changed. Over the years, we have added a lot of different product lines. Some of these products make very different demands on our manufacturing overhead resources. We trace-or attempt to trace-overhead costs to the different products using direct labor cost, a unit-based cost driver. We may be doing more allocation than tracing. If so, then we probably don't have a very good idea of our actual product costs. Also, as you know, with the way computer technology has changed over time, it is easier and cheaper to collect and use detailed information-information that will allow us to assign costs more accurately."
Bryce: "This may be something we should explore. Jacob, what do you suggest?"
Jacob: "If we want more accurate product costs and if we really want to get in the cost reduction business, then we need to understand how costs behave. In particular, we need to understand activity cost behavior. Knowing what activities we perform, why we perform them, and how well we perform them will help us identify areas for improvement. We also need to know how the different products consume activity resources. What this boils down to is the need to use an activity-based management system. But before we jump into this, we need some idea of whether non-unit-based drivers add anything. Activity-based management is not an inexpensive undertaking. So I suggest that we do a preliminary study to see if direct labor cost is adequate for tracing. If not, then maybe some non-unit-drivers might be needed. In fact, if you would like,
I can gather some data that will provide some evidence on the usefulness of the activity-based approach."
Bryce: "What do you think, Kim? It's your division."
Kim: "What Jacob has said sounds promising. I think he should pursue it and do so quickly. I also think that we need to look at improving our quality. It sounds like we have a problem there. If quality could be improved, then our costs will drop. I'll talk to our quality people. Jacob, in the meantime, find out for us if moving to an activity-based system is the way to go. How much time do you need?"
Jacob: "I have already been gathering data. I could probably have a report within two weeks."

Based on my initial analysis, I am confident that an ABC system will offer significant improvement. For one of our conventional phone plants, I regressed total monthly overhead cost on monthly direct labor cost using the following 15 months of data:

The results were revealing. Although direct labor cost appears to be a driver of overhead cost, it really doesn't explain a lot of the variation. I then searched for other drivers-particularly non-unit drivers-that might offer more insight into overhead cost behavior. Every time a batch is produced, material movement occurs, regardless of the size of the batch. The number of moves seemed like a more logical driver. I was able to gather only 10 months of data for this. (Our information system doesn't provide the number of moves, so I had to build the data set by interviewing production personnel.) This information is provided next:

The regression results were impressive. There is no question in my mind that the number of moves is a good driver of materials-handling costs. Using the number of moves to assign materials-handling costs to products would likely be better than the cost assignment using direct labor cost. Furthermore, since small batches use the same number of moves as large batches, we have some evidence that we may be overcosting our high-volume products.
I looked at one more overhead activity: inspecting products. We have 15 inspectors who are paid an average of $4,000 per month. Each inspector offers about 160 hours of inspection capacity per month. However, it appears that they actually work only about 80 percent of those hours. The drop in demand we have experienced explains this idle time. I see no evidence of variable cost behavior here. I'm not exactly sure how to treat inspection cost, but I think that it is more related to inspection hours than direct labor cost. Some of the other overhead activities seem to be non-unit-level, as well-enough, in fact, to be concerned about how we assign costs.
After receiving the memo, Kim was intrigued. She then asked Jacob to use the same phone plant as a pilot for a preliminary ABC analysis. She instructed him to assign all overhead costs to the plant's two products (Regular and Deluxe models), using only four activities. The four activities were rework, moving materials, inspecting products, and a general catch-all activity labeled "other manufacturing activities." From the special study already performed, she knew that materials handling and inspecting involved significant cost; from production reports, she also knew that the rework activity involved significant cost. If the ABC and unit-based cost assignments did not differ by breaking out these three major activities, then ABC may not matter.
Pursuant to the request, Jacob produced the following cost and driver information:

Expected activity demands:

Required
Compute two different unit costs for each of the Cable Service Division's products. What managerial objectives are being served by these unit cost computations?
The Cable Service Division reported the following activity for the month of March:
The unit costs are divided as follows: 70 percent production and 30 percent marketing and customer service. Direct labor cost is the only driver used for tracing. Typically, the division uses only production costs to define unit costs. The preceding unit product cost information was provided at the request of the marketing manager and was the result of a special study.
Bryce Youngers, the president of CTB, is reasonably satisfied with the performance of the Cable Service Division. March's performance is fairly typical of what has been happening over the past two years. The Phone Division, however, is another matter. Its overall profit performance has been declining. Two years ago, income before income taxes had been about 25 percent of sales. March's dismal performance was also typical for what has been happening this year and is expected to continue-unless some action by management is taken to reverse the trend. During March, the Phone Division reported the following results:
During March, the Phone Division purchased materials totaling $312,000. There are no significant inventories of supplies (beginning or ending). Supplies are accounted for separately from materials. CTB's Phone Division had sales totaling $1,170,000 for March.
Based on March's results, Bryce decided to meet with three of the Phone Division's managers: Kim Breashears, divisional manager; Jacob Carder, divisional controller; and Larry Hartley, sales manager. A transcript of their recorded conversation is given next:
Bryce: "March's profit performance is down once again, and I think we need to see if we can identify the problem and correct it-before it's too late. Kim, what's your assessment of the situation?"
Kim: "Foreign competition is eating us alive. They are coming in with lower-priced phones of comparable or higher quality than our own. I've talked with several of the retailers that carry our lines, and they say the same. They are convinced that we can sell more if we lower our prices."
Larry: "They're right. If we could lower our prices by 10 to 15 percent, I think that we'd regain most ofour lost market share. But we also need to make sure that the quality of our products meets that of our competitors. As you know, we are spending a lot of money each month on rework and warranties. That worries me. I'd like to see that warranty cost cut by 70 to 80 percent. If we could do that, then customers would be more satisfied with our products, and I bet that we would not only regain our market share but increase it."
Jacob: "Lowering prices without lowering per-unit costs will not help us increase our profitability.
I think we need to improve our cost accounting system. I am not confident that we really know how much each of our product lines is costing us. It may be that we are overpricing some of our units because we are overcosting them. We may be underpricing other units."
Larry: "This sounds promising-especially if the overcosting is for some of our high-volume lines. A price decrease for these products would make the biggest difference-and if we knew they were overcosted, then we could offer immediate price reductions."
Bryce: "Jacob, I need more explanation. We have been using the same cost accounting system for the last 10 years. Why would it be a problem?"
Jacob: "I think that our manufacturing environment has changed. Over the years, we have added a lot of different product lines. Some of these products make very different demands on our manufacturing overhead resources. We trace-or attempt to trace-overhead costs to the different products using direct labor cost, a unit-based cost driver. We may be doing more allocation than tracing. If so, then we probably don't have a very good idea of our actual product costs. Also, as you know, with the way computer technology has changed over time, it is easier and cheaper to collect and use detailed information-information that will allow us to assign costs more accurately."
Bryce: "This may be something we should explore. Jacob, what do you suggest?"
Jacob: "If we want more accurate product costs and if we really want to get in the cost reduction business, then we need to understand how costs behave. In particular, we need to understand activity cost behavior. Knowing what activities we perform, why we perform them, and how well we perform them will help us identify areas for improvement. We also need to know how the different products consume activity resources. What this boils down to is the need to use an activity-based management system. But before we jump into this, we need some idea of whether non-unit-based drivers add anything. Activity-based management is not an inexpensive undertaking. So I suggest that we do a preliminary study to see if direct labor cost is adequate for tracing. If not, then maybe some non-unit-drivers might be needed. In fact, if you would like,
I can gather some data that will provide some evidence on the usefulness of the activity-based approach."
Bryce: "What do you think, Kim? It's your division."
Kim: "What Jacob has said sounds promising. I think he should pursue it and do so quickly. I also think that we need to look at improving our quality. It sounds like we have a problem there. If quality could be improved, then our costs will drop. I'll talk to our quality people. Jacob, in the meantime, find out for us if moving to an activity-based system is the way to go. How much time do you need?"
Jacob: "I have already been gathering data. I could probably have a report within two weeks."
Based on my initial analysis, I am confident that an ABC system will offer significant improvement. For one of our conventional phone plants, I regressed total monthly overhead cost on monthly direct labor cost using the following 15 months of data:
The results were revealing. Although direct labor cost appears to be a driver of overhead cost, it really doesn't explain a lot of the variation. I then searched for other drivers-particularly non-unit drivers-that might offer more insight into overhead cost behavior. Every time a batch is produced, material movement occurs, regardless of the size of the batch. The number of moves seemed like a more logical driver. I was able to gather only 10 months of data for this. (Our information system doesn't provide the number of moves, so I had to build the data set by interviewing production personnel.) This information is provided next:
The regression results were impressive. There is no question in my mind that the number of moves is a good driver of materials-handling costs. Using the number of moves to assign materials-handling costs to products would likely be better than the cost assignment using direct labor cost. Furthermore, since small batches use the same number of moves as large batches, we have some evidence that we may be overcosting our high-volume products.
I looked at one more overhead activity: inspecting products. We have 15 inspectors who are paid an average of $4,000 per month. Each inspector offers about 160 hours of inspection capacity per month. However, it appears that they actually work only about 80 percent of those hours. The drop in demand we have experienced explains this idle time. I see no evidence of variable cost behavior here. I'm not exactly sure how to treat inspection cost, but I think that it is more related to inspection hours than direct labor cost. Some of the other overhead activities seem to be non-unit-level, as well-enough, in fact, to be concerned about how we assign costs.
After receiving the memo, Kim was intrigued. She then asked Jacob to use the same phone plant as a pilot for a preliminary ABC analysis. She instructed him to assign all overhead costs to the plant's two products (Regular and Deluxe models), using only four activities. The four activities were rework, moving materials, inspecting products, and a general catch-all activity labeled "other manufacturing activities." From the special study already performed, she knew that materials handling and inspecting involved significant cost; from production reports, she also knew that the rework activity involved significant cost. If the ABC and unit-based cost assignments did not differ by breaking out these three major activities, then ABC may not matter.
Pursuant to the request, Jacob produced the following cost and driver information:
Expected activity demands:
Required
Compute two different unit costs for each of the Cable Service Division's products. What managerial objectives are being served by these unit cost computations?
Question
Beauville Furniture Corporation produces sofas, recliners, and lounge chairs. Beauville is located in a medium-sized community in the southeastern part of the United States. It is a major employer in the community. In fact, the economic well-being of the community is tied very strongly to Beauville. Beauville operates a sawmill, a fabric plant, and a furniture plant in the same community.
The sawmill buys logs from independent producers. The sawmill then processes the logs into four grades of lumber: firsts and seconds, No. 1 common, No. 2 common, and No. 3 common. All costs incurred in the mill are common to the four grades of lumber. All four grades of lumber are used by the furniture plant. The mill transfers everything it produces to the furniture plant, and the grades are transferred at cost. Trucks are used to move the lumber from the mill to the furniture plant. Although no outside sales exist, the mill could sell to external customers, and the selling prices of the four grades are known.
The fabric plant is responsible for producing the fabric that is used by the furniture plant. To produce three totally different fabrics (identified by fabric ID codes FB60, FB70, and FB80, respectively), the plant has three separate production operations-one for each fabric. Thus, production of all three fabrics occurs at the same time in different locations in the plant. Each fabric's production operation has two processes: the weaving and pattern process and the coloring and bolting process. In the weaving and pattern process, yarn is used to create yards of fabric with different designs. In the next process, the fabric is dyed, cut into 25-yard sections, and wrapped around cardboard rods to form 25-yard bolts. The bolts are transported by forklift to the furniture plant's Receiving Department. All of the output of the fabric plant is used by the furniture plant (to produce the sofas and chairs). For accounting purposes, the fabric is transferred at cost to the furniture plant.
The furniture plant produces orders for customers on a special-order basis. The customers specify the quantity, style, fabric, lumber grade, and pattern. Typically, jobs are large (involving at least 500 units). The plant has two production departments: Cutting and Assembly. In the Cutting Department, the fabric and wooden frame components are sized and cut. Other components are purchased from external suppliers and are removed from stores as needed for assembly. After the fabric and wooden components are finished for the entire job, they are moved to the Assembly Department. The Assembly Department takes the individual components and assembles the sofas (or chairs).
Beauville Furniture has been in business for over two decades and has a good reputation. However, during the past five years, Beauville experienced eroding profits and declining sales. Bids were increasingly lost (even aggressive bids) on the more popular models. Yet, the company was winning bids on some of the more-difficult-to-produce items. Lance Hays, the owner and manager, was frustrated. He simply couldn't understand how some of his competitors could sell for such low prices. On a common sofa job involving 500 units, Beauville's bids were running $25 per unit, or $12,500 per job more than the winning bids (on average). Yet, on the more difficult items, Beauville's bids were running about $60 per unit less than the next closest bid. Gisela Berling, vice president of finance, was assigned the task of preparing a cost analysis of the company's product lines. Lance wanted to know if the company's costs were excessive. Perhaps the company was being wasteful, and it was simply costing more to produce furniture than it was costing its competitors.
Gisela prepared herself by reading recent literature on cost management and product costing and attending several conferences that explored the same issues. She then reviewed the costing procedures of the company's mill and two plants and did a preliminary assessment of their soundness. The production costs of the mill were common to all lumber grades and were assigned using the physical units method. Since the output and production costs were fairly uniform throughout the year, the mill used an actual costing system. Although Gisela had no difficulty with actual costing, she decided to explore the effects of using the sales-value-at-split-off method. Thus, cost and production data for the mill were gathered so that an analysis could be conducted. The two plants used normal costing systems. The fabric plant used process costing, and the furniture plant used job-order costing. Both plants used plantwide overhead rates based on direct labor hours. Based on her initial reviews, she concluded that the costing procedures for the fabric plant were satisfactory. Essentially, there was no evidence of product diversity. A statistical analysis revealed that about 90 percent of the variability in the plant's overhead cost could be explained by direct labor hours. Thus, the use of a plantwide overhead rate based on direct labor hours seemed justified. What did concern her, though, was the material waste that she observed in the plant. Maybe a standard cost system would be useful for increasing the overall cost efficiency of the plant. Consequently, as part of her report to Lance, she decided to include a description of the fabric plant's costing procedures-at least for one of the fabric types. She also decided to develop a standard cost sheet for the chosen fabric. The furniture plant, however, was a more difficult matter. Product diversity was present and could be causing some distortions in product costs. Furthermore, statistical analysis revealed that only about 40 percent of the variability in overhead cost was explained by the direct labor hours. She decided that additional analysis was needed so that a sound product costing method could be recommended. One possibility would be to increase the number of overhead rates. Thus, she decided to include departmental data so that the effect of moving to departmental rates could be assessed. Finally, she also wanted to explore the possibility of converting the sawmill and fabric plant into profit centers and changing the existing transfer pricing policy.
With the cooperation of the cost accounting manager for the mill and each plant's controller, she gathered the following data for last year:
Sawmill:
Joint manufacturing costs: $900,000

Fabric Plant:
Budgeted overhead: $1,200,000 (50% fixed)
Practical volume (direct labor hours): 120,000 hours
Actual overhead: $1,150,000 (50% fixed)
Actual hours worked:

Departmental data on Fabric FB70 (actual costs and actual outcomes):


*Unitsare measured in yards for the Weaving and Pattern Department and in bolts forthe Coloring and Bolting Department. Note: With the exception of the cardboard bolt rods, materials are added at the beginning of each process. The cost of the rods is relatively insignificant and is included in overhead.
Proposed standard cost sheet for Fabric FB70 (for the Coloring and Bolting Department only):

Furniture Plant:
Departmental data (budgeted):

After some discussion with the furniture plant controller, Gisela decided to use machine hours to calculate the overhead rate for the Cutting Department and direct labor hours for the Assembly Department rate (the Cutting Department was more automated than the Assembly Department). As part of her report, she wanted to compare the effects of plantwide rates and departmental rates on the cost of jobs. She wanted to know if overhead costing could be the source of the pricing problems the company was experiencing.
To assess the effect of the different overhead assignment procedures, Gisela decided to examine two prospective jobs. One job, Job A500, could produce 500 sofas, using a frequently requested style and Fabric FB70. Bids on this type of job were being lost more frequently to competitors. The second job, Job B75, would produce 75 specially designed recliners. This job involved a new design and was more difficult for the workers to build. It involved some special cutting requirements and an unfamiliar assembly. Recently, the company seemed to be winning more bids on jobs of this type. To compute the costs of the two jobs, Gisela assembled the following information on the two jobs:
Job A500:

Job B75:

Required
In the Coloring and Bolting Department, 400,000 ounces of other materials were used to produce the output of the period. Using the proposed standard cost sheet, calculate the following variances for the Coloring and Bolting Department:
a. Materials price variance (for other materials only)
b. Materials usage variance (for other materials only)
c. Labor rate variance
d. Labor efficiency variance
In calculating the variances, which method did you use to compute the actual output of the period-FIFO or weighted average? Explain.
The sawmill buys logs from independent producers. The sawmill then processes the logs into four grades of lumber: firsts and seconds, No. 1 common, No. 2 common, and No. 3 common. All costs incurred in the mill are common to the four grades of lumber. All four grades of lumber are used by the furniture plant. The mill transfers everything it produces to the furniture plant, and the grades are transferred at cost. Trucks are used to move the lumber from the mill to the furniture plant. Although no outside sales exist, the mill could sell to external customers, and the selling prices of the four grades are known.
The fabric plant is responsible for producing the fabric that is used by the furniture plant. To produce three totally different fabrics (identified by fabric ID codes FB60, FB70, and FB80, respectively), the plant has three separate production operations-one for each fabric. Thus, production of all three fabrics occurs at the same time in different locations in the plant. Each fabric's production operation has two processes: the weaving and pattern process and the coloring and bolting process. In the weaving and pattern process, yarn is used to create yards of fabric with different designs. In the next process, the fabric is dyed, cut into 25-yard sections, and wrapped around cardboard rods to form 25-yard bolts. The bolts are transported by forklift to the furniture plant's Receiving Department. All of the output of the fabric plant is used by the furniture plant (to produce the sofas and chairs). For accounting purposes, the fabric is transferred at cost to the furniture plant.
The furniture plant produces orders for customers on a special-order basis. The customers specify the quantity, style, fabric, lumber grade, and pattern. Typically, jobs are large (involving at least 500 units). The plant has two production departments: Cutting and Assembly. In the Cutting Department, the fabric and wooden frame components are sized and cut. Other components are purchased from external suppliers and are removed from stores as needed for assembly. After the fabric and wooden components are finished for the entire job, they are moved to the Assembly Department. The Assembly Department takes the individual components and assembles the sofas (or chairs).
Beauville Furniture has been in business for over two decades and has a good reputation. However, during the past five years, Beauville experienced eroding profits and declining sales. Bids were increasingly lost (even aggressive bids) on the more popular models. Yet, the company was winning bids on some of the more-difficult-to-produce items. Lance Hays, the owner and manager, was frustrated. He simply couldn't understand how some of his competitors could sell for such low prices. On a common sofa job involving 500 units, Beauville's bids were running $25 per unit, or $12,500 per job more than the winning bids (on average). Yet, on the more difficult items, Beauville's bids were running about $60 per unit less than the next closest bid. Gisela Berling, vice president of finance, was assigned the task of preparing a cost analysis of the company's product lines. Lance wanted to know if the company's costs were excessive. Perhaps the company was being wasteful, and it was simply costing more to produce furniture than it was costing its competitors.
Gisela prepared herself by reading recent literature on cost management and product costing and attending several conferences that explored the same issues. She then reviewed the costing procedures of the company's mill and two plants and did a preliminary assessment of their soundness. The production costs of the mill were common to all lumber grades and were assigned using the physical units method. Since the output and production costs were fairly uniform throughout the year, the mill used an actual costing system. Although Gisela had no difficulty with actual costing, she decided to explore the effects of using the sales-value-at-split-off method. Thus, cost and production data for the mill were gathered so that an analysis could be conducted. The two plants used normal costing systems. The fabric plant used process costing, and the furniture plant used job-order costing. Both plants used plantwide overhead rates based on direct labor hours. Based on her initial reviews, she concluded that the costing procedures for the fabric plant were satisfactory. Essentially, there was no evidence of product diversity. A statistical analysis revealed that about 90 percent of the variability in the plant's overhead cost could be explained by direct labor hours. Thus, the use of a plantwide overhead rate based on direct labor hours seemed justified. What did concern her, though, was the material waste that she observed in the plant. Maybe a standard cost system would be useful for increasing the overall cost efficiency of the plant. Consequently, as part of her report to Lance, she decided to include a description of the fabric plant's costing procedures-at least for one of the fabric types. She also decided to develop a standard cost sheet for the chosen fabric. The furniture plant, however, was a more difficult matter. Product diversity was present and could be causing some distortions in product costs. Furthermore, statistical analysis revealed that only about 40 percent of the variability in overhead cost was explained by the direct labor hours. She decided that additional analysis was needed so that a sound product costing method could be recommended. One possibility would be to increase the number of overhead rates. Thus, she decided to include departmental data so that the effect of moving to departmental rates could be assessed. Finally, she also wanted to explore the possibility of converting the sawmill and fabric plant into profit centers and changing the existing transfer pricing policy.
With the cooperation of the cost accounting manager for the mill and each plant's controller, she gathered the following data for last year:
Sawmill:
Joint manufacturing costs: $900,000
Fabric Plant:
Budgeted overhead: $1,200,000 (50% fixed)
Practical volume (direct labor hours): 120,000 hours
Actual overhead: $1,150,000 (50% fixed)
Actual hours worked:
Departmental data on Fabric FB70 (actual costs and actual outcomes):
*Unitsare measured in yards for the Weaving and Pattern Department and in bolts forthe Coloring and Bolting Department. Note: With the exception of the cardboard bolt rods, materials are added at the beginning of each process. The cost of the rods is relatively insignificant and is included in overhead.
Proposed standard cost sheet for Fabric FB70 (for the Coloring and Bolting Department only):
Furniture Plant:
Departmental data (budgeted):
After some discussion with the furniture plant controller, Gisela decided to use machine hours to calculate the overhead rate for the Cutting Department and direct labor hours for the Assembly Department rate (the Cutting Department was more automated than the Assembly Department). As part of her report, she wanted to compare the effects of plantwide rates and departmental rates on the cost of jobs. She wanted to know if overhead costing could be the source of the pricing problems the company was experiencing.
To assess the effect of the different overhead assignment procedures, Gisela decided to examine two prospective jobs. One job, Job A500, could produce 500 sofas, using a frequently requested style and Fabric FB70. Bids on this type of job were being lost more frequently to competitors. The second job, Job B75, would produce 75 specially designed recliners. This job involved a new design and was more difficult for the workers to build. It involved some special cutting requirements and an unfamiliar assembly. Recently, the company seemed to be winning more bids on jobs of this type. To compute the costs of the two jobs, Gisela assembled the following information on the two jobs:
Job A500:
Job B75:
Required
In the Coloring and Bolting Department, 400,000 ounces of other materials were used to produce the output of the period. Using the proposed standard cost sheet, calculate the following variances for the Coloring and Bolting Department:
a. Materials price variance (for other materials only)
b. Materials usage variance (for other materials only)
c. Labor rate variance
d. Labor efficiency variance
In calculating the variances, which method did you use to compute the actual output of the period-FIFO or weighted average? Explain.
Question
Sabrina Hoffman is founder and CEO of Golden Care, Inc., which owns and operates several assisted- living facilities. The facilities are apartment-style buildings with 25 to 30 one- or two-bedroom apartments. While each apartment has its own complete kitchen, in every building Golden Care offers communal dining options and an on-site nurse who is available 24 hours a day. Residents can choose monthly meal options that include one or two meals per day in the dining room. Residents who require nursing services (e.g., blood pressure monitoring and injections) can receive those services from the nurse. However, Golden Care facilities are not nursing homes, all residents are ambulatory, and custodial care is not an option. In the five years it has been in operation, the company has expanded from one facility to five, located in southwestern cities. The income statement for last year follows.
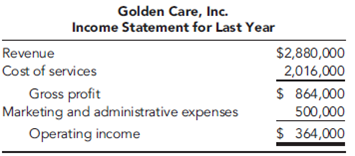
Sabrina originally got into the business because she had trouble finding adequate facilities for her mother. The concept worked well, and income over the past five years had grown nicely at 20 percent per year. However, Sabrina sensed clouds on the horizon. She knew that the population was aging and that her current clients would be moving to more traditional forms of nursing care. As a result, Sabrina wanted to consider adding one or more nursing homes to Golden Care. These nursing homes would be staffed around the clock with RNs and LPNs. The residents would likely have more severe medical problems and would be confined to beds or wheelchairs. Sabrina knew that quality care of this type was needed. So, she contacted Peter Verdon, her marketing manager, and Bernadette Masters, her accountant, for a brainstorming session.
Peter : "Sabrina, I really like the concept. As you know, several of our facilities have faced seeing their long-term residents move out to local nursing homes. Not only are these homes of lower quality than what we could provide, but losing a resident is heartrending for the staff, as well as for the remaining residents. I like the idea of providing a transition from less care to more."
Bernadette : "I agree with you, Peter. But let's not forget the differences between assisted-living and full-time, nursing-home-type care. Our expenses will really increase."
Sabrina : "That's why I wanted to talk with both of you. As you know, Golden Care's mission statement emphasizes the need to make a profit. We can't continue to serve our residents and provide high- quality care if we don't make enough money to pay our staff a living wage and earn enough of a profit to smooth over the rough patches and continue to improve our business. Could the two of you look into this idea, and get back to me in a week or so?"
Throughout the following week, the three communicated by e-mail. By the end of the week, a number of possibilities had surfaced, and these were summarized in a message from Bernadette to the others.
TO: [email protected], [email protected]
FROM: [email protected]
MESSAGE:
I've compiled the ideas from all of our e-mails into the following list. This may be a good starting point for our meeting tomorrow.
1. Buy an existing nursing home in one of Golden Care's current locations.
2. Buy an existing nursing home in another city.
3. Build a new nursing home facility in one of Golden Care's current locations.
4. Build a new nursing home facility in another city.
5. Build a wing on to an existing Golden Care facility. The Apache Junction facility has sufficient open land for an addition.
The next day, Sabrina, Peter, and Bernadette met again in Sabrina's office.
Sabrina : "I didn't realize there were so many possibilities. Are we going to have to work up numbers on each of them?"
Bernadette : "No, I think we can eliminate a few of them pretty quickly. For example, building a new facility would cost more than the other options, and it would involve the most risk."
Peter : "I agree, and I also think we might eliminate the purchase of an existing nursing home for the same reasons. Also, existing homes would not give us the option of building a facility that is state of the art and meets our needs, and it would lock us into a preexisting patient mix."
Sabrina : "I like that thinking. Let's restrict our attention to Option 5."
Bernadette : "I thought you might like that option, so Peter and I sketched out two alternatives for an extension of the Apache Junction building. We call the alternatives Basic Care and Lifestyle Care."
Peter : "There are different markets for each type of care. If we want to concentrate on Medicare and Medicaid patients, the reimbursement is lower, and we would want to offer the Basic Care option. Private insurance and private-pay patients could afford more services; if we are marketing to these patients, we could offer the Lifestyle Care option. Both alternatives provide high-quality nursing care. Basic Care concentrates on the quality nursing and maintenance activities. For example, the addition would have 25 double rooms, two nursing stations, two recreation rooms, a treatment room, and an office. The Lifestyle Care option adds physical and recreational therapy with a specially equipped gym and pool. That addition would have 30 single rooms, two nursing stations, a recreation room, a swimming pool, a hydrotherapy spa and gym, a treatment room, and an office. In each case, there would be cable TV and telephone hookups in each room and a buffer area between the nursing home and the apartments."
Sabrina : "Why the buffer area? Won't that add unnecessary cost?"
Peter : "It adds cost, but it will be well worth it. Sabrina, you must remember that the nursing home patients are different from the apartment residents. Some of the patients will have advanced dementia. We'll lose apartment residents in a hurry if they have to be reminded every day of what might be in store for them later on."
Sabrina : "I see your point. Bernadette, what will these two plans cost? I'll tell you right now that I like the Lifestyle Care option better. It fits with our history of doing whatever we can to make life better for our residents."
Bernadette : "I've checked into the costs of putting on a new wing and operating both alternatives. Here's a listing."


"In both cases, total administrative costs for Golden Care would increase by $30,000 per year. This seems high, but the increased legal and insurance requirements will add significantly more paperwork and accounting."
Sabrina : "All this sounds reasonable, but why is reimbursement such an important factor?"
Peter : "Well, if you admit Medicaid patients, the state will reimburse at most $30,000 per year. Private insurance policies will pay roughly $46,000 per year. We can charge up to about $65,000 for private patients, but this type of care is so expensive that many of these patients exhaust their funds and go on Medicaid. The nice aspect of Medicaid is that we can be virtually assured that we will operate at capacity."
Sabrina : "Can we cross that bridge when we come to it?"
Peter : " No, not really. Once the patient is a resident of our facility, it is hard to evict him or her. Also, while it is legal to force patients out before they go on Medicaid and to refuse to accept Medicaid patients, once we do accept Medicaid patients, we are prevented by law from evicting them-no matter how high our costs go."
Sabrina : "OK, it looks as if we have some hard work ahead of us to decide whether or not to get into this line of business."
Required
What is the payback period for the new addition?
Sabrina originally got into the business because she had trouble finding adequate facilities for her mother. The concept worked well, and income over the past five years had grown nicely at 20 percent per year. However, Sabrina sensed clouds on the horizon. She knew that the population was aging and that her current clients would be moving to more traditional forms of nursing care. As a result, Sabrina wanted to consider adding one or more nursing homes to Golden Care. These nursing homes would be staffed around the clock with RNs and LPNs. The residents would likely have more severe medical problems and would be confined to beds or wheelchairs. Sabrina knew that quality care of this type was needed. So, she contacted Peter Verdon, her marketing manager, and Bernadette Masters, her accountant, for a brainstorming session.
Peter : "Sabrina, I really like the concept. As you know, several of our facilities have faced seeing their long-term residents move out to local nursing homes. Not only are these homes of lower quality than what we could provide, but losing a resident is heartrending for the staff, as well as for the remaining residents. I like the idea of providing a transition from less care to more."
Bernadette : "I agree with you, Peter. But let's not forget the differences between assisted-living and full-time, nursing-home-type care. Our expenses will really increase."
Sabrina : "That's why I wanted to talk with both of you. As you know, Golden Care's mission statement emphasizes the need to make a profit. We can't continue to serve our residents and provide high- quality care if we don't make enough money to pay our staff a living wage and earn enough of a profit to smooth over the rough patches and continue to improve our business. Could the two of you look into this idea, and get back to me in a week or so?"
Throughout the following week, the three communicated by e-mail. By the end of the week, a number of possibilities had surfaced, and these were summarized in a message from Bernadette to the others.
TO: [email protected], [email protected]
FROM: [email protected]
MESSAGE:
I've compiled the ideas from all of our e-mails into the following list. This may be a good starting point for our meeting tomorrow.
1. Buy an existing nursing home in one of Golden Care's current locations.
2. Buy an existing nursing home in another city.
3. Build a new nursing home facility in one of Golden Care's current locations.
4. Build a new nursing home facility in another city.
5. Build a wing on to an existing Golden Care facility. The Apache Junction facility has sufficient open land for an addition.
The next day, Sabrina, Peter, and Bernadette met again in Sabrina's office.
Sabrina : "I didn't realize there were so many possibilities. Are we going to have to work up numbers on each of them?"
Bernadette : "No, I think we can eliminate a few of them pretty quickly. For example, building a new facility would cost more than the other options, and it would involve the most risk."
Peter : "I agree, and I also think we might eliminate the purchase of an existing nursing home for the same reasons. Also, existing homes would not give us the option of building a facility that is state of the art and meets our needs, and it would lock us into a preexisting patient mix."
Sabrina : "I like that thinking. Let's restrict our attention to Option 5."
Bernadette : "I thought you might like that option, so Peter and I sketched out two alternatives for an extension of the Apache Junction building. We call the alternatives Basic Care and Lifestyle Care."
Peter : "There are different markets for each type of care. If we want to concentrate on Medicare and Medicaid patients, the reimbursement is lower, and we would want to offer the Basic Care option. Private insurance and private-pay patients could afford more services; if we are marketing to these patients, we could offer the Lifestyle Care option. Both alternatives provide high-quality nursing care. Basic Care concentrates on the quality nursing and maintenance activities. For example, the addition would have 25 double rooms, two nursing stations, two recreation rooms, a treatment room, and an office. The Lifestyle Care option adds physical and recreational therapy with a specially equipped gym and pool. That addition would have 30 single rooms, two nursing stations, a recreation room, a swimming pool, a hydrotherapy spa and gym, a treatment room, and an office. In each case, there would be cable TV and telephone hookups in each room and a buffer area between the nursing home and the apartments."
Sabrina : "Why the buffer area? Won't that add unnecessary cost?"
Peter : "It adds cost, but it will be well worth it. Sabrina, you must remember that the nursing home patients are different from the apartment residents. Some of the patients will have advanced dementia. We'll lose apartment residents in a hurry if they have to be reminded every day of what might be in store for them later on."
Sabrina : "I see your point. Bernadette, what will these two plans cost? I'll tell you right now that I like the Lifestyle Care option better. It fits with our history of doing whatever we can to make life better for our residents."
Bernadette : "I've checked into the costs of putting on a new wing and operating both alternatives. Here's a listing."
"In both cases, total administrative costs for Golden Care would increase by $30,000 per year. This seems high, but the increased legal and insurance requirements will add significantly more paperwork and accounting."
Sabrina : "All this sounds reasonable, but why is reimbursement such an important factor?"
Peter : "Well, if you admit Medicaid patients, the state will reimburse at most $30,000 per year. Private insurance policies will pay roughly $46,000 per year. We can charge up to about $65,000 for private patients, but this type of care is so expensive that many of these patients exhaust their funds and go on Medicaid. The nice aspect of Medicaid is that we can be virtually assured that we will operate at capacity."
Sabrina : "Can we cross that bridge when we come to it?"
Peter : " No, not really. Once the patient is a resident of our facility, it is hard to evict him or her. Also, while it is legal to force patients out before they go on Medicaid and to refuse to accept Medicaid patients, once we do accept Medicaid patients, we are prevented by law from evicting them-no matter how high our costs go."
Sabrina : "OK, it looks as if we have some hard work ahead of us to decide whether or not to get into this line of business."
Required
What is the payback period for the new addition?
Question
CableTech Bell Corporation (CTB) operates in the telecommunications industry. CTB has two divisions: the Phone Division and the Cable Service Division. The Phone Division manufactures telephones in several plants located in the Midwest. The product lines run from relatively inexpensive touch-tone wall and desk phones to expensive, high-quality cellular phones. CTB also operates a cable TV service in Ohio. The Cable Service Division offers three products: a basic package with 25 channels; an enhanced package, which is the basic package plus 15 additional channels and two movie channels; and a premium package, which is the basic package plus 25 additional channels and three movie channels.
The Cable Service Division reported the following activity for the month of March:
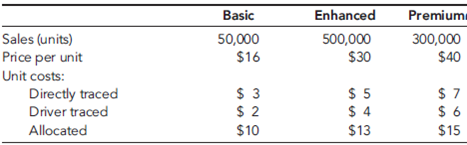
The unit costs are divided as follows: 70 percent production and 30 percent marketing and customer service. Direct labor cost is the only driver used for tracing. Typically, the division uses only production costs to define unit costs. The preceding unit product cost information was provided at the request of the marketing manager and was the result of a special study.
Bryce Youngers, the president of CTB, is reasonably satisfied with the performance of the Cable Service Division. March's performance is fairly typical of what has been happening over the past two years. The Phone Division, however, is another matter. Its overall profit performance has been declining. Two years ago, income before income taxes had been about 25 percent of sales. March's dismal performance was also typical for what has been happening this year and is expected to continue-unless some action by management is taken to reverse the trend. During March, the Phone Division reported the following results:


During March, the Phone Division purchased materials totaling $312,000. There are no significant inventories of supplies (beginning or ending). Supplies are accounted for separately from materials. CTB's Phone Division had sales totaling $1,170,000 for March.
Based on March's results, Bryce decided to meet with three of the Phone Division's managers: Kim Breashears, divisional manager; Jacob Carder, divisional controller; and Larry Hartley, sales manager. A transcript of their recorded conversation is given next:
Bryce: "March's profit performance is down once again, and I think we need to see if we can identify the problem and correct it-before it's too late. Kim, what's your assessment of the situation?"
Kim: "Foreign competition is eating us alive. They are coming in with lower-priced phones of comparable or higher quality than our own. I've talked with several of the retailers that carry our lines, and they say the same. They are convinced that we can sell more if we lower our prices."
Larry: "They're right. If we could lower our prices by 10 to 15 percent, I think that we'd regain most ofour lost market share. But we also need to make sure that the quality of our products meets that of our competitors. As you know, we are spending a lot of money each month on rework and warranties. That worries me. I'd like to see that warranty cost cut by 70 to 80 percent. If we could do that, then customers would be more satisfied with our products, and I bet that we would not only regain our market share but increase it."
Jacob: "Lowering prices without lowering per-unit costs will not help us increase our profitability.
I think we need to improve our cost accounting system. I am not confident that we really know how much each of our product lines is costing us. It may be that we are overpricing some of our units because we are overcosting them. We may be underpricing other units."
Larry: "This sounds promising-especially if the overcosting is for some of our high-volume lines. A price decrease for these products would make the biggest difference-and if we knew they were overcosted, then we could offer immediate price reductions."
Bryce: "Jacob, I need more explanation. We have been using the same cost accounting system for the last 10 years. Why would it be a problem?"
Jacob: "I think that our manufacturing environment has changed. Over the years, we have added a lot of different product lines. Some of these products make very different demands on our manufacturing overhead resources. We trace-or attempt to trace-overhead costs to the different products using direct labor cost, a unit-based cost driver. We may be doing more allocation than tracing. If so, then we probably don't have a very good idea of our actual product costs. Also, as you know, with the way computer technology has changed over time, it is easier and cheaper to collect and use detailed information-information that will allow us to assign costs more accurately."
Bryce: "This may be something we should explore. Jacob, what do you suggest?"
Jacob: "If we want more accurate product costs and if we really want to get in the cost reduction business, then we need to understand how costs behave. In particular, we need to understand activity cost behavior. Knowing what activities we perform, why we perform them, and how well we perform them will help us identify areas for improvement. We also need to know how the different products consume activity resources. What this boils down to is the need to use an activity-based management system. But before we jump into this, we need some idea of whether non-unit-based drivers add anything. Activity-based management is not an inexpensive undertaking. So I suggest that we do a preliminary study to see if direct labor cost is adequate for tracing. If not, then maybe some non-unit-drivers might be needed. In fact, if you would like,
I can gather some data that will provide some evidence on the usefulness of the activity-based approach."
Bryce: "What do you think, Kim? It's your division."
Kim: "What Jacob has said sounds promising. I think he should pursue it and do so quickly. I also think that we need to look at improving our quality. It sounds like we have a problem there. If quality could be improved, then our costs will drop. I'll talk to our quality people. Jacob, in the meantime, find out for us if moving to an activity-based system is the way to go. How much time do you need?"
Jacob: "I have already been gathering data. I could probably have a report within two weeks."

Based on my initial analysis, I am confident that an ABC system will offer significant improvement. For one of our conventional phone plants, I regressed total monthly overhead cost on monthly direct labor cost using the following 15 months of data:

The results were revealing. Although direct labor cost appears to be a driver of overhead cost, it really doesn't explain a lot of the variation. I then searched for other drivers-particularly non-unit drivers-that might offer more insight into overhead cost behavior. Every time a batch is produced, material movement occurs, regardless of the size of the batch. The number of moves seemed like a more logical driver. I was able to gather only 10 months of data for this. (Our information system doesn't provide the number of moves, so I had to build the data set by interviewing production personnel.) This information is provided next:

The regression results were impressive. There is no question in my mind that the number of moves is a good driver of materials-handling costs. Using the number of moves to assign materials-handling costs to products would likely be better than the cost assignment using direct labor cost. Furthermore, since small batches use the same number of moves as large batches, we have some evidence that we may be overcosting our high-volume products.
I looked at one more overhead activity: inspecting products. We have 15 inspectors who are paid an average of $4,000 per month. Each inspector offers about 160 hours of inspection capacity per month. However, it appears that they actually work only about 80 percent of those hours. The drop in demand we have experienced explains this idle time. I see no evidence of variable cost behavior here. I'm not exactly sure how to treat inspection cost, but I think that it is more related to inspection hours than direct labor cost. Some of the other overhead activities seem to be non-unit-level, as well-enough, in fact, to be concerned about how we assign costs.
After receiving the memo, Kim was intrigued. She then asked Jacob to use the same phone plant as a pilot for a preliminary ABC analysis. She instructed him to assign all overhead costs to the plant's two products (Regular and Deluxe models), using only four activities. The four activities were rework, moving materials, inspecting products, and a general catch-all activity labeled "other manufacturing activities." From the special study already performed, she knew that materials handling and inspecting involved significant cost; from production reports, she also knew that the rework activity involved significant cost. If the ABC and unit-based cost assignments did not differ by breaking out these three major activities, then ABC may not matter.
Pursuant to the request, Jacob produced the following cost and driver information:

Expected activity demands:

Required
Three different cost categories are provided by the Cable Service Division: direct tracing, driver tracing, and allocation. Discuss the meaning of each. Based on how costs are assigned, do you think that the Cable Service Division is using a functional-based or an activity-based cost accounting system? What other differences exist between functional-based and activity-based cost accounting systems?
The Cable Service Division reported the following activity for the month of March:
The unit costs are divided as follows: 70 percent production and 30 percent marketing and customer service. Direct labor cost is the only driver used for tracing. Typically, the division uses only production costs to define unit costs. The preceding unit product cost information was provided at the request of the marketing manager and was the result of a special study.
Bryce Youngers, the president of CTB, is reasonably satisfied with the performance of the Cable Service Division. March's performance is fairly typical of what has been happening over the past two years. The Phone Division, however, is another matter. Its overall profit performance has been declining. Two years ago, income before income taxes had been about 25 percent of sales. March's dismal performance was also typical for what has been happening this year and is expected to continue-unless some action by management is taken to reverse the trend. During March, the Phone Division reported the following results:
During March, the Phone Division purchased materials totaling $312,000. There are no significant inventories of supplies (beginning or ending). Supplies are accounted for separately from materials. CTB's Phone Division had sales totaling $1,170,000 for March.
Based on March's results, Bryce decided to meet with three of the Phone Division's managers: Kim Breashears, divisional manager; Jacob Carder, divisional controller; and Larry Hartley, sales manager. A transcript of their recorded conversation is given next:
Bryce: "March's profit performance is down once again, and I think we need to see if we can identify the problem and correct it-before it's too late. Kim, what's your assessment of the situation?"
Kim: "Foreign competition is eating us alive. They are coming in with lower-priced phones of comparable or higher quality than our own. I've talked with several of the retailers that carry our lines, and they say the same. They are convinced that we can sell more if we lower our prices."
Larry: "They're right. If we could lower our prices by 10 to 15 percent, I think that we'd regain most ofour lost market share. But we also need to make sure that the quality of our products meets that of our competitors. As you know, we are spending a lot of money each month on rework and warranties. That worries me. I'd like to see that warranty cost cut by 70 to 80 percent. If we could do that, then customers would be more satisfied with our products, and I bet that we would not only regain our market share but increase it."
Jacob: "Lowering prices without lowering per-unit costs will not help us increase our profitability.
I think we need to improve our cost accounting system. I am not confident that we really know how much each of our product lines is costing us. It may be that we are overpricing some of our units because we are overcosting them. We may be underpricing other units."
Larry: "This sounds promising-especially if the overcosting is for some of our high-volume lines. A price decrease for these products would make the biggest difference-and if we knew they were overcosted, then we could offer immediate price reductions."
Bryce: "Jacob, I need more explanation. We have been using the same cost accounting system for the last 10 years. Why would it be a problem?"
Jacob: "I think that our manufacturing environment has changed. Over the years, we have added a lot of different product lines. Some of these products make very different demands on our manufacturing overhead resources. We trace-or attempt to trace-overhead costs to the different products using direct labor cost, a unit-based cost driver. We may be doing more allocation than tracing. If so, then we probably don't have a very good idea of our actual product costs. Also, as you know, with the way computer technology has changed over time, it is easier and cheaper to collect and use detailed information-information that will allow us to assign costs more accurately."
Bryce: "This may be something we should explore. Jacob, what do you suggest?"
Jacob: "If we want more accurate product costs and if we really want to get in the cost reduction business, then we need to understand how costs behave. In particular, we need to understand activity cost behavior. Knowing what activities we perform, why we perform them, and how well we perform them will help us identify areas for improvement. We also need to know how the different products consume activity resources. What this boils down to is the need to use an activity-based management system. But before we jump into this, we need some idea of whether non-unit-based drivers add anything. Activity-based management is not an inexpensive undertaking. So I suggest that we do a preliminary study to see if direct labor cost is adequate for tracing. If not, then maybe some non-unit-drivers might be needed. In fact, if you would like,
I can gather some data that will provide some evidence on the usefulness of the activity-based approach."
Bryce: "What do you think, Kim? It's your division."
Kim: "What Jacob has said sounds promising. I think he should pursue it and do so quickly. I also think that we need to look at improving our quality. It sounds like we have a problem there. If quality could be improved, then our costs will drop. I'll talk to our quality people. Jacob, in the meantime, find out for us if moving to an activity-based system is the way to go. How much time do you need?"
Jacob: "I have already been gathering data. I could probably have a report within two weeks."
Based on my initial analysis, I am confident that an ABC system will offer significant improvement. For one of our conventional phone plants, I regressed total monthly overhead cost on monthly direct labor cost using the following 15 months of data:
The results were revealing. Although direct labor cost appears to be a driver of overhead cost, it really doesn't explain a lot of the variation. I then searched for other drivers-particularly non-unit drivers-that might offer more insight into overhead cost behavior. Every time a batch is produced, material movement occurs, regardless of the size of the batch. The number of moves seemed like a more logical driver. I was able to gather only 10 months of data for this. (Our information system doesn't provide the number of moves, so I had to build the data set by interviewing production personnel.) This information is provided next:
The regression results were impressive. There is no question in my mind that the number of moves is a good driver of materials-handling costs. Using the number of moves to assign materials-handling costs to products would likely be better than the cost assignment using direct labor cost. Furthermore, since small batches use the same number of moves as large batches, we have some evidence that we may be overcosting our high-volume products.
I looked at one more overhead activity: inspecting products. We have 15 inspectors who are paid an average of $4,000 per month. Each inspector offers about 160 hours of inspection capacity per month. However, it appears that they actually work only about 80 percent of those hours. The drop in demand we have experienced explains this idle time. I see no evidence of variable cost behavior here. I'm not exactly sure how to treat inspection cost, but I think that it is more related to inspection hours than direct labor cost. Some of the other overhead activities seem to be non-unit-level, as well-enough, in fact, to be concerned about how we assign costs.
After receiving the memo, Kim was intrigued. She then asked Jacob to use the same phone plant as a pilot for a preliminary ABC analysis. She instructed him to assign all overhead costs to the plant's two products (Regular and Deluxe models), using only four activities. The four activities were rework, moving materials, inspecting products, and a general catch-all activity labeled "other manufacturing activities." From the special study already performed, she knew that materials handling and inspecting involved significant cost; from production reports, she also knew that the rework activity involved significant cost. If the ABC and unit-based cost assignments did not differ by breaking out these three major activities, then ABC may not matter.
Pursuant to the request, Jacob produced the following cost and driver information:
Expected activity demands:
Required
Three different cost categories are provided by the Cable Service Division: direct tracing, driver tracing, and allocation. Discuss the meaning of each. Based on how costs are assigned, do you think that the Cable Service Division is using a functional-based or an activity-based cost accounting system? What other differences exist between functional-based and activity-based cost accounting systems?
Question
Beauville Furniture Corporation produces sofas, recliners, and lounge chairs. Beauville is located in a medium-sized community in the southeastern part of the United States. It is a major employer in the community. In fact, the economic well-being of the community is tied very strongly to Beauville. Beauville operates a sawmill, a fabric plant, and a furniture plant in the same community.
The sawmill buys logs from independent producers. The sawmill then processes the logs into four grades of lumber: firsts and seconds, No. 1 common, No. 2 common, and No. 3 common. All costs incurred in the mill are common to the four grades of lumber. All four grades of lumber are used by the furniture plant. The mill transfers everything it produces to the furniture plant, and the grades are transferred at cost. Trucks are used to move the lumber from the mill to the furniture plant. Although no outside sales exist, the mill could sell to external customers, and the selling prices of the four grades are known.
The fabric plant is responsible for producing the fabric that is used by the furniture plant. To produce three totally different fabrics (identified by fabric ID codes FB60, FB70, and FB80, respectively), the plant has three separate production operations-one for each fabric. Thus, production of all three fabrics occurs at the same time in different locations in the plant. Each fabric's production operation has two processes: the weaving and pattern process and the coloring and bolting process. In the weaving and pattern process, yarn is used to create yards of fabric with different designs. In the next process, the fabric is dyed, cut into 25-yard sections, and wrapped around cardboard rods to form 25-yard bolts. The bolts are transported by forklift to the furniture plant's Receiving Department. All of the output of the fabric plant is used by the furniture plant (to produce the sofas and chairs). For accounting purposes, the fabric is transferred at cost to the furniture plant.
The furniture plant produces orders for customers on a special-order basis. The customers specify the quantity, style, fabric, lumber grade, and pattern. Typically, jobs are large (involving at least 500 units). The plant has two production departments: Cutting and Assembly. In the Cutting Department, the fabric and wooden frame components are sized and cut. Other components are purchased from external suppliers and are removed from stores as needed for assembly. After the fabric and wooden components are finished for the entire job, they are moved to the Assembly Department. The Assembly Department takes the individual components and assembles the sofas (or chairs).
Beauville Furniture has been in business for over two decades and has a good reputation. However, during the past five years, Beauville experienced eroding profits and declining sales. Bids were increasingly lost (even aggressive bids) on the more popular models. Yet, the company was winning bids on some of the more-difficult-to-produce items. Lance Hays, the owner and manager, was frustrated. He simply couldn't understand how some of his competitors could sell for such low prices. On a common sofa job involving 500 units, Beauville's bids were running $25 per unit, or $12,500 per job more than the winning bids (on average). Yet, on the more difficult items, Beauville's bids were running about $60 per unit less than the next closest bid. Gisela Berling, vice president of finance, was assigned the task of preparing a cost analysis of the company's product lines. Lance wanted to know if the company's costs were excessive. Perhaps the company was being wasteful, and it was simply costing more to produce furniture than it was costing its competitors.
Gisela prepared herself by reading recent literature on cost management and product costing and attending several conferences that explored the same issues. She then reviewed the costing procedures of the company's mill and two plants and did a preliminary assessment of their soundness. The production costs of the mill were common to all lumber grades and were assigned using the physical units method. Since the output and production costs were fairly uniform throughout the year, the mill used an actual costing system. Although Gisela had no difficulty with actual costing, she decided to explore the effects of using the sales-value-at-split-off method. Thus, cost and production data for the mill were gathered so that an analysis could be conducted. The two plants used normal costing systems. The fabric plant used process costing, and the furniture plant used job-order costing. Both plants used plantwide overhead rates based on direct labor hours. Based on her initial reviews, she concluded that the costing procedures for the fabric plant were satisfactory. Essentially, there was no evidence of product diversity. A statistical analysis revealed that about 90 percent of the variability in the plant's overhead cost could be explained by direct labor hours. Thus, the use of a plantwide overhead rate based on direct labor hours seemed justified. What did concern her, though, was the material waste that she observed in the plant. Maybe a standard cost system would be useful for increasing the overall cost efficiency of the plant. Consequently, as part of her report to Lance, she decided to include a description of the fabric plant's costing procedures-at least for one of the fabric types. She also decided to develop a standard cost sheet for the chosen fabric. The furniture plant, however, was a more difficult matter. Product diversity was present and could be causing some distortions in product costs. Furthermore, statistical analysis revealed that only about 40 percent of the variability in overhead cost was explained by the direct labor hours. She decided that additional analysis was needed so that a sound product costing method could be recommended. One possibility would be to increase the number of overhead rates. Thus, she decided to include departmental data so that the effect of moving to departmental rates could be assessed. Finally, she also wanted to explore the possibility of converting the sawmill and fabric plant into profit centers and changing the existing transfer pricing policy.
With the cooperation of the cost accounting manager for the mill and each plant's controller, she gathered the following data for last year:
Sawmill:
Joint manufacturing costs: $900,000

Fabric Plant:
Budgeted overhead: $1,200,000 (50% fixed)
Practical volume (direct labor hours): 120,000 hours
Actual overhead: $1,150,000 (50% fixed)
Actual hours worked:

Departmental data on Fabric FB70 (actual costs and actual outcomes):


*Unitsare measured in yards for the Weaving and Pattern Department and in bolts forthe Coloring and Bolting Department. Note: With the exception of the cardboard bolt rods, materials are added at the beginning of each process. The cost of the rods is relatively insignificant and is included in overhead.
Proposed standard cost sheet for Fabric FB70 (for the Coloring and Bolting Department only):

Furniture Plant:
Departmental data (budgeted):

After some discussion with the furniture plant controller, Gisela decided to use machine hours to calculate the overhead rate for the Cutting Department and direct labor hours for the Assembly Department rate (the Cutting Department was more automated than the Assembly Department). As part of her report, she wanted to compare the effects of plantwide rates and departmental rates on the cost of jobs. She wanted to know if overhead costing could be the source of the pricing problems the company was experiencing.
To assess the effect of the different overhead assignment procedures, Gisela decided to examine two prospective jobs. One job, Job A500, could produce 500 sofas, using a frequently requested style and Fabric FB70. Bids on this type of job were being lost more frequently to competitors. The second job, Job B75, would produce 75 specially designed recliners. This job involved a new design and was more difficult for the workers to build. It involved some special cutting requirements and an unfamiliar assembly. Recently, the company seemed to be winning more bids on jobs of this type. To compute the costs of the two jobs, Gisela assembled the following information on the two jobs:
Job A500:

Job B75:

Required
Assume that the standard hours allowed for the actual total output of the fabric plant are 115,000. Calculate the following variances:
a. Fixed overhead spending variance
b. Fixed overhead volume variance
c. Variable overhead spending variance
d. Variable overhead efficiency variance
The sawmill buys logs from independent producers. The sawmill then processes the logs into four grades of lumber: firsts and seconds, No. 1 common, No. 2 common, and No. 3 common. All costs incurred in the mill are common to the four grades of lumber. All four grades of lumber are used by the furniture plant. The mill transfers everything it produces to the furniture plant, and the grades are transferred at cost. Trucks are used to move the lumber from the mill to the furniture plant. Although no outside sales exist, the mill could sell to external customers, and the selling prices of the four grades are known.
The fabric plant is responsible for producing the fabric that is used by the furniture plant. To produce three totally different fabrics (identified by fabric ID codes FB60, FB70, and FB80, respectively), the plant has three separate production operations-one for each fabric. Thus, production of all three fabrics occurs at the same time in different locations in the plant. Each fabric's production operation has two processes: the weaving and pattern process and the coloring and bolting process. In the weaving and pattern process, yarn is used to create yards of fabric with different designs. In the next process, the fabric is dyed, cut into 25-yard sections, and wrapped around cardboard rods to form 25-yard bolts. The bolts are transported by forklift to the furniture plant's Receiving Department. All of the output of the fabric plant is used by the furniture plant (to produce the sofas and chairs). For accounting purposes, the fabric is transferred at cost to the furniture plant.
The furniture plant produces orders for customers on a special-order basis. The customers specify the quantity, style, fabric, lumber grade, and pattern. Typically, jobs are large (involving at least 500 units). The plant has two production departments: Cutting and Assembly. In the Cutting Department, the fabric and wooden frame components are sized and cut. Other components are purchased from external suppliers and are removed from stores as needed for assembly. After the fabric and wooden components are finished for the entire job, they are moved to the Assembly Department. The Assembly Department takes the individual components and assembles the sofas (or chairs).
Beauville Furniture has been in business for over two decades and has a good reputation. However, during the past five years, Beauville experienced eroding profits and declining sales. Bids were increasingly lost (even aggressive bids) on the more popular models. Yet, the company was winning bids on some of the more-difficult-to-produce items. Lance Hays, the owner and manager, was frustrated. He simply couldn't understand how some of his competitors could sell for such low prices. On a common sofa job involving 500 units, Beauville's bids were running $25 per unit, or $12,500 per job more than the winning bids (on average). Yet, on the more difficult items, Beauville's bids were running about $60 per unit less than the next closest bid. Gisela Berling, vice president of finance, was assigned the task of preparing a cost analysis of the company's product lines. Lance wanted to know if the company's costs were excessive. Perhaps the company was being wasteful, and it was simply costing more to produce furniture than it was costing its competitors.
Gisela prepared herself by reading recent literature on cost management and product costing and attending several conferences that explored the same issues. She then reviewed the costing procedures of the company's mill and two plants and did a preliminary assessment of their soundness. The production costs of the mill were common to all lumber grades and were assigned using the physical units method. Since the output and production costs were fairly uniform throughout the year, the mill used an actual costing system. Although Gisela had no difficulty with actual costing, she decided to explore the effects of using the sales-value-at-split-off method. Thus, cost and production data for the mill were gathered so that an analysis could be conducted. The two plants used normal costing systems. The fabric plant used process costing, and the furniture plant used job-order costing. Both plants used plantwide overhead rates based on direct labor hours. Based on her initial reviews, she concluded that the costing procedures for the fabric plant were satisfactory. Essentially, there was no evidence of product diversity. A statistical analysis revealed that about 90 percent of the variability in the plant's overhead cost could be explained by direct labor hours. Thus, the use of a plantwide overhead rate based on direct labor hours seemed justified. What did concern her, though, was the material waste that she observed in the plant. Maybe a standard cost system would be useful for increasing the overall cost efficiency of the plant. Consequently, as part of her report to Lance, she decided to include a description of the fabric plant's costing procedures-at least for one of the fabric types. She also decided to develop a standard cost sheet for the chosen fabric. The furniture plant, however, was a more difficult matter. Product diversity was present and could be causing some distortions in product costs. Furthermore, statistical analysis revealed that only about 40 percent of the variability in overhead cost was explained by the direct labor hours. She decided that additional analysis was needed so that a sound product costing method could be recommended. One possibility would be to increase the number of overhead rates. Thus, she decided to include departmental data so that the effect of moving to departmental rates could be assessed. Finally, she also wanted to explore the possibility of converting the sawmill and fabric plant into profit centers and changing the existing transfer pricing policy.
With the cooperation of the cost accounting manager for the mill and each plant's controller, she gathered the following data for last year:
Sawmill:
Joint manufacturing costs: $900,000
Fabric Plant:
Budgeted overhead: $1,200,000 (50% fixed)
Practical volume (direct labor hours): 120,000 hours
Actual overhead: $1,150,000 (50% fixed)
Actual hours worked:
Departmental data on Fabric FB70 (actual costs and actual outcomes):
*Unitsare measured in yards for the Weaving and Pattern Department and in bolts forthe Coloring and Bolting Department. Note: With the exception of the cardboard bolt rods, materials are added at the beginning of each process. The cost of the rods is relatively insignificant and is included in overhead.
Proposed standard cost sheet for Fabric FB70 (for the Coloring and Bolting Department only):
Furniture Plant:
Departmental data (budgeted):
After some discussion with the furniture plant controller, Gisela decided to use machine hours to calculate the overhead rate for the Cutting Department and direct labor hours for the Assembly Department rate (the Cutting Department was more automated than the Assembly Department). As part of her report, she wanted to compare the effects of plantwide rates and departmental rates on the cost of jobs. She wanted to know if overhead costing could be the source of the pricing problems the company was experiencing.
To assess the effect of the different overhead assignment procedures, Gisela decided to examine two prospective jobs. One job, Job A500, could produce 500 sofas, using a frequently requested style and Fabric FB70. Bids on this type of job were being lost more frequently to competitors. The second job, Job B75, would produce 75 specially designed recliners. This job involved a new design and was more difficult for the workers to build. It involved some special cutting requirements and an unfamiliar assembly. Recently, the company seemed to be winning more bids on jobs of this type. To compute the costs of the two jobs, Gisela assembled the following information on the two jobs:
Job A500:
Job B75:
Required
Assume that the standard hours allowed for the actual total output of the fabric plant are 115,000. Calculate the following variances:
a. Fixed overhead spending variance
b. Fixed overhead volume variance
c. Variable overhead spending variance
d. Variable overhead efficiency variance
Question
CableTech Bell Corporation (CTB) operates in the telecommunications industry. CTB has two divisions: the Phone Division and the Cable Service Division. The Phone Division manufactures telephones in several plants located in the Midwest. The product lines run from relatively inexpensive touch-tone wall and desk phones to expensive, high-quality cellular phones. CTB also operates a cable TV service in Ohio. The Cable Service Division offers three products: a basic package with 25 channels; an enhanced package, which is the basic package plus 15 additional channels and two movie channels; and a premium package, which is the basic package plus 25 additional channels and three movie channels.
The Cable Service Division reported the following activity for the month of March:

The unit costs are divided as follows: 70 percent production and 30 percent marketing and customer service. Direct labor cost is the only driver used for tracing. Typically, the division uses only production costs to define unit costs. The preceding unit product cost information was provided at the request of the marketing manager and was the result of a special study.
Bryce Youngers, the president of CTB, is reasonably satisfied with the performance of the Cable Service Division. March's performance is fairly typical of what has been happening over the past two years. The Phone Division, however, is another matter. Its overall profit performance has been declining. Two years ago, income before income taxes had been about 25 percent of sales. March's dismal performance was also typical for what has been happening this year and is expected to continue-unless some action by management is taken to reverse the trend. During March, the Phone Division reported the following results:


During March, the Phone Division purchased materials totaling $312,000. There are no significant inventories of supplies (beginning or ending). Supplies are accounted for separately from materials. CTB's Phone Division had sales totaling $1,170,000 for March.
Based on March's results, Bryce decided to meet with three of the Phone Division's managers: Kim Breashears, divisional manager; Jacob Carder, divisional controller; and Larry Hartley, sales manager. A transcript of their recorded conversation is given next:
Bryce: "March's profit performance is down once again, and I think we need to see if we can identify the problem and correct it-before it's too late. Kim, what's your assessment of the situation?"
Kim: "Foreign competition is eating us alive. They are coming in with lower-priced phones of comparable or higher quality than our own. I've talked with several of the retailers that carry our lines, and they say the same. They are convinced that we can sell more if we lower our prices."
Larry: "They're right. If we could lower our prices by 10 to 15 percent, I think that we'd regain most ofour lost market share. But we also need to make sure that the quality of our products meets that of our competitors. As you know, we are spending a lot of money each month on rework and warranties. That worries me. I'd like to see that warranty cost cut by 70 to 80 percent. If we could do that, then customers would be more satisfied with our products, and I bet that we would not only regain our market share but increase it."
Jacob: "Lowering prices without lowering per-unit costs will not help us increase our profitability.
I think we need to improve our cost accounting system. I am not confident that we really know how much each of our product lines is costing us. It may be that we are overpricing some of our units because we are overcosting them. We may be underpricing other units."
Larry: "This sounds promising-especially if the overcosting is for some of our high-volume lines. A price decrease for these products would make the biggest difference-and if we knew they were overcosted, then we could offer immediate price reductions."
Bryce: "Jacob, I need more explanation. We have been using the same cost accounting system for the last 10 years. Why would it be a problem?"
Jacob: "I think that our manufacturing environment has changed. Over the years, we have added a lot of different product lines. Some of these products make very different demands on our manufacturing overhead resources. We trace-or attempt to trace-overhead costs to the different products using direct labor cost, a unit-based cost driver. We may be doing more allocation than tracing. If so, then we probably don't have a very good idea of our actual product costs. Also, as you know, with the way computer technology has changed over time, it is easier and cheaper to collect and use detailed information-information that will allow us to assign costs more accurately."
Bryce: "This may be something we should explore. Jacob, what do you suggest?"
Jacob: "If we want more accurate product costs and if we really want to get in the cost reduction business, then we need to understand how costs behave. In particular, we need to understand activity cost behavior. Knowing what activities we perform, why we perform them, and how well we perform them will help us identify areas for improvement. We also need to know how the different products consume activity resources. What this boils down to is the need to use an activity-based management system. But before we jump into this, we need some idea of whether non-unit-based drivers add anything. Activity-based management is not an inexpensive undertaking. So I suggest that we do a preliminary study to see if direct labor cost is adequate for tracing. If not, then maybe some non-unit-drivers might be needed. In fact, if you would like,
I can gather some data that will provide some evidence on the usefulness of the activity-based approach."
Bryce: "What do you think, Kim? It's your division."
Kim: "What Jacob has said sounds promising. I think he should pursue it and do so quickly. I also think that we need to look at improving our quality. It sounds like we have a problem there. If quality could be improved, then our costs will drop. I'll talk to our quality people. Jacob, in the meantime, find out for us if moving to an activity-based system is the way to go. How much time do you need?"
Jacob: "I have already been gathering data. I could probably have a report within two weeks."

Based on my initial analysis, I am confident that an ABC system will offer significant improvement. For one of our conventional phone plants, I regressed total monthly overhead cost on monthly direct labor cost using the following 15 months of data:

The results were revealing. Although direct labor cost appears to be a driver of overhead cost, it really doesn't explain a lot of the variation. I then searched for other drivers-particularly non-unit drivers-that might offer more insight into overhead cost behavior. Every time a batch is produced, material movement occurs, regardless of the size of the batch. The number of moves seemed like a more logical driver. I was able to gather only 10 months of data for this. (Our information system doesn't provide the number of moves, so I had to build the data set by interviewing production personnel.) This information is provided next:

The regression results were impressive. There is no question in my mind that the number of moves is a good driver of materials-handling costs. Using the number of moves to assign materials-handling costs to products would likely be better than the cost assignment using direct labor cost. Furthermore, since small batches use the same number of moves as large batches, we have some evidence that we may be overcosting our high-volume products.
I looked at one more overhead activity: inspecting products. We have 15 inspectors who are paid an average of $4,000 per month. Each inspector offers about 160 hours of inspection capacity per month. However, it appears that they actually work only about 80 percent of those hours. The drop in demand we have experienced explains this idle time. I see no evidence of variable cost behavior here. I'm not exactly sure how to treat inspection cost, but I think that it is more related to inspection hours than direct labor cost. Some of the other overhead activities seem to be non-unit-level, as well-enough, in fact, to be concerned about how we assign costs.
After receiving the memo, Kim was intrigued. She then asked Jacob to use the same phone plant as a pilot for a preliminary ABC analysis. She instructed him to assign all overhead costs to the plant's two products (Regular and Deluxe models), using only four activities. The four activities were rework, moving materials, inspecting products, and a general catch-all activity labeled "other manufacturing activities." From the special study already performed, she knew that materials handling and inspecting involved significant cost; from production reports, she also knew that the rework activity involved significant cost. If the ABC and unit-based cost assignments did not differ by breaking out these three major activities, then ABC may not matter.
Pursuant to the request, Jacob produced the following cost and driver information:

Expected activity demands:

Required
Discuss the differences between the Cable Service Division's products and the Phone Division's products.
The Cable Service Division reported the following activity for the month of March:
The unit costs are divided as follows: 70 percent production and 30 percent marketing and customer service. Direct labor cost is the only driver used for tracing. Typically, the division uses only production costs to define unit costs. The preceding unit product cost information was provided at the request of the marketing manager and was the result of a special study.
Bryce Youngers, the president of CTB, is reasonably satisfied with the performance of the Cable Service Division. March's performance is fairly typical of what has been happening over the past two years. The Phone Division, however, is another matter. Its overall profit performance has been declining. Two years ago, income before income taxes had been about 25 percent of sales. March's dismal performance was also typical for what has been happening this year and is expected to continue-unless some action by management is taken to reverse the trend. During March, the Phone Division reported the following results:
During March, the Phone Division purchased materials totaling $312,000. There are no significant inventories of supplies (beginning or ending). Supplies are accounted for separately from materials. CTB's Phone Division had sales totaling $1,170,000 for March.
Based on March's results, Bryce decided to meet with three of the Phone Division's managers: Kim Breashears, divisional manager; Jacob Carder, divisional controller; and Larry Hartley, sales manager. A transcript of their recorded conversation is given next:
Bryce: "March's profit performance is down once again, and I think we need to see if we can identify the problem and correct it-before it's too late. Kim, what's your assessment of the situation?"
Kim: "Foreign competition is eating us alive. They are coming in with lower-priced phones of comparable or higher quality than our own. I've talked with several of the retailers that carry our lines, and they say the same. They are convinced that we can sell more if we lower our prices."
Larry: "They're right. If we could lower our prices by 10 to 15 percent, I think that we'd regain most ofour lost market share. But we also need to make sure that the quality of our products meets that of our competitors. As you know, we are spending a lot of money each month on rework and warranties. That worries me. I'd like to see that warranty cost cut by 70 to 80 percent. If we could do that, then customers would be more satisfied with our products, and I bet that we would not only regain our market share but increase it."
Jacob: "Lowering prices without lowering per-unit costs will not help us increase our profitability.
I think we need to improve our cost accounting system. I am not confident that we really know how much each of our product lines is costing us. It may be that we are overpricing some of our units because we are overcosting them. We may be underpricing other units."
Larry: "This sounds promising-especially if the overcosting is for some of our high-volume lines. A price decrease for these products would make the biggest difference-and if we knew they were overcosted, then we could offer immediate price reductions."
Bryce: "Jacob, I need more explanation. We have been using the same cost accounting system for the last 10 years. Why would it be a problem?"
Jacob: "I think that our manufacturing environment has changed. Over the years, we have added a lot of different product lines. Some of these products make very different demands on our manufacturing overhead resources. We trace-or attempt to trace-overhead costs to the different products using direct labor cost, a unit-based cost driver. We may be doing more allocation than tracing. If so, then we probably don't have a very good idea of our actual product costs. Also, as you know, with the way computer technology has changed over time, it is easier and cheaper to collect and use detailed information-information that will allow us to assign costs more accurately."
Bryce: "This may be something we should explore. Jacob, what do you suggest?"
Jacob: "If we want more accurate product costs and if we really want to get in the cost reduction business, then we need to understand how costs behave. In particular, we need to understand activity cost behavior. Knowing what activities we perform, why we perform them, and how well we perform them will help us identify areas for improvement. We also need to know how the different products consume activity resources. What this boils down to is the need to use an activity-based management system. But before we jump into this, we need some idea of whether non-unit-based drivers add anything. Activity-based management is not an inexpensive undertaking. So I suggest that we do a preliminary study to see if direct labor cost is adequate for tracing. If not, then maybe some non-unit-drivers might be needed. In fact, if you would like,
I can gather some data that will provide some evidence on the usefulness of the activity-based approach."
Bryce: "What do you think, Kim? It's your division."
Kim: "What Jacob has said sounds promising. I think he should pursue it and do so quickly. I also think that we need to look at improving our quality. It sounds like we have a problem there. If quality could be improved, then our costs will drop. I'll talk to our quality people. Jacob, in the meantime, find out for us if moving to an activity-based system is the way to go. How much time do you need?"
Jacob: "I have already been gathering data. I could probably have a report within two weeks."
Based on my initial analysis, I am confident that an ABC system will offer significant improvement. For one of our conventional phone plants, I regressed total monthly overhead cost on monthly direct labor cost using the following 15 months of data:
The results were revealing. Although direct labor cost appears to be a driver of overhead cost, it really doesn't explain a lot of the variation. I then searched for other drivers-particularly non-unit drivers-that might offer more insight into overhead cost behavior. Every time a batch is produced, material movement occurs, regardless of the size of the batch. The number of moves seemed like a more logical driver. I was able to gather only 10 months of data for this. (Our information system doesn't provide the number of moves, so I had to build the data set by interviewing production personnel.) This information is provided next:
The regression results were impressive. There is no question in my mind that the number of moves is a good driver of materials-handling costs. Using the number of moves to assign materials-handling costs to products would likely be better than the cost assignment using direct labor cost. Furthermore, since small batches use the same number of moves as large batches, we have some evidence that we may be overcosting our high-volume products.
I looked at one more overhead activity: inspecting products. We have 15 inspectors who are paid an average of $4,000 per month. Each inspector offers about 160 hours of inspection capacity per month. However, it appears that they actually work only about 80 percent of those hours. The drop in demand we have experienced explains this idle time. I see no evidence of variable cost behavior here. I'm not exactly sure how to treat inspection cost, but I think that it is more related to inspection hours than direct labor cost. Some of the other overhead activities seem to be non-unit-level, as well-enough, in fact, to be concerned about how we assign costs.
After receiving the memo, Kim was intrigued. She then asked Jacob to use the same phone plant as a pilot for a preliminary ABC analysis. She instructed him to assign all overhead costs to the plant's two products (Regular and Deluxe models), using only four activities. The four activities were rework, moving materials, inspecting products, and a general catch-all activity labeled "other manufacturing activities." From the special study already performed, she knew that materials handling and inspecting involved significant cost; from production reports, she also knew that the rework activity involved significant cost. If the ABC and unit-based cost assignments did not differ by breaking out these three major activities, then ABC may not matter.
Pursuant to the request, Jacob produced the following cost and driver information:
Expected activity demands:
Required
Discuss the differences between the Cable Service Division's products and the Phone Division's products.
Question
Beauville Furniture Corporation produces sofas, recliners, and lounge chairs. Beauville is located in a medium-sized community in the southeastern part of the United States. It is a major employer in the community. In fact, the economic well-being of the community is tied very strongly to Beauville. Beauville operates a sawmill, a fabric plant, and a furniture plant in the same community.
The sawmill buys logs from independent producers. The sawmill then processes the logs into four grades of lumber: firsts and seconds, No. 1 common, No. 2 common, and No. 3 common. All costs incurred in the mill are common to the four grades of lumber. All four grades of lumber are used by the furniture plant. The mill transfers everything it produces to the furniture plant, and the grades are transferred at cost. Trucks are used to move the lumber from the mill to the furniture plant. Although no outside sales exist, the mill could sell to external customers, and the selling prices of the four grades are known.
The fabric plant is responsible for producing the fabric that is used by the furniture plant. To produce three totally different fabrics (identified by fabric ID codes FB60, FB70, and FB80, respectively), the plant has three separate production operations-one for each fabric. Thus, production of all three fabrics occurs at the same time in different locations in the plant. Each fabric's production operation has two processes: the weaving and pattern process and the coloring and bolting process. In the weaving and pattern process, yarn is used to create yards of fabric with different designs. In the next process, the fabric is dyed, cut into 25-yard sections, and wrapped around cardboard rods to form 25-yard bolts. The bolts are transported by forklift to the furniture plant's Receiving Department. All of the output of the fabric plant is used by the furniture plant (to produce the sofas and chairs). For accounting purposes, the fabric is transferred at cost to the furniture plant.
The furniture plant produces orders for customers on a special-order basis. The customers specify the quantity, style, fabric, lumber grade, and pattern. Typically, jobs are large (involving at least 500 units). The plant has two production departments: Cutting and Assembly. In the Cutting Department, the fabric and wooden frame components are sized and cut. Other components are purchased from external suppliers and are removed from stores as needed for assembly. After the fabric and wooden components are finished for the entire job, they are moved to the Assembly Department. The Assembly Department takes the individual components and assembles the sofas (or chairs).
Beauville Furniture has been in business for over two decades and has a good reputation. However, during the past five years, Beauville experienced eroding profits and declining sales. Bids were increasingly lost (even aggressive bids) on the more popular models. Yet, the company was winning bids on some of the more-difficult-to-produce items. Lance Hays, the owner and manager, was frustrated. He simply couldn't understand how some of his competitors could sell for such low prices. On a common sofa job involving 500 units, Beauville's bids were running $25 per unit, or $12,500 per job more than the winning bids (on average). Yet, on the more difficult items, Beauville's bids were running about $60 per unit less than the next closest bid. Gisela Berling, vice president of finance, was assigned the task of preparing a cost analysis of the company's product lines. Lance wanted to know if the company's costs were excessive. Perhaps the company was being wasteful, and it was simply costing more to produce furniture than it was costing its competitors.
Gisela prepared herself by reading recent literature on cost management and product costing and attending several conferences that explored the same issues. She then reviewed the costing procedures of the company's mill and two plants and did a preliminary assessment of their soundness. The production costs of the mill were common to all lumber grades and were assigned using the physical units method. Since the output and production costs were fairly uniform throughout the year, the mill used an actual costing system. Although Gisela had no difficulty with actual costing, she decided to explore the effects of using the sales-value-at-split-off method. Thus, cost and production data for the mill were gathered so that an analysis could be conducted. The two plants used normal costing systems. The fabric plant used process costing, and the furniture plant used job-order costing. Both plants used plantwide overhead rates based on direct labor hours. Based on her initial reviews, she concluded that the costing procedures for the fabric plant were satisfactory. Essentially, there was no evidence of product diversity. A statistical analysis revealed that about 90 percent of the variability in the plant's overhead cost could be explained by direct labor hours. Thus, the use of a plantwide overhead rate based on direct labor hours seemed justified. What did concern her, though, was the material waste that she observed in the plant. Maybe a standard cost system would be useful for increasing the overall cost efficiency of the plant. Consequently, as part of her report to Lance, she decided to include a description of the fabric plant's costing procedures-at least for one of the fabric types. She also decided to develop a standard cost sheet for the chosen fabric. The furniture plant, however, was a more difficult matter. Product diversity was present and could be causing some distortions in product costs. Furthermore, statistical analysis revealed that only about 40 percent of the variability in overhead cost was explained by the direct labor hours. She decided that additional analysis was needed so that a sound product costing method could be recommended. One possibility would be to increase the number of overhead rates. Thus, she decided to include departmental data so that the effect of moving to departmental rates could be assessed. Finally, she also wanted to explore the possibility of converting the sawmill and fabric plant into profit centers and changing the existing transfer pricing policy.
With the cooperation of the cost accounting manager for the mill and each plant's controller, she gathered the following data for last year:
Sawmill:
Joint manufacturing costs: $900,000

Fabric Plant:
Budgeted overhead: $1,200,000 (50% fixed)
Practical volume (direct labor hours): 120,000 hours
Actual overhead: $1,150,000 (50% fixed)
Actual hours worked:

Departmental data on Fabric FB70 (actual costs and actual outcomes):


*Unitsare measured in yards for the Weaving and Pattern Department and in bolts forthe Coloring and Bolting Department. Note: With the exception of the cardboard bolt rods, materials are added at the beginning of each process. The cost of the rods is relatively insignificant and is included in overhead.
Proposed standard cost sheet for Fabric FB70 (for the Coloring and Bolting Department only):

Furniture Plant:
Departmental data (budgeted):

After some discussion with the furniture plant controller, Gisela decided to use machine hours to calculate the overhead rate for the Cutting Department and direct labor hours for the Assembly Department rate (the Cutting Department was more automated than the Assembly Department). As part of her report, she wanted to compare the effects of plantwide rates and departmental rates on the cost of jobs. She wanted to know if overhead costing could be the source of the pricing problems the company was experiencing.
To assess the effect of the different overhead assignment procedures, Gisela decided to examine two prospective jobs. One job, Job A500, could produce 500 sofas, using a frequently requested style and Fabric FB70. Bids on this type of job were being lost more frequently to competitors. The second job, Job B75, would produce 75 specially designed recliners. This job involved a new design and was more difficult for the workers to build. It involved some special cutting requirements and an unfamiliar assembly. Recently, the company seemed to be winning more bids on jobs of this type. To compute the costs of the two jobs, Gisela assembled the following information on the two jobs:
Job A500:

Job B75:

Required
Suppose that the fabric plant has 500 bolts of FB70 in beginning finished goods inventory. The current-year plan is to have 1,000 bolts of FB70 in finished goods inventory at the end of the year. This fabric has an external market price of $400 per bolt. If the fabric plant is set up as a profit center, it could sell 3,000 bolts per year to outside customers and supply 2,000 bolts per year internally to Beauville's furniture plant. If the fabric plant were designated as a profit center, the plant would transfer all goods internally at market price. Using the proposed standard cost sheet (as needed) and any other relevant data, prepare the following for Fabric FB70:
a. Sales budget
b. Production budget
c. Direct labor budget
d. Cost of goods sold budget
The sawmill buys logs from independent producers. The sawmill then processes the logs into four grades of lumber: firsts and seconds, No. 1 common, No. 2 common, and No. 3 common. All costs incurred in the mill are common to the four grades of lumber. All four grades of lumber are used by the furniture plant. The mill transfers everything it produces to the furniture plant, and the grades are transferred at cost. Trucks are used to move the lumber from the mill to the furniture plant. Although no outside sales exist, the mill could sell to external customers, and the selling prices of the four grades are known.
The fabric plant is responsible for producing the fabric that is used by the furniture plant. To produce three totally different fabrics (identified by fabric ID codes FB60, FB70, and FB80, respectively), the plant has three separate production operations-one for each fabric. Thus, production of all three fabrics occurs at the same time in different locations in the plant. Each fabric's production operation has two processes: the weaving and pattern process and the coloring and bolting process. In the weaving and pattern process, yarn is used to create yards of fabric with different designs. In the next process, the fabric is dyed, cut into 25-yard sections, and wrapped around cardboard rods to form 25-yard bolts. The bolts are transported by forklift to the furniture plant's Receiving Department. All of the output of the fabric plant is used by the furniture plant (to produce the sofas and chairs). For accounting purposes, the fabric is transferred at cost to the furniture plant.
The furniture plant produces orders for customers on a special-order basis. The customers specify the quantity, style, fabric, lumber grade, and pattern. Typically, jobs are large (involving at least 500 units). The plant has two production departments: Cutting and Assembly. In the Cutting Department, the fabric and wooden frame components are sized and cut. Other components are purchased from external suppliers and are removed from stores as needed for assembly. After the fabric and wooden components are finished for the entire job, they are moved to the Assembly Department. The Assembly Department takes the individual components and assembles the sofas (or chairs).
Beauville Furniture has been in business for over two decades and has a good reputation. However, during the past five years, Beauville experienced eroding profits and declining sales. Bids were increasingly lost (even aggressive bids) on the more popular models. Yet, the company was winning bids on some of the more-difficult-to-produce items. Lance Hays, the owner and manager, was frustrated. He simply couldn't understand how some of his competitors could sell for such low prices. On a common sofa job involving 500 units, Beauville's bids were running $25 per unit, or $12,500 per job more than the winning bids (on average). Yet, on the more difficult items, Beauville's bids were running about $60 per unit less than the next closest bid. Gisela Berling, vice president of finance, was assigned the task of preparing a cost analysis of the company's product lines. Lance wanted to know if the company's costs were excessive. Perhaps the company was being wasteful, and it was simply costing more to produce furniture than it was costing its competitors.
Gisela prepared herself by reading recent literature on cost management and product costing and attending several conferences that explored the same issues. She then reviewed the costing procedures of the company's mill and two plants and did a preliminary assessment of their soundness. The production costs of the mill were common to all lumber grades and were assigned using the physical units method. Since the output and production costs were fairly uniform throughout the year, the mill used an actual costing system. Although Gisela had no difficulty with actual costing, she decided to explore the effects of using the sales-value-at-split-off method. Thus, cost and production data for the mill were gathered so that an analysis could be conducted. The two plants used normal costing systems. The fabric plant used process costing, and the furniture plant used job-order costing. Both plants used plantwide overhead rates based on direct labor hours. Based on her initial reviews, she concluded that the costing procedures for the fabric plant were satisfactory. Essentially, there was no evidence of product diversity. A statistical analysis revealed that about 90 percent of the variability in the plant's overhead cost could be explained by direct labor hours. Thus, the use of a plantwide overhead rate based on direct labor hours seemed justified. What did concern her, though, was the material waste that she observed in the plant. Maybe a standard cost system would be useful for increasing the overall cost efficiency of the plant. Consequently, as part of her report to Lance, she decided to include a description of the fabric plant's costing procedures-at least for one of the fabric types. She also decided to develop a standard cost sheet for the chosen fabric. The furniture plant, however, was a more difficult matter. Product diversity was present and could be causing some distortions in product costs. Furthermore, statistical analysis revealed that only about 40 percent of the variability in overhead cost was explained by the direct labor hours. She decided that additional analysis was needed so that a sound product costing method could be recommended. One possibility would be to increase the number of overhead rates. Thus, she decided to include departmental data so that the effect of moving to departmental rates could be assessed. Finally, she also wanted to explore the possibility of converting the sawmill and fabric plant into profit centers and changing the existing transfer pricing policy.
With the cooperation of the cost accounting manager for the mill and each plant's controller, she gathered the following data for last year:
Sawmill:
Joint manufacturing costs: $900,000
Fabric Plant:
Budgeted overhead: $1,200,000 (50% fixed)
Practical volume (direct labor hours): 120,000 hours
Actual overhead: $1,150,000 (50% fixed)
Actual hours worked:
Departmental data on Fabric FB70 (actual costs and actual outcomes):
*Unitsare measured in yards for the Weaving and Pattern Department and in bolts forthe Coloring and Bolting Department. Note: With the exception of the cardboard bolt rods, materials are added at the beginning of each process. The cost of the rods is relatively insignificant and is included in overhead.
Proposed standard cost sheet for Fabric FB70 (for the Coloring and Bolting Department only):
Furniture Plant:
Departmental data (budgeted):
After some discussion with the furniture plant controller, Gisela decided to use machine hours to calculate the overhead rate for the Cutting Department and direct labor hours for the Assembly Department rate (the Cutting Department was more automated than the Assembly Department). As part of her report, she wanted to compare the effects of plantwide rates and departmental rates on the cost of jobs. She wanted to know if overhead costing could be the source of the pricing problems the company was experiencing.
To assess the effect of the different overhead assignment procedures, Gisela decided to examine two prospective jobs. One job, Job A500, could produce 500 sofas, using a frequently requested style and Fabric FB70. Bids on this type of job were being lost more frequently to competitors. The second job, Job B75, would produce 75 specially designed recliners. This job involved a new design and was more difficult for the workers to build. It involved some special cutting requirements and an unfamiliar assembly. Recently, the company seemed to be winning more bids on jobs of this type. To compute the costs of the two jobs, Gisela assembled the following information on the two jobs:
Job A500:
Job B75:
Required
Suppose that the fabric plant has 500 bolts of FB70 in beginning finished goods inventory. The current-year plan is to have 1,000 bolts of FB70 in finished goods inventory at the end of the year. This fabric has an external market price of $400 per bolt. If the fabric plant is set up as a profit center, it could sell 3,000 bolts per year to outside customers and supply 2,000 bolts per year internally to Beauville's furniture plant. If the fabric plant were designated as a profit center, the plant would transfer all goods internally at market price. Using the proposed standard cost sheet (as needed) and any other relevant data, prepare the following for Fabric FB70:
a. Sales budget
b. Production budget
c. Direct labor budget
d. Cost of goods sold budget
Question
CableTech Bell Corporation (CTB) operates in the telecommunications industry. CTB has two divisions: the Phone Division and the Cable Service Division. The Phone Division manufactures telephones in several plants located in the Midwest. The product lines run from relatively inexpensive touch-tone wall and desk phones to expensive, high-quality cellular phones. CTB also operates a cable TV service in Ohio. The Cable Service Division offers three products: a basic package with 25 channels; an enhanced package, which is the basic package plus 15 additional channels and two movie channels; and a premium package, which is the basic package plus 25 additional channels and three movie channels.
The Cable Service Division reported the following activity for the month of March:

The unit costs are divided as follows: 70 percent production and 30 percent marketing and customer service. Direct labor cost is the only driver used for tracing. Typically, the division uses only production costs to define unit costs. The preceding unit product cost information was provided at the request of the marketing manager and was the result of a special study.
Bryce Youngers, the president of CTB, is reasonably satisfied with the performance of the Cable Service Division. March's performance is fairly typical of what has been happening over the past two years. The Phone Division, however, is another matter. Its overall profit performance has been declining. Two years ago, income before income taxes had been about 25 percent of sales. March's dismal performance was also typical for what has been happening this year and is expected to continue-unless some action by management is taken to reverse the trend. During March, the Phone Division reported the following results:

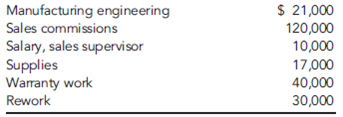
During March, the Phone Division purchased materials totaling $312,000. There are no significant inventories of supplies (beginning or ending). Supplies are accounted for separately from materials. CTB's Phone Division had sales totaling $1,170,000 for March.
Based on March's results, Bryce decided to meet with three of the Phone Division's managers: Kim Breashears, divisional manager; Jacob Carder, divisional controller; and Larry Hartley, sales manager. A transcript of their recorded conversation is given next:
Bryce: "March's profit performance is down once again, and I think we need to see if we can identify the problem and correct it-before it's too late. Kim, what's your assessment of the situation?"
Kim: "Foreign competition is eating us alive. They are coming in with lower-priced phones of comparable or higher quality than our own. I've talked with several of the retailers that carry our lines, and they say the same. They are convinced that we can sell more if we lower our prices."
Larry: "They're right. If we could lower our prices by 10 to 15 percent, I think that we'd regain most ofour lost market share. But we also need to make sure that the quality of our products meets that of our competitors. As you know, we are spending a lot of money each month on rework and warranties. That worries me. I'd like to see that warranty cost cut by 70 to 80 percent. If we could do that, then customers would be more satisfied with our products, and I bet that we would not only regain our market share but increase it."
Jacob: "Lowering prices without lowering per-unit costs will not help us increase our profitability.
I think we need to improve our cost accounting system. I am not confident that we really know how much each of our product lines is costing us. It may be that we are overpricing some of our units because we are overcosting them. We may be underpricing other units."
Larry: "This sounds promising-especially if the overcosting is for some of our high-volume lines. A price decrease for these products would make the biggest difference-and if we knew they were overcosted, then we could offer immediate price reductions."
Bryce: "Jacob, I need more explanation. We have been using the same cost accounting system for the last 10 years. Why would it be a problem?"
Jacob: "I think that our manufacturing environment has changed. Over the years, we have added a lot of different product lines. Some of these products make very different demands on our manufacturing overhead resources. We trace-or attempt to trace-overhead costs to the different products using direct labor cost, a unit-based cost driver. We may be doing more allocation than tracing. If so, then we probably don't have a very good idea of our actual product costs. Also, as you know, with the way computer technology has changed over time, it is easier and cheaper to collect and use detailed information-information that will allow us to assign costs more accurately."
Bryce: "This may be something we should explore. Jacob, what do you suggest?"
Jacob: "If we want more accurate product costs and if we really want to get in the cost reduction business, then we need to understand how costs behave. In particular, we need to understand activity cost behavior. Knowing what activities we perform, why we perform them, and how well we perform them will help us identify areas for improvement. We also need to know how the different products consume activity resources. What this boils down to is the need to use an activity-based management system. But before we jump into this, we need some idea of whether non-unit-based drivers add anything. Activity-based management is not an inexpensive undertaking. So I suggest that we do a preliminary study to see if direct labor cost is adequate for tracing. If not, then maybe some non-unit-drivers might be needed. In fact, if you would like,
I can gather some data that will provide some evidence on the usefulness of the activity-based approach."
Bryce: "What do you think, Kim? It's your division."
Kim: "What Jacob has said sounds promising. I think he should pursue it and do so quickly. I also think that we need to look at improving our quality. It sounds like we have a problem there. If quality could be improved, then our costs will drop. I'll talk to our quality people. Jacob, in the meantime, find out for us if moving to an activity-based system is the way to go. How much time do you need?"
Jacob: "I have already been gathering data. I could probably have a report within two weeks."

Based on my initial analysis, I am confident that an ABC system will offer significant improvement. For one of our conventional phone plants, I regressed total monthly overhead cost on monthly direct labor cost using the following 15 months of data:

The results were revealing. Although direct labor cost appears to be a driver of overhead cost, it really doesn't explain a lot of the variation. I then searched for other drivers-particularly non-unit drivers-that might offer more insight into overhead cost behavior. Every time a batch is produced, material movement occurs, regardless of the size of the batch. The number of moves seemed like a more logical driver. I was able to gather only 10 months of data for this. (Our information system doesn't provide the number of moves, so I had to build the data set by interviewing production personnel.) This information is provided next:

The regression results were impressive. There is no question in my mind that the number of moves is a good driver of materials-handling costs. Using the number of moves to assign materials-handling costs to products would likely be better than the cost assignment using direct labor cost. Furthermore, since small batches use the same number of moves as large batches, we have some evidence that we may be overcosting our high-volume products.
I looked at one more overhead activity: inspecting products. We have 15 inspectors who are paid an average of $4,000 per month. Each inspector offers about 160 hours of inspection capacity per month. However, it appears that they actually work only about 80 percent of those hours. The drop in demand we have experienced explains this idle time. I see no evidence of variable cost behavior here. I'm not exactly sure how to treat inspection cost, but I think that it is more related to inspection hours than direct labor cost. Some of the other overhead activities seem to be non-unit-level, as well-enough, in fact, to be concerned about how we assign costs.
After receiving the memo, Kim was intrigued. She then asked Jacob to use the same phone plant as a pilot for a preliminary ABC analysis. She instructed him to assign all overhead costs to the plant's two products (Regular and Deluxe models), using only four activities. The four activities were rework, moving materials, inspecting products, and a general catch-all activity labeled "other manufacturing activities." From the special study already performed, she knew that materials handling and inspecting involved significant cost; from production reports, she also knew that the rework activity involved significant cost. If the ABC and unit-based cost assignments did not differ by breaking out these three major activities, then ABC may not matter.
Pursuant to the request, Jacob produced the following cost and driver information:

Expected activity demands:
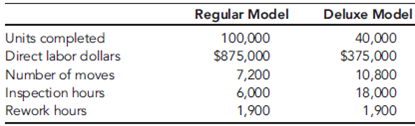
Required
Prepare an income statement for the Cable Service Division for March.
The Cable Service Division reported the following activity for the month of March:
The unit costs are divided as follows: 70 percent production and 30 percent marketing and customer service. Direct labor cost is the only driver used for tracing. Typically, the division uses only production costs to define unit costs. The preceding unit product cost information was provided at the request of the marketing manager and was the result of a special study.
Bryce Youngers, the president of CTB, is reasonably satisfied with the performance of the Cable Service Division. March's performance is fairly typical of what has been happening over the past two years. The Phone Division, however, is another matter. Its overall profit performance has been declining. Two years ago, income before income taxes had been about 25 percent of sales. March's dismal performance was also typical for what has been happening this year and is expected to continue-unless some action by management is taken to reverse the trend. During March, the Phone Division reported the following results:
During March, the Phone Division purchased materials totaling $312,000. There are no significant inventories of supplies (beginning or ending). Supplies are accounted for separately from materials. CTB's Phone Division had sales totaling $1,170,000 for March.
Based on March's results, Bryce decided to meet with three of the Phone Division's managers: Kim Breashears, divisional manager; Jacob Carder, divisional controller; and Larry Hartley, sales manager. A transcript of their recorded conversation is given next:
Bryce: "March's profit performance is down once again, and I think we need to see if we can identify the problem and correct it-before it's too late. Kim, what's your assessment of the situation?"
Kim: "Foreign competition is eating us alive. They are coming in with lower-priced phones of comparable or higher quality than our own. I've talked with several of the retailers that carry our lines, and they say the same. They are convinced that we can sell more if we lower our prices."
Larry: "They're right. If we could lower our prices by 10 to 15 percent, I think that we'd regain most ofour lost market share. But we also need to make sure that the quality of our products meets that of our competitors. As you know, we are spending a lot of money each month on rework and warranties. That worries me. I'd like to see that warranty cost cut by 70 to 80 percent. If we could do that, then customers would be more satisfied with our products, and I bet that we would not only regain our market share but increase it."
Jacob: "Lowering prices without lowering per-unit costs will not help us increase our profitability.
I think we need to improve our cost accounting system. I am not confident that we really know how much each of our product lines is costing us. It may be that we are overpricing some of our units because we are overcosting them. We may be underpricing other units."
Larry: "This sounds promising-especially if the overcosting is for some of our high-volume lines. A price decrease for these products would make the biggest difference-and if we knew they were overcosted, then we could offer immediate price reductions."
Bryce: "Jacob, I need more explanation. We have been using the same cost accounting system for the last 10 years. Why would it be a problem?"
Jacob: "I think that our manufacturing environment has changed. Over the years, we have added a lot of different product lines. Some of these products make very different demands on our manufacturing overhead resources. We trace-or attempt to trace-overhead costs to the different products using direct labor cost, a unit-based cost driver. We may be doing more allocation than tracing. If so, then we probably don't have a very good idea of our actual product costs. Also, as you know, with the way computer technology has changed over time, it is easier and cheaper to collect and use detailed information-information that will allow us to assign costs more accurately."
Bryce: "This may be something we should explore. Jacob, what do you suggest?"
Jacob: "If we want more accurate product costs and if we really want to get in the cost reduction business, then we need to understand how costs behave. In particular, we need to understand activity cost behavior. Knowing what activities we perform, why we perform them, and how well we perform them will help us identify areas for improvement. We also need to know how the different products consume activity resources. What this boils down to is the need to use an activity-based management system. But before we jump into this, we need some idea of whether non-unit-based drivers add anything. Activity-based management is not an inexpensive undertaking. So I suggest that we do a preliminary study to see if direct labor cost is adequate for tracing. If not, then maybe some non-unit-drivers might be needed. In fact, if you would like,
I can gather some data that will provide some evidence on the usefulness of the activity-based approach."
Bryce: "What do you think, Kim? It's your division."
Kim: "What Jacob has said sounds promising. I think he should pursue it and do so quickly. I also think that we need to look at improving our quality. It sounds like we have a problem there. If quality could be improved, then our costs will drop. I'll talk to our quality people. Jacob, in the meantime, find out for us if moving to an activity-based system is the way to go. How much time do you need?"
Jacob: "I have already been gathering data. I could probably have a report within two weeks."
Based on my initial analysis, I am confident that an ABC system will offer significant improvement. For one of our conventional phone plants, I regressed total monthly overhead cost on monthly direct labor cost using the following 15 months of data:
The results were revealing. Although direct labor cost appears to be a driver of overhead cost, it really doesn't explain a lot of the variation. I then searched for other drivers-particularly non-unit drivers-that might offer more insight into overhead cost behavior. Every time a batch is produced, material movement occurs, regardless of the size of the batch. The number of moves seemed like a more logical driver. I was able to gather only 10 months of data for this. (Our information system doesn't provide the number of moves, so I had to build the data set by interviewing production personnel.) This information is provided next:
The regression results were impressive. There is no question in my mind that the number of moves is a good driver of materials-handling costs. Using the number of moves to assign materials-handling costs to products would likely be better than the cost assignment using direct labor cost. Furthermore, since small batches use the same number of moves as large batches, we have some evidence that we may be overcosting our high-volume products.
I looked at one more overhead activity: inspecting products. We have 15 inspectors who are paid an average of $4,000 per month. Each inspector offers about 160 hours of inspection capacity per month. However, it appears that they actually work only about 80 percent of those hours. The drop in demand we have experienced explains this idle time. I see no evidence of variable cost behavior here. I'm not exactly sure how to treat inspection cost, but I think that it is more related to inspection hours than direct labor cost. Some of the other overhead activities seem to be non-unit-level, as well-enough, in fact, to be concerned about how we assign costs.
After receiving the memo, Kim was intrigued. She then asked Jacob to use the same phone plant as a pilot for a preliminary ABC analysis. She instructed him to assign all overhead costs to the plant's two products (Regular and Deluxe models), using only four activities. The four activities were rework, moving materials, inspecting products, and a general catch-all activity labeled "other manufacturing activities." From the special study already performed, she knew that materials handling and inspecting involved significant cost; from production reports, she also knew that the rework activity involved significant cost. If the ABC and unit-based cost assignments did not differ by breaking out these three major activities, then ABC may not matter.
Pursuant to the request, Jacob produced the following cost and driver information:
Expected activity demands:
Required
Prepare an income statement for the Cable Service Division for March.
Question
Beauville Furniture Corporation produces sofas, recliners, and lounge chairs. Beauville is located in a medium-sized community in the southeastern part of the United States. It is a major employer in the community. In fact, the economic well-being of the community is tied very strongly to Beauville. Beauville operates a sawmill, a fabric plant, and a furniture plant in the same community.
The sawmill buys logs from independent producers. The sawmill then processes the logs into four grades of lumber: firsts and seconds, No. 1 common, No. 2 common, and No. 3 common. All costs incurred in the mill are common to the four grades of lumber. All four grades of lumber are used by the furniture plant. The mill transfers everything it produces to the furniture plant, and the grades are transferred at cost. Trucks are used to move the lumber from the mill to the furniture plant. Although no outside sales exist, the mill could sell to external customers, and the selling prices of the four grades are known.
The fabric plant is responsible for producing the fabric that is used by the furniture plant. To produce three totally different fabrics (identified by fabric ID codes FB60, FB70, and FB80, respectively), the plant has three separate production operations-one for each fabric. Thus, production of all three fabrics occurs at the same time in different locations in the plant. Each fabric's production operation has two processes: the weaving and pattern process and the coloring and bolting process. In the weaving and pattern process, yarn is used to create yards of fabric with different designs. In the next process, the fabric is dyed, cut into 25-yard sections, and wrapped around cardboard rods to form 25-yard bolts. The bolts are transported by forklift to the furniture plant's Receiving Department. All of the output of the fabric plant is used by the furniture plant (to produce the sofas and chairs). For accounting purposes, the fabric is transferred at cost to the furniture plant.
The furniture plant produces orders for customers on a special-order basis. The customers specify the quantity, style, fabric, lumber grade, and pattern. Typically, jobs are large (involving at least 500 units). The plant has two production departments: Cutting and Assembly. In the Cutting Department, the fabric and wooden frame components are sized and cut. Other components are purchased from external suppliers and are removed from stores as needed for assembly. After the fabric and wooden components are finished for the entire job, they are moved to the Assembly Department. The Assembly Department takes the individual components and assembles the sofas (or chairs).
Beauville Furniture has been in business for over two decades and has a good reputation. However, during the past five years, Beauville experienced eroding profits and declining sales. Bids were increasingly lost (even aggressive bids) on the more popular models. Yet, the company was winning bids on some of the more-difficult-to-produce items. Lance Hays, the owner and manager, was frustrated. He simply couldn't understand how some of his competitors could sell for such low prices. On a common sofa job involving 500 units, Beauville's bids were running $25 per unit, or $12,500 per job more than the winning bids (on average). Yet, on the more difficult items, Beauville's bids were running about $60 per unit less than the next closest bid. Gisela Berling, vice president of finance, was assigned the task of preparing a cost analysis of the company's product lines. Lance wanted to know if the company's costs were excessive. Perhaps the company was being wasteful, and it was simply costing more to produce furniture than it was costing its competitors.
Gisela prepared herself by reading recent literature on cost management and product costing and attending several conferences that explored the same issues. She then reviewed the costing procedures of the company's mill and two plants and did a preliminary assessment of their soundness. The production costs of the mill were common to all lumber grades and were assigned using the physical units method. Since the output and production costs were fairly uniform throughout the year, the mill used an actual costing system. Although Gisela had no difficulty with actual costing, she decided to explore the effects of using the sales-value-at-split-off method. Thus, cost and production data for the mill were gathered so that an analysis could be conducted. The two plants used normal costing systems. The fabric plant used process costing, and the furniture plant used job-order costing. Both plants used plantwide overhead rates based on direct labor hours. Based on her initial reviews, she concluded that the costing procedures for the fabric plant were satisfactory. Essentially, there was no evidence of product diversity. A statistical analysis revealed that about 90 percent of the variability in the plant's overhead cost could be explained by direct labor hours. Thus, the use of a plantwide overhead rate based on direct labor hours seemed justified. What did concern her, though, was the material waste that she observed in the plant. Maybe a standard cost system would be useful for increasing the overall cost efficiency of the plant. Consequently, as part of her report to Lance, she decided to include a description of the fabric plant's costing procedures-at least for one of the fabric types. She also decided to develop a standard cost sheet for the chosen fabric. The furniture plant, however, was a more difficult matter. Product diversity was present and could be causing some distortions in product costs. Furthermore, statistical analysis revealed that only about 40 percent of the variability in overhead cost was explained by the direct labor hours. She decided that additional analysis was needed so that a sound product costing method could be recommended. One possibility would be to increase the number of overhead rates. Thus, she decided to include departmental data so that the effect of moving to departmental rates could be assessed. Finally, she also wanted to explore the possibility of converting the sawmill and fabric plant into profit centers and changing the existing transfer pricing policy.
With the cooperation of the cost accounting manager for the mill and each plant's controller, she gathered the following data for last year:
Sawmill:
Joint manufacturing costs: $900,000
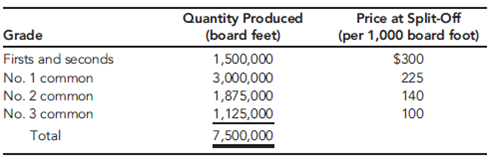
Fabric Plant:
Budgeted overhead: $1,200,000 (50% fixed)
Practical volume (direct labor hours): 120,000 hours
Actual overhead: $1,150,000 (50% fixed)
Actual hours worked:

Departmental data on Fabric FB70 (actual costs and actual outcomes):


*Unitsare measured in yards for the Weaving and Pattern Department and in bolts forthe Coloring and Bolting Department. Note: With the exception of the cardboard bolt rods, materials are added at the beginning of each process. The cost of the rods is relatively insignificant and is included in overhead.
Proposed standard cost sheet for Fabric FB70 (for the Coloring and Bolting Department only):

Furniture Plant:
Departmental data (budgeted):

After some discussion with the furniture plant controller, Gisela decided to use machine hours to calculate the overhead rate for the Cutting Department and direct labor hours for the Assembly Department rate (the Cutting Department was more automated than the Assembly Department). As part of her report, she wanted to compare the effects of plantwide rates and departmental rates on the cost of jobs. She wanted to know if overhead costing could be the source of the pricing problems the company was experiencing.
To assess the effect of the different overhead assignment procedures, Gisela decided to examine two prospective jobs. One job, Job A500, could produce 500 sofas, using a frequently requested style and Fabric FB70. Bids on this type of job were being lost more frequently to competitors. The second job, Job B75, would produce 75 specially designed recliners. This job involved a new design and was more difficult for the workers to build. It involved some special cutting requirements and an unfamiliar assembly. Recently, the company seemed to be winning more bids on jobs of this type. To compute the costs of the two jobs, Gisela assembled the following information on the two jobs:
Job A500:

Job B75:

Required
Calculate the following overhead rates for the furniture plant: (1) plantwide rate and (2) departmental rates. Use the direct method for assigning service costs to producing departments.
The sawmill buys logs from independent producers. The sawmill then processes the logs into four grades of lumber: firsts and seconds, No. 1 common, No. 2 common, and No. 3 common. All costs incurred in the mill are common to the four grades of lumber. All four grades of lumber are used by the furniture plant. The mill transfers everything it produces to the furniture plant, and the grades are transferred at cost. Trucks are used to move the lumber from the mill to the furniture plant. Although no outside sales exist, the mill could sell to external customers, and the selling prices of the four grades are known.
The fabric plant is responsible for producing the fabric that is used by the furniture plant. To produce three totally different fabrics (identified by fabric ID codes FB60, FB70, and FB80, respectively), the plant has three separate production operations-one for each fabric. Thus, production of all three fabrics occurs at the same time in different locations in the plant. Each fabric's production operation has two processes: the weaving and pattern process and the coloring and bolting process. In the weaving and pattern process, yarn is used to create yards of fabric with different designs. In the next process, the fabric is dyed, cut into 25-yard sections, and wrapped around cardboard rods to form 25-yard bolts. The bolts are transported by forklift to the furniture plant's Receiving Department. All of the output of the fabric plant is used by the furniture plant (to produce the sofas and chairs). For accounting purposes, the fabric is transferred at cost to the furniture plant.
The furniture plant produces orders for customers on a special-order basis. The customers specify the quantity, style, fabric, lumber grade, and pattern. Typically, jobs are large (involving at least 500 units). The plant has two production departments: Cutting and Assembly. In the Cutting Department, the fabric and wooden frame components are sized and cut. Other components are purchased from external suppliers and are removed from stores as needed for assembly. After the fabric and wooden components are finished for the entire job, they are moved to the Assembly Department. The Assembly Department takes the individual components and assembles the sofas (or chairs).
Beauville Furniture has been in business for over two decades and has a good reputation. However, during the past five years, Beauville experienced eroding profits and declining sales. Bids were increasingly lost (even aggressive bids) on the more popular models. Yet, the company was winning bids on some of the more-difficult-to-produce items. Lance Hays, the owner and manager, was frustrated. He simply couldn't understand how some of his competitors could sell for such low prices. On a common sofa job involving 500 units, Beauville's bids were running $25 per unit, or $12,500 per job more than the winning bids (on average). Yet, on the more difficult items, Beauville's bids were running about $60 per unit less than the next closest bid. Gisela Berling, vice president of finance, was assigned the task of preparing a cost analysis of the company's product lines. Lance wanted to know if the company's costs were excessive. Perhaps the company was being wasteful, and it was simply costing more to produce furniture than it was costing its competitors.
Gisela prepared herself by reading recent literature on cost management and product costing and attending several conferences that explored the same issues. She then reviewed the costing procedures of the company's mill and two plants and did a preliminary assessment of their soundness. The production costs of the mill were common to all lumber grades and were assigned using the physical units method. Since the output and production costs were fairly uniform throughout the year, the mill used an actual costing system. Although Gisela had no difficulty with actual costing, she decided to explore the effects of using the sales-value-at-split-off method. Thus, cost and production data for the mill were gathered so that an analysis could be conducted. The two plants used normal costing systems. The fabric plant used process costing, and the furniture plant used job-order costing. Both plants used plantwide overhead rates based on direct labor hours. Based on her initial reviews, she concluded that the costing procedures for the fabric plant were satisfactory. Essentially, there was no evidence of product diversity. A statistical analysis revealed that about 90 percent of the variability in the plant's overhead cost could be explained by direct labor hours. Thus, the use of a plantwide overhead rate based on direct labor hours seemed justified. What did concern her, though, was the material waste that she observed in the plant. Maybe a standard cost system would be useful for increasing the overall cost efficiency of the plant. Consequently, as part of her report to Lance, she decided to include a description of the fabric plant's costing procedures-at least for one of the fabric types. She also decided to develop a standard cost sheet for the chosen fabric. The furniture plant, however, was a more difficult matter. Product diversity was present and could be causing some distortions in product costs. Furthermore, statistical analysis revealed that only about 40 percent of the variability in overhead cost was explained by the direct labor hours. She decided that additional analysis was needed so that a sound product costing method could be recommended. One possibility would be to increase the number of overhead rates. Thus, she decided to include departmental data so that the effect of moving to departmental rates could be assessed. Finally, she also wanted to explore the possibility of converting the sawmill and fabric plant into profit centers and changing the existing transfer pricing policy.
With the cooperation of the cost accounting manager for the mill and each plant's controller, she gathered the following data for last year:
Sawmill:
Joint manufacturing costs: $900,000
Fabric Plant:
Budgeted overhead: $1,200,000 (50% fixed)
Practical volume (direct labor hours): 120,000 hours
Actual overhead: $1,150,000 (50% fixed)
Actual hours worked:
Departmental data on Fabric FB70 (actual costs and actual outcomes):
*Unitsare measured in yards for the Weaving and Pattern Department and in bolts forthe Coloring and Bolting Department. Note: With the exception of the cardboard bolt rods, materials are added at the beginning of each process. The cost of the rods is relatively insignificant and is included in overhead.
Proposed standard cost sheet for Fabric FB70 (for the Coloring and Bolting Department only):
Furniture Plant:
Departmental data (budgeted):
After some discussion with the furniture plant controller, Gisela decided to use machine hours to calculate the overhead rate for the Cutting Department and direct labor hours for the Assembly Department rate (the Cutting Department was more automated than the Assembly Department). As part of her report, she wanted to compare the effects of plantwide rates and departmental rates on the cost of jobs. She wanted to know if overhead costing could be the source of the pricing problems the company was experiencing.
To assess the effect of the different overhead assignment procedures, Gisela decided to examine two prospective jobs. One job, Job A500, could produce 500 sofas, using a frequently requested style and Fabric FB70. Bids on this type of job were being lost more frequently to competitors. The second job, Job B75, would produce 75 specially designed recliners. This job involved a new design and was more difficult for the workers to build. It involved some special cutting requirements and an unfamiliar assembly. Recently, the company seemed to be winning more bids on jobs of this type. To compute the costs of the two jobs, Gisela assembled the following information on the two jobs:
Job A500:
Job B75:
Required
Calculate the following overhead rates for the furniture plant: (1) plantwide rate and (2) departmental rates. Use the direct method for assigning service costs to producing departments.
Question
CableTech Bell Corporation (CTB) operates in the telecommunications industry. CTB has two divisions: the Phone Division and the Cable Service Division. The Phone Division manufactures telephones in several plants located in the Midwest. The product lines run from relatively inexpensive touch-tone wall and desk phones to expensive, high-quality cellular phones. CTB also operates a cable TV service in Ohio. The Cable Service Division offers three products: a basic package with 25 channels; an enhanced package, which is the basic package plus 15 additional channels and two movie channels; and a premium package, which is the basic package plus 25 additional channels and three movie channels.
The Cable Service Division reported the following activity for the month of March:

The unit costs are divided as follows: 70 percent production and 30 percent marketing and customer service. Direct labor cost is the only driver used for tracing. Typically, the division uses only production costs to define unit costs. The preceding unit product cost information was provided at the request of the marketing manager and was the result of a special study.
Bryce Youngers, the president of CTB, is reasonably satisfied with the performance of the Cable Service Division. March's performance is fairly typical of what has been happening over the past two years. The Phone Division, however, is another matter. Its overall profit performance has been declining. Two years ago, income before income taxes had been about 25 percent of sales. March's dismal performance was also typical for what has been happening this year and is expected to continue-unless some action by management is taken to reverse the trend. During March, the Phone Division reported the following results:


During March, the Phone Division purchased materials totaling $312,000. There are no significant inventories of supplies (beginning or ending). Supplies are accounted for separately from materials. CTB's Phone Division had sales totaling $1,170,000 for March.
Based on March's results, Bryce decided to meet with three of the Phone Division's managers: Kim Breashears, divisional manager; Jacob Carder, divisional controller; and Larry Hartley, sales manager. A transcript of their recorded conversation is given next:
Bryce: "March's profit performance is down once again, and I think we need to see if we can identify the problem and correct it-before it's too late. Kim, what's your assessment of the situation?"
Kim: "Foreign competition is eating us alive. They are coming in with lower-priced phones of comparable or higher quality than our own. I've talked with several of the retailers that carry our lines, and they say the same. They are convinced that we can sell more if we lower our prices."
Larry: "They're right. If we could lower our prices by 10 to 15 percent, I think that we'd regain most ofour lost market share. But we also need to make sure that the quality of our products meets that of our competitors. As you know, we are spending a lot of money each month on rework and warranties. That worries me. I'd like to see that warranty cost cut by 70 to 80 percent. If we could do that, then customers would be more satisfied with our products, and I bet that we would not only regain our market share but increase it."
Jacob: "Lowering prices without lowering per-unit costs will not help us increase our profitability.
I think we need to improve our cost accounting system. I am not confident that we really know how much each of our product lines is costing us. It may be that we are overpricing some of our units because we are overcosting them. We may be underpricing other units."
Larry: "This sounds promising-especially if the overcosting is for some of our high-volume lines. A price decrease for these products would make the biggest difference-and if we knew they were overcosted, then we could offer immediate price reductions."
Bryce: "Jacob, I need more explanation. We have been using the same cost accounting system for the last 10 years. Why would it be a problem?"
Jacob: "I think that our manufacturing environment has changed. Over the years, we have added a lot of different product lines. Some of these products make very different demands on our manufacturing overhead resources. We trace-or attempt to trace-overhead costs to the different products using direct labor cost, a unit-based cost driver. We may be doing more allocation than tracing. If so, then we probably don't have a very good idea of our actual product costs. Also, as you know, with the way computer technology has changed over time, it is easier and cheaper to collect and use detailed information-information that will allow us to assign costs more accurately."
Bryce: "This may be something we should explore. Jacob, what do you suggest?"
Jacob: "If we want more accurate product costs and if we really want to get in the cost reduction business, then we need to understand how costs behave. In particular, we need to understand activity cost behavior. Knowing what activities we perform, why we perform them, and how well we perform them will help us identify areas for improvement. We also need to know how the different products consume activity resources. What this boils down to is the need to use an activity-based management system. But before we jump into this, we need some idea of whether non-unit-based drivers add anything. Activity-based management is not an inexpensive undertaking. So I suggest that we do a preliminary study to see if direct labor cost is adequate for tracing. If not, then maybe some non-unit-drivers might be needed. In fact, if you would like,
I can gather some data that will provide some evidence on the usefulness of the activity-based approach."
Bryce: "What do you think, Kim? It's your division."
Kim: "What Jacob has said sounds promising. I think he should pursue it and do so quickly. I also think that we need to look at improving our quality. It sounds like we have a problem there. If quality could be improved, then our costs will drop. I'll talk to our quality people. Jacob, in the meantime, find out for us if moving to an activity-based system is the way to go. How much time do you need?"
Jacob: "I have already been gathering data. I could probably have a report within two weeks."

Based on my initial analysis, I am confident that an ABC system will offer significant improvement. For one of our conventional phone plants, I regressed total monthly overhead cost on monthly direct labor cost using the following 15 months of data:

The results were revealing. Although direct labor cost appears to be a driver of overhead cost, it really doesn't explain a lot of the variation. I then searched for other drivers-particularly non-unit drivers-that might offer more insight into overhead cost behavior. Every time a batch is produced, material movement occurs, regardless of the size of the batch. The number of moves seemed like a more logical driver. I was able to gather only 10 months of data for this. (Our information system doesn't provide the number of moves, so I had to build the data set by interviewing production personnel.) This information is provided next:
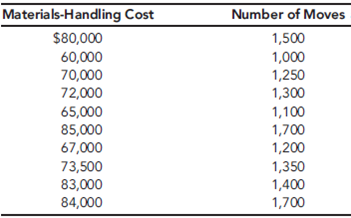
The regression results were impressive. There is no question in my mind that the number of moves is a good driver of materials-handling costs. Using the number of moves to assign materials-handling costs to products would likely be better than the cost assignment using direct labor cost. Furthermore, since small batches use the same number of moves as large batches, we have some evidence that we may be overcosting our high-volume products.
I looked at one more overhead activity: inspecting products. We have 15 inspectors who are paid an average of $4,000 per month. Each inspector offers about 160 hours of inspection capacity per month. However, it appears that they actually work only about 80 percent of those hours. The drop in demand we have experienced explains this idle time. I see no evidence of variable cost behavior here. I'm not exactly sure how to treat inspection cost, but I think that it is more related to inspection hours than direct labor cost. Some of the other overhead activities seem to be non-unit-level, as well-enough, in fact, to be concerned about how we assign costs.
After receiving the memo, Kim was intrigued. She then asked Jacob to use the same phone plant as a pilot for a preliminary ABC analysis. She instructed him to assign all overhead costs to the plant's two products (Regular and Deluxe models), using only four activities. The four activities were rework, moving materials, inspecting products, and a general catch-all activity labeled "other manufacturing activities." From the special study already performed, she knew that materials handling and inspecting involved significant cost; from production reports, she also knew that the rework activity involved significant cost. If the ABC and unit-based cost assignments did not differ by breaking out these three major activities, then ABC may not matter.
Pursuant to the request, Jacob produced the following cost and driver information:

Expected activity demands:

Required
Prepare an income statement for the Phone Division for March. Include a supporting cost of goods manufactured statement.
The Cable Service Division reported the following activity for the month of March:
The unit costs are divided as follows: 70 percent production and 30 percent marketing and customer service. Direct labor cost is the only driver used for tracing. Typically, the division uses only production costs to define unit costs. The preceding unit product cost information was provided at the request of the marketing manager and was the result of a special study.
Bryce Youngers, the president of CTB, is reasonably satisfied with the performance of the Cable Service Division. March's performance is fairly typical of what has been happening over the past two years. The Phone Division, however, is another matter. Its overall profit performance has been declining. Two years ago, income before income taxes had been about 25 percent of sales. March's dismal performance was also typical for what has been happening this year and is expected to continue-unless some action by management is taken to reverse the trend. During March, the Phone Division reported the following results:
During March, the Phone Division purchased materials totaling $312,000. There are no significant inventories of supplies (beginning or ending). Supplies are accounted for separately from materials. CTB's Phone Division had sales totaling $1,170,000 for March.
Based on March's results, Bryce decided to meet with three of the Phone Division's managers: Kim Breashears, divisional manager; Jacob Carder, divisional controller; and Larry Hartley, sales manager. A transcript of their recorded conversation is given next:
Bryce: "March's profit performance is down once again, and I think we need to see if we can identify the problem and correct it-before it's too late. Kim, what's your assessment of the situation?"
Kim: "Foreign competition is eating us alive. They are coming in with lower-priced phones of comparable or higher quality than our own. I've talked with several of the retailers that carry our lines, and they say the same. They are convinced that we can sell more if we lower our prices."
Larry: "They're right. If we could lower our prices by 10 to 15 percent, I think that we'd regain most ofour lost market share. But we also need to make sure that the quality of our products meets that of our competitors. As you know, we are spending a lot of money each month on rework and warranties. That worries me. I'd like to see that warranty cost cut by 70 to 80 percent. If we could do that, then customers would be more satisfied with our products, and I bet that we would not only regain our market share but increase it."
Jacob: "Lowering prices without lowering per-unit costs will not help us increase our profitability.
I think we need to improve our cost accounting system. I am not confident that we really know how much each of our product lines is costing us. It may be that we are overpricing some of our units because we are overcosting them. We may be underpricing other units."
Larry: "This sounds promising-especially if the overcosting is for some of our high-volume lines. A price decrease for these products would make the biggest difference-and if we knew they were overcosted, then we could offer immediate price reductions."
Bryce: "Jacob, I need more explanation. We have been using the same cost accounting system for the last 10 years. Why would it be a problem?"
Jacob: "I think that our manufacturing environment has changed. Over the years, we have added a lot of different product lines. Some of these products make very different demands on our manufacturing overhead resources. We trace-or attempt to trace-overhead costs to the different products using direct labor cost, a unit-based cost driver. We may be doing more allocation than tracing. If so, then we probably don't have a very good idea of our actual product costs. Also, as you know, with the way computer technology has changed over time, it is easier and cheaper to collect and use detailed information-information that will allow us to assign costs more accurately."
Bryce: "This may be something we should explore. Jacob, what do you suggest?"
Jacob: "If we want more accurate product costs and if we really want to get in the cost reduction business, then we need to understand how costs behave. In particular, we need to understand activity cost behavior. Knowing what activities we perform, why we perform them, and how well we perform them will help us identify areas for improvement. We also need to know how the different products consume activity resources. What this boils down to is the need to use an activity-based management system. But before we jump into this, we need some idea of whether non-unit-based drivers add anything. Activity-based management is not an inexpensive undertaking. So I suggest that we do a preliminary study to see if direct labor cost is adequate for tracing. If not, then maybe some non-unit-drivers might be needed. In fact, if you would like,
I can gather some data that will provide some evidence on the usefulness of the activity-based approach."
Bryce: "What do you think, Kim? It's your division."
Kim: "What Jacob has said sounds promising. I think he should pursue it and do so quickly. I also think that we need to look at improving our quality. It sounds like we have a problem there. If quality could be improved, then our costs will drop. I'll talk to our quality people. Jacob, in the meantime, find out for us if moving to an activity-based system is the way to go. How much time do you need?"
Jacob: "I have already been gathering data. I could probably have a report within two weeks."
Based on my initial analysis, I am confident that an ABC system will offer significant improvement. For one of our conventional phone plants, I regressed total monthly overhead cost on monthly direct labor cost using the following 15 months of data:
The results were revealing. Although direct labor cost appears to be a driver of overhead cost, it really doesn't explain a lot of the variation. I then searched for other drivers-particularly non-unit drivers-that might offer more insight into overhead cost behavior. Every time a batch is produced, material movement occurs, regardless of the size of the batch. The number of moves seemed like a more logical driver. I was able to gather only 10 months of data for this. (Our information system doesn't provide the number of moves, so I had to build the data set by interviewing production personnel.) This information is provided next:
The regression results were impressive. There is no question in my mind that the number of moves is a good driver of materials-handling costs. Using the number of moves to assign materials-handling costs to products would likely be better than the cost assignment using direct labor cost. Furthermore, since small batches use the same number of moves as large batches, we have some evidence that we may be overcosting our high-volume products.
I looked at one more overhead activity: inspecting products. We have 15 inspectors who are paid an average of $4,000 per month. Each inspector offers about 160 hours of inspection capacity per month. However, it appears that they actually work only about 80 percent of those hours. The drop in demand we have experienced explains this idle time. I see no evidence of variable cost behavior here. I'm not exactly sure how to treat inspection cost, but I think that it is more related to inspection hours than direct labor cost. Some of the other overhead activities seem to be non-unit-level, as well-enough, in fact, to be concerned about how we assign costs.
After receiving the memo, Kim was intrigued. She then asked Jacob to use the same phone plant as a pilot for a preliminary ABC analysis. She instructed him to assign all overhead costs to the plant's two products (Regular and Deluxe models), using only four activities. The four activities were rework, moving materials, inspecting products, and a general catch-all activity labeled "other manufacturing activities." From the special study already performed, she knew that materials handling and inspecting involved significant cost; from production reports, she also knew that the rework activity involved significant cost. If the ABC and unit-based cost assignments did not differ by breaking out these three major activities, then ABC may not matter.
Pursuant to the request, Jacob produced the following cost and driver information:
Expected activity demands:
Required
Prepare an income statement for the Phone Division for March. Include a supporting cost of goods manufactured statement.
Question
Beauville Furniture Corporation produces sofas, recliners, and lounge chairs. Beauville is located in a medium-sized community in the southeastern part of the United States. It is a major employer in the community. In fact, the economic well-being of the community is tied very strongly to Beauville. Beauville operates a sawmill, a fabric plant, and a furniture plant in the same community.
The sawmill buys logs from independent producers. The sawmill then processes the logs into four grades of lumber: firsts and seconds, No. 1 common, No. 2 common, and No. 3 common. All costs incurred in the mill are common to the four grades of lumber. All four grades of lumber are used by the furniture plant. The mill transfers everything it produces to the furniture plant, and the grades are transferred at cost. Trucks are used to move the lumber from the mill to the furniture plant. Although no outside sales exist, the mill could sell to external customers, and the selling prices of the four grades are known.
The fabric plant is responsible for producing the fabric that is used by the furniture plant. To produce three totally different fabrics (identified by fabric ID codes FB60, FB70, and FB80, respectively), the plant has three separate production operations-one for each fabric. Thus, production of all three fabrics occurs at the same time in different locations in the plant. Each fabric's production operation has two processes: the weaving and pattern process and the coloring and bolting process. In the weaving and pattern process, yarn is used to create yards of fabric with different designs. In the next process, the fabric is dyed, cut into 25-yard sections, and wrapped around cardboard rods to form 25-yard bolts. The bolts are transported by forklift to the furniture plant's Receiving Department. All of the output of the fabric plant is used by the furniture plant (to produce the sofas and chairs). For accounting purposes, the fabric is transferred at cost to the furniture plant.
The furniture plant produces orders for customers on a special-order basis. The customers specify the quantity, style, fabric, lumber grade, and pattern. Typically, jobs are large (involving at least 500 units). The plant has two production departments: Cutting and Assembly. In the Cutting Department, the fabric and wooden frame components are sized and cut. Other components are purchased from external suppliers and are removed from stores as needed for assembly. After the fabric and wooden components are finished for the entire job, they are moved to the Assembly Department. The Assembly Department takes the individual components and assembles the sofas (or chairs).
Beauville Furniture has been in business for over two decades and has a good reputation. However, during the past five years, Beauville experienced eroding profits and declining sales. Bids were increasingly lost (even aggressive bids) on the more popular models. Yet, the company was winning bids on some of the more-difficult-to-produce items. Lance Hays, the owner and manager, was frustrated. He simply couldn't understand how some of his competitors could sell for such low prices. On a common sofa job involving 500 units, Beauville's bids were running $25 per unit, or $12,500 per job more than the winning bids (on average). Yet, on the more difficult items, Beauville's bids were running about $60 per unit less than the next closest bid. Gisela Berling, vice president of finance, was assigned the task of preparing a cost analysis of the company's product lines. Lance wanted to know if the company's costs were excessive. Perhaps the company was being wasteful, and it was simply costing more to produce furniture than it was costing its competitors.
Gisela prepared herself by reading recent literature on cost management and product costing and attending several conferences that explored the same issues. She then reviewed the costing procedures of the company's mill and two plants and did a preliminary assessment of their soundness. The production costs of the mill were common to all lumber grades and were assigned using the physical units method. Since the output and production costs were fairly uniform throughout the year, the mill used an actual costing system. Although Gisela had no difficulty with actual costing, she decided to explore the effects of using the sales-value-at-split-off method. Thus, cost and production data for the mill were gathered so that an analysis could be conducted. The two plants used normal costing systems. The fabric plant used process costing, and the furniture plant used job-order costing. Both plants used plantwide overhead rates based on direct labor hours. Based on her initial reviews, she concluded that the costing procedures for the fabric plant were satisfactory. Essentially, there was no evidence of product diversity. A statistical analysis revealed that about 90 percent of the variability in the plant's overhead cost could be explained by direct labor hours. Thus, the use of a plantwide overhead rate based on direct labor hours seemed justified. What did concern her, though, was the material waste that she observed in the plant. Maybe a standard cost system would be useful for increasing the overall cost efficiency of the plant. Consequently, as part of her report to Lance, she decided to include a description of the fabric plant's costing procedures-at least for one of the fabric types. She also decided to develop a standard cost sheet for the chosen fabric. The furniture plant, however, was a more difficult matter. Product diversity was present and could be causing some distortions in product costs. Furthermore, statistical analysis revealed that only about 40 percent of the variability in overhead cost was explained by the direct labor hours. She decided that additional analysis was needed so that a sound product costing method could be recommended. One possibility would be to increase the number of overhead rates. Thus, she decided to include departmental data so that the effect of moving to departmental rates could be assessed. Finally, she also wanted to explore the possibility of converting the sawmill and fabric plant into profit centers and changing the existing transfer pricing policy.
With the cooperation of the cost accounting manager for the mill and each plant's controller, she gathered the following data for last year:
Sawmill:
Joint manufacturing costs: $900,000

Fabric Plant:
Budgeted overhead: $1,200,000 (50% fixed)
Practical volume (direct labor hours): 120,000 hours
Actual overhead: $1,150,000 (50% fixed)
Actual hours worked:

Departmental data on Fabric FB70 (actual costs and actual outcomes):


*Unitsare measured in yards for the Weaving and Pattern Department and in bolts forthe Coloring and Bolting Department. Note: With the exception of the cardboard bolt rods, materials are added at the beginning of each process. The cost of the rods is relatively insignificant and is included in overhead.
Proposed standard cost sheet for Fabric FB70 (for the Coloring and Bolting Department only):

Furniture Plant:
Departmental data (budgeted):

After some discussion with the furniture plant controller, Gisela decided to use machine hours to calculate the overhead rate for the Cutting Department and direct labor hours for the Assembly Department rate (the Cutting Department was more automated than the Assembly Department). As part of her report, she wanted to compare the effects of plantwide rates and departmental rates on the cost of jobs. She wanted to know if overhead costing could be the source of the pricing problems the company was experiencing.
To assess the effect of the different overhead assignment procedures, Gisela decided to examine two prospective jobs. One job, Job A500, could produce 500 sofas, using a frequently requested style and Fabric FB70. Bids on this type of job were being lost more frequently to competitors. The second job, Job B75, would produce 75 specially designed recliners. This job involved a new design and was more difficult for the workers to build. It involved some special cutting requirements and an unfamiliar assembly. Recently, the company seemed to be winning more bids on jobs of this type. To compute the costs of the two jobs, Gisela assembled the following information on the two jobs:
Job A500:

Job B75:

Required
For each of the overhead rates computed in Requirement 9, calculate unit bid prices for Jobs A500 and B75. Assume that the company's aggressive bidding policy is unit cost plus 50 percent. Did departmental overhead rates have any effect on Beauville's winning or losing bids? What recommendation would you make? Explain. Now, adjust the costs and bids for departmental rate bids using the proposed standard costs for the Coloring and Bolting Department. Did this make a difference? What does this tell you?
The sawmill buys logs from independent producers. The sawmill then processes the logs into four grades of lumber: firsts and seconds, No. 1 common, No. 2 common, and No. 3 common. All costs incurred in the mill are common to the four grades of lumber. All four grades of lumber are used by the furniture plant. The mill transfers everything it produces to the furniture plant, and the grades are transferred at cost. Trucks are used to move the lumber from the mill to the furniture plant. Although no outside sales exist, the mill could sell to external customers, and the selling prices of the four grades are known.
The fabric plant is responsible for producing the fabric that is used by the furniture plant. To produce three totally different fabrics (identified by fabric ID codes FB60, FB70, and FB80, respectively), the plant has three separate production operations-one for each fabric. Thus, production of all three fabrics occurs at the same time in different locations in the plant. Each fabric's production operation has two processes: the weaving and pattern process and the coloring and bolting process. In the weaving and pattern process, yarn is used to create yards of fabric with different designs. In the next process, the fabric is dyed, cut into 25-yard sections, and wrapped around cardboard rods to form 25-yard bolts. The bolts are transported by forklift to the furniture plant's Receiving Department. All of the output of the fabric plant is used by the furniture plant (to produce the sofas and chairs). For accounting purposes, the fabric is transferred at cost to the furniture plant.
The furniture plant produces orders for customers on a special-order basis. The customers specify the quantity, style, fabric, lumber grade, and pattern. Typically, jobs are large (involving at least 500 units). The plant has two production departments: Cutting and Assembly. In the Cutting Department, the fabric and wooden frame components are sized and cut. Other components are purchased from external suppliers and are removed from stores as needed for assembly. After the fabric and wooden components are finished for the entire job, they are moved to the Assembly Department. The Assembly Department takes the individual components and assembles the sofas (or chairs).
Beauville Furniture has been in business for over two decades and has a good reputation. However, during the past five years, Beauville experienced eroding profits and declining sales. Bids were increasingly lost (even aggressive bids) on the more popular models. Yet, the company was winning bids on some of the more-difficult-to-produce items. Lance Hays, the owner and manager, was frustrated. He simply couldn't understand how some of his competitors could sell for such low prices. On a common sofa job involving 500 units, Beauville's bids were running $25 per unit, or $12,500 per job more than the winning bids (on average). Yet, on the more difficult items, Beauville's bids were running about $60 per unit less than the next closest bid. Gisela Berling, vice president of finance, was assigned the task of preparing a cost analysis of the company's product lines. Lance wanted to know if the company's costs were excessive. Perhaps the company was being wasteful, and it was simply costing more to produce furniture than it was costing its competitors.
Gisela prepared herself by reading recent literature on cost management and product costing and attending several conferences that explored the same issues. She then reviewed the costing procedures of the company's mill and two plants and did a preliminary assessment of their soundness. The production costs of the mill were common to all lumber grades and were assigned using the physical units method. Since the output and production costs were fairly uniform throughout the year, the mill used an actual costing system. Although Gisela had no difficulty with actual costing, she decided to explore the effects of using the sales-value-at-split-off method. Thus, cost and production data for the mill were gathered so that an analysis could be conducted. The two plants used normal costing systems. The fabric plant used process costing, and the furniture plant used job-order costing. Both plants used plantwide overhead rates based on direct labor hours. Based on her initial reviews, she concluded that the costing procedures for the fabric plant were satisfactory. Essentially, there was no evidence of product diversity. A statistical analysis revealed that about 90 percent of the variability in the plant's overhead cost could be explained by direct labor hours. Thus, the use of a plantwide overhead rate based on direct labor hours seemed justified. What did concern her, though, was the material waste that she observed in the plant. Maybe a standard cost system would be useful for increasing the overall cost efficiency of the plant. Consequently, as part of her report to Lance, she decided to include a description of the fabric plant's costing procedures-at least for one of the fabric types. She also decided to develop a standard cost sheet for the chosen fabric. The furniture plant, however, was a more difficult matter. Product diversity was present and could be causing some distortions in product costs. Furthermore, statistical analysis revealed that only about 40 percent of the variability in overhead cost was explained by the direct labor hours. She decided that additional analysis was needed so that a sound product costing method could be recommended. One possibility would be to increase the number of overhead rates. Thus, she decided to include departmental data so that the effect of moving to departmental rates could be assessed. Finally, she also wanted to explore the possibility of converting the sawmill and fabric plant into profit centers and changing the existing transfer pricing policy.
With the cooperation of the cost accounting manager for the mill and each plant's controller, she gathered the following data for last year:
Sawmill:
Joint manufacturing costs: $900,000
Fabric Plant:
Budgeted overhead: $1,200,000 (50% fixed)
Practical volume (direct labor hours): 120,000 hours
Actual overhead: $1,150,000 (50% fixed)
Actual hours worked:
Departmental data on Fabric FB70 (actual costs and actual outcomes):
*Unitsare measured in yards for the Weaving and Pattern Department and in bolts forthe Coloring and Bolting Department. Note: With the exception of the cardboard bolt rods, materials are added at the beginning of each process. The cost of the rods is relatively insignificant and is included in overhead.
Proposed standard cost sheet for Fabric FB70 (for the Coloring and Bolting Department only):
Furniture Plant:
Departmental data (budgeted):
After some discussion with the furniture plant controller, Gisela decided to use machine hours to calculate the overhead rate for the Cutting Department and direct labor hours for the Assembly Department rate (the Cutting Department was more automated than the Assembly Department). As part of her report, she wanted to compare the effects of plantwide rates and departmental rates on the cost of jobs. She wanted to know if overhead costing could be the source of the pricing problems the company was experiencing.
To assess the effect of the different overhead assignment procedures, Gisela decided to examine two prospective jobs. One job, Job A500, could produce 500 sofas, using a frequently requested style and Fabric FB70. Bids on this type of job were being lost more frequently to competitors. The second job, Job B75, would produce 75 specially designed recliners. This job involved a new design and was more difficult for the workers to build. It involved some special cutting requirements and an unfamiliar assembly. Recently, the company seemed to be winning more bids on jobs of this type. To compute the costs of the two jobs, Gisela assembled the following information on the two jobs:
Job A500:
Job B75:
Required
For each of the overhead rates computed in Requirement 9, calculate unit bid prices for Jobs A500 and B75. Assume that the company's aggressive bidding policy is unit cost plus 50 percent. Did departmental overhead rates have any effect on Beauville's winning or losing bids? What recommendation would you make? Explain. Now, adjust the costs and bids for departmental rate bids using the proposed standard costs for the Coloring and Bolting Department. Did this make a difference? What does this tell you?
Question
CableTech Bell Corporation (CTB) operates in the telecommunications industry. CTB has two divisions: the Phone Division and the Cable Service Division. The Phone Division manufactures telephones in several plants located in the Midwest. The product lines run from relatively inexpensive touch-tone wall and desk phones to expensive, high-quality cellular phones. CTB also operates a cable TV service in Ohio. The Cable Service Division offers three products: a basic package with 25 channels; an enhanced package, which is the basic package plus 15 additional channels and two movie channels; and a premium package, which is the basic package plus 25 additional channels and three movie channels.
The Cable Service Division reported the following activity for the month of March:

The unit costs are divided as follows: 70 percent production and 30 percent marketing and customer service. Direct labor cost is the only driver used for tracing. Typically, the division uses only production costs to define unit costs. The preceding unit product cost information was provided at the request of the marketing manager and was the result of a special study.
Bryce Youngers, the president of CTB, is reasonably satisfied with the performance of the Cable Service Division. March's performance is fairly typical of what has been happening over the past two years. The Phone Division, however, is another matter. Its overall profit performance has been declining. Two years ago, income before income taxes had been about 25 percent of sales. March's dismal performance was also typical for what has been happening this year and is expected to continue-unless some action by management is taken to reverse the trend. During March, the Phone Division reported the following results:


During March, the Phone Division purchased materials totaling $312,000. There are no significant inventories of supplies (beginning or ending). Supplies are accounted for separately from materials. CTB's Phone Division had sales totaling $1,170,000 for March.
Based on March's results, Bryce decided to meet with three of the Phone Division's managers: Kim Breashears, divisional manager; Jacob Carder, divisional controller; and Larry Hartley, sales manager. A transcript of their recorded conversation is given next:
Bryce: "March's profit performance is down once again, and I think we need to see if we can identify the problem and correct it-before it's too late. Kim, what's your assessment of the situation?"
Kim: "Foreign competition is eating us alive. They are coming in with lower-priced phones of comparable or higher quality than our own. I've talked with several of the retailers that carry our lines, and they say the same. They are convinced that we can sell more if we lower our prices."
Larry: "They're right. If we could lower our prices by 10 to 15 percent, I think that we'd regain most ofour lost market share. But we also need to make sure that the quality of our products meets that of our competitors. As you know, we are spending a lot of money each month on rework and warranties. That worries me. I'd like to see that warranty cost cut by 70 to 80 percent. If we could do that, then customers would be more satisfied with our products, and I bet that we would not only regain our market share but increase it."
Jacob: "Lowering prices without lowering per-unit costs will not help us increase our profitability.
I think we need to improve our cost accounting system. I am not confident that we really know how much each of our product lines is costing us. It may be that we are overpricing some of our units because we are overcosting them. We may be underpricing other units."
Larry: "This sounds promising-especially if the overcosting is for some of our high-volume lines. A price decrease for these products would make the biggest difference-and if we knew they were overcosted, then we could offer immediate price reductions."
Bryce: "Jacob, I need more explanation. We have been using the same cost accounting system for the last 10 years. Why would it be a problem?"
Jacob: "I think that our manufacturing environment has changed. Over the years, we have added a lot of different product lines. Some of these products make very different demands on our manufacturing overhead resources. We trace-or attempt to trace-overhead costs to the different products using direct labor cost, a unit-based cost driver. We may be doing more allocation than tracing. If so, then we probably don't have a very good idea of our actual product costs. Also, as you know, with the way computer technology has changed over time, it is easier and cheaper to collect and use detailed information-information that will allow us to assign costs more accurately."
Bryce: "This may be something we should explore. Jacob, what do you suggest?"
Jacob: "If we want more accurate product costs and if we really want to get in the cost reduction business, then we need to understand how costs behave. In particular, we need to understand activity cost behavior. Knowing what activities we perform, why we perform them, and how well we perform them will help us identify areas for improvement. We also need to know how the different products consume activity resources. What this boils down to is the need to use an activity-based management system. But before we jump into this, we need some idea of whether non-unit-based drivers add anything. Activity-based management is not an inexpensive undertaking. So I suggest that we do a preliminary study to see if direct labor cost is adequate for tracing. If not, then maybe some non-unit-drivers might be needed. In fact, if you would like,
I can gather some data that will provide some evidence on the usefulness of the activity-based approach."
Bryce: "What do you think, Kim? It's your division."
Kim: "What Jacob has said sounds promising. I think he should pursue it and do so quickly. I also think that we need to look at improving our quality. It sounds like we have a problem there. If quality could be improved, then our costs will drop. I'll talk to our quality people. Jacob, in the meantime, find out for us if moving to an activity-based system is the way to go. How much time do you need?"
Jacob: "I have already been gathering data. I could probably have a report within two weeks."

Based on my initial analysis, I am confident that an ABC system will offer significant improvement. For one of our conventional phone plants, I regressed total monthly overhead cost on monthly direct labor cost using the following 15 months of data:

The results were revealing. Although direct labor cost appears to be a driver of overhead cost, it really doesn't explain a lot of the variation. I then searched for other drivers-particularly non-unit drivers-that might offer more insight into overhead cost behavior. Every time a batch is produced, material movement occurs, regardless of the size of the batch. The number of moves seemed like a more logical driver. I was able to gather only 10 months of data for this. (Our information system doesn't provide the number of moves, so I had to build the data set by interviewing production personnel.) This information is provided next:

The regression results were impressive. There is no question in my mind that the number of moves is a good driver of materials-handling costs. Using the number of moves to assign materials-handling costs to products would likely be better than the cost assignment using direct labor cost. Furthermore, since small batches use the same number of moves as large batches, we have some evidence that we may be overcosting our high-volume products.
I looked at one more overhead activity: inspecting products. We have 15 inspectors who are paid an average of $4,000 per month. Each inspector offers about 160 hours of inspection capacity per month. However, it appears that they actually work only about 80 percent of those hours. The drop in demand we have experienced explains this idle time. I see no evidence of variable cost behavior here. I'm not exactly sure how to treat inspection cost, but I think that it is more related to inspection hours than direct labor cost. Some of the other overhead activities seem to be non-unit-level, as well-enough, in fact, to be concerned about how we assign costs.
After receiving the memo, Kim was intrigued. She then asked Jacob to use the same phone plant as a pilot for a preliminary ABC analysis. She instructed him to assign all overhead costs to the plant's two products (Regular and Deluxe models), using only four activities. The four activities were rework, moving materials, inspecting products, and a general catch-all activity labeled "other manufacturing activities." From the special study already performed, she knew that materials handling and inspecting involved significant cost; from production reports, she also knew that the rework activity involved significant cost. If the ABC and unit-based cost assignments did not differ by breaking out these three major activities, then ABC may not matter.
Pursuant to the request, Jacob produced the following cost and driver information:
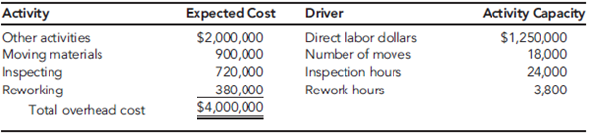
Expected activity demands:

Required
The Phone Division has been using the same cost accounting system for over 10 years. Explain why its cost accounting system may be outmoded. What factors determine when a new cost accounting system is warranted?
The Cable Service Division reported the following activity for the month of March:
The unit costs are divided as follows: 70 percent production and 30 percent marketing and customer service. Direct labor cost is the only driver used for tracing. Typically, the division uses only production costs to define unit costs. The preceding unit product cost information was provided at the request of the marketing manager and was the result of a special study.
Bryce Youngers, the president of CTB, is reasonably satisfied with the performance of the Cable Service Division. March's performance is fairly typical of what has been happening over the past two years. The Phone Division, however, is another matter. Its overall profit performance has been declining. Two years ago, income before income taxes had been about 25 percent of sales. March's dismal performance was also typical for what has been happening this year and is expected to continue-unless some action by management is taken to reverse the trend. During March, the Phone Division reported the following results:
During March, the Phone Division purchased materials totaling $312,000. There are no significant inventories of supplies (beginning or ending). Supplies are accounted for separately from materials. CTB's Phone Division had sales totaling $1,170,000 for March.
Based on March's results, Bryce decided to meet with three of the Phone Division's managers: Kim Breashears, divisional manager; Jacob Carder, divisional controller; and Larry Hartley, sales manager. A transcript of their recorded conversation is given next:
Bryce: "March's profit performance is down once again, and I think we need to see if we can identify the problem and correct it-before it's too late. Kim, what's your assessment of the situation?"
Kim: "Foreign competition is eating us alive. They are coming in with lower-priced phones of comparable or higher quality than our own. I've talked with several of the retailers that carry our lines, and they say the same. They are convinced that we can sell more if we lower our prices."
Larry: "They're right. If we could lower our prices by 10 to 15 percent, I think that we'd regain most ofour lost market share. But we also need to make sure that the quality of our products meets that of our competitors. As you know, we are spending a lot of money each month on rework and warranties. That worries me. I'd like to see that warranty cost cut by 70 to 80 percent. If we could do that, then customers would be more satisfied with our products, and I bet that we would not only regain our market share but increase it."
Jacob: "Lowering prices without lowering per-unit costs will not help us increase our profitability.
I think we need to improve our cost accounting system. I am not confident that we really know how much each of our product lines is costing us. It may be that we are overpricing some of our units because we are overcosting them. We may be underpricing other units."
Larry: "This sounds promising-especially if the overcosting is for some of our high-volume lines. A price decrease for these products would make the biggest difference-and if we knew they were overcosted, then we could offer immediate price reductions."
Bryce: "Jacob, I need more explanation. We have been using the same cost accounting system for the last 10 years. Why would it be a problem?"
Jacob: "I think that our manufacturing environment has changed. Over the years, we have added a lot of different product lines. Some of these products make very different demands on our manufacturing overhead resources. We trace-or attempt to trace-overhead costs to the different products using direct labor cost, a unit-based cost driver. We may be doing more allocation than tracing. If so, then we probably don't have a very good idea of our actual product costs. Also, as you know, with the way computer technology has changed over time, it is easier and cheaper to collect and use detailed information-information that will allow us to assign costs more accurately."
Bryce: "This may be something we should explore. Jacob, what do you suggest?"
Jacob: "If we want more accurate product costs and if we really want to get in the cost reduction business, then we need to understand how costs behave. In particular, we need to understand activity cost behavior. Knowing what activities we perform, why we perform them, and how well we perform them will help us identify areas for improvement. We also need to know how the different products consume activity resources. What this boils down to is the need to use an activity-based management system. But before we jump into this, we need some idea of whether non-unit-based drivers add anything. Activity-based management is not an inexpensive undertaking. So I suggest that we do a preliminary study to see if direct labor cost is adequate for tracing. If not, then maybe some non-unit-drivers might be needed. In fact, if you would like,
I can gather some data that will provide some evidence on the usefulness of the activity-based approach."
Bryce: "What do you think, Kim? It's your division."
Kim: "What Jacob has said sounds promising. I think he should pursue it and do so quickly. I also think that we need to look at improving our quality. It sounds like we have a problem there. If quality could be improved, then our costs will drop. I'll talk to our quality people. Jacob, in the meantime, find out for us if moving to an activity-based system is the way to go. How much time do you need?"
Jacob: "I have already been gathering data. I could probably have a report within two weeks."
Based on my initial analysis, I am confident that an ABC system will offer significant improvement. For one of our conventional phone plants, I regressed total monthly overhead cost on monthly direct labor cost using the following 15 months of data:
The results were revealing. Although direct labor cost appears to be a driver of overhead cost, it really doesn't explain a lot of the variation. I then searched for other drivers-particularly non-unit drivers-that might offer more insight into overhead cost behavior. Every time a batch is produced, material movement occurs, regardless of the size of the batch. The number of moves seemed like a more logical driver. I was able to gather only 10 months of data for this. (Our information system doesn't provide the number of moves, so I had to build the data set by interviewing production personnel.) This information is provided next:
The regression results were impressive. There is no question in my mind that the number of moves is a good driver of materials-handling costs. Using the number of moves to assign materials-handling costs to products would likely be better than the cost assignment using direct labor cost. Furthermore, since small batches use the same number of moves as large batches, we have some evidence that we may be overcosting our high-volume products.
I looked at one more overhead activity: inspecting products. We have 15 inspectors who are paid an average of $4,000 per month. Each inspector offers about 160 hours of inspection capacity per month. However, it appears that they actually work only about 80 percent of those hours. The drop in demand we have experienced explains this idle time. I see no evidence of variable cost behavior here. I'm not exactly sure how to treat inspection cost, but I think that it is more related to inspection hours than direct labor cost. Some of the other overhead activities seem to be non-unit-level, as well-enough, in fact, to be concerned about how we assign costs.
After receiving the memo, Kim was intrigued. She then asked Jacob to use the same phone plant as a pilot for a preliminary ABC analysis. She instructed him to assign all overhead costs to the plant's two products (Regular and Deluxe models), using only four activities. The four activities were rework, moving materials, inspecting products, and a general catch-all activity labeled "other manufacturing activities." From the special study already performed, she knew that materials handling and inspecting involved significant cost; from production reports, she also knew that the rework activity involved significant cost. If the ABC and unit-based cost assignments did not differ by breaking out these three major activities, then ABC may not matter.
Pursuant to the request, Jacob produced the following cost and driver information:
Expected activity demands:
Required
The Phone Division has been using the same cost accounting system for over 10 years. Explain why its cost accounting system may be outmoded. What factors determine when a new cost accounting system is warranted?
Question
Beauville Furniture Corporation produces sofas, recliners, and lounge chairs. Beauville is located in a medium-sized community in the southeastern part of the United States. It is a major employer in the community. In fact, the economic well-being of the community is tied very strongly to Beauville. Beauville operates a sawmill, a fabric plant, and a furniture plant in the same community.
The sawmill buys logs from independent producers. The sawmill then processes the logs into four grades of lumber: firsts and seconds, No. 1 common, No. 2 common, and No. 3 common. All costs incurred in the mill are common to the four grades of lumber. All four grades of lumber are used by the furniture plant. The mill transfers everything it produces to the furniture plant, and the grades are transferred at cost. Trucks are used to move the lumber from the mill to the furniture plant. Although no outside sales exist, the mill could sell to external customers, and the selling prices of the four grades are known.
The fabric plant is responsible for producing the fabric that is used by the furniture plant. To produce three totally different fabrics (identified by fabric ID codes FB60, FB70, and FB80, respectively), the plant has three separate production operations-one for each fabric. Thus, production of all three fabrics occurs at the same time in different locations in the plant. Each fabric's production operation has two processes: the weaving and pattern process and the coloring and bolting process. In the weaving and pattern process, yarn is used to create yards of fabric with different designs. In the next process, the fabric is dyed, cut into 25-yard sections, and wrapped around cardboard rods to form 25-yard bolts. The bolts are transported by forklift to the furniture plant's Receiving Department. All of the output of the fabric plant is used by the furniture plant (to produce the sofas and chairs). For accounting purposes, the fabric is transferred at cost to the furniture plant.
The furniture plant produces orders for customers on a special-order basis. The customers specify the quantity, style, fabric, lumber grade, and pattern. Typically, jobs are large (involving at least 500 units). The plant has two production departments: Cutting and Assembly. In the Cutting Department, the fabric and wooden frame components are sized and cut. Other components are purchased from external suppliers and are removed from stores as needed for assembly. After the fabric and wooden components are finished for the entire job, they are moved to the Assembly Department. The Assembly Department takes the individual components and assembles the sofas (or chairs).
Beauville Furniture has been in business for over two decades and has a good reputation. However, during the past five years, Beauville experienced eroding profits and declining sales. Bids were increasingly lost (even aggressive bids) on the more popular models. Yet, the company was winning bids on some of the more-difficult-to-produce items. Lance Hays, the owner and manager, was frustrated. He simply couldn't understand how some of his competitors could sell for such low prices. On a common sofa job involving 500 units, Beauville's bids were running $25 per unit, or $12,500 per job more than the winning bids (on average). Yet, on the more difficult items, Beauville's bids were running about $60 per unit less than the next closest bid. Gisela Berling, vice president of finance, was assigned the task of preparing a cost analysis of the company's product lines. Lance wanted to know if the company's costs were excessive. Perhaps the company was being wasteful, and it was simply costing more to produce furniture than it was costing its competitors.
Gisela prepared herself by reading recent literature on cost management and product costing and attending several conferences that explored the same issues. She then reviewed the costing procedures of the company's mill and two plants and did a preliminary assessment of their soundness. The production costs of the mill were common to all lumber grades and were assigned using the physical units method. Since the output and production costs were fairly uniform throughout the year, the mill used an actual costing system. Although Gisela had no difficulty with actual costing, she decided to explore the effects of using the sales-value-at-split-off method. Thus, cost and production data for the mill were gathered so that an analysis could be conducted. The two plants used normal costing systems. The fabric plant used process costing, and the furniture plant used job-order costing. Both plants used plantwide overhead rates based on direct labor hours. Based on her initial reviews, she concluded that the costing procedures for the fabric plant were satisfactory. Essentially, there was no evidence of product diversity. A statistical analysis revealed that about 90 percent of the variability in the plant's overhead cost could be explained by direct labor hours. Thus, the use of a plantwide overhead rate based on direct labor hours seemed justified. What did concern her, though, was the material waste that she observed in the plant. Maybe a standard cost system would be useful for increasing the overall cost efficiency of the plant. Consequently, as part of her report to Lance, she decided to include a description of the fabric plant's costing procedures-at least for one of the fabric types. She also decided to develop a standard cost sheet for the chosen fabric. The furniture plant, however, was a more difficult matter. Product diversity was present and could be causing some distortions in product costs. Furthermore, statistical analysis revealed that only about 40 percent of the variability in overhead cost was explained by the direct labor hours. She decided that additional analysis was needed so that a sound product costing method could be recommended. One possibility would be to increase the number of overhead rates. Thus, she decided to include departmental data so that the effect of moving to departmental rates could be assessed. Finally, she also wanted to explore the possibility of converting the sawmill and fabric plant into profit centers and changing the existing transfer pricing policy.
With the cooperation of the cost accounting manager for the mill and each plant's controller, she gathered the following data for last year:
Sawmill:
Joint manufacturing costs: $900,000

Fabric Plant:
Budgeted overhead: $1,200,000 (50% fixed)
Practical volume (direct labor hours): 120,000 hours
Actual overhead: $1,150,000 (50% fixed)
Actual hours worked:

Departmental data on Fabric FB70 (actual costs and actual outcomes):


*Unitsare measured in yards for the Weaving and Pattern Department and in bolts forthe Coloring and Bolting Department. Note: With the exception of the cardboard bolt rods, materials are added at the beginning of each process. The cost of the rods is relatively insignificant and is included in overhead.
Proposed standard cost sheet for Fabric FB70 (for the Coloring and Bolting Department only):

Furniture Plant:
Departmental data (budgeted):

After some discussion with the furniture plant controller, Gisela decided to use machine hours to calculate the overhead rate for the Cutting Department and direct labor hours for the Assembly Department rate (the Cutting Department was more automated than the Assembly Department). As part of her report, she wanted to compare the effects of plantwide rates and departmental rates on the cost of jobs. She wanted to know if overhead costing could be the source of the pricing problems the company was experiencing.
To assess the effect of the different overhead assignment procedures, Gisela decided to examine two prospective jobs. One job, Job A500, could produce 500 sofas, using a frequently requested style and Fabric FB70. Bids on this type of job were being lost more frequently to competitors. The second job, Job B75, would produce 75 specially designed recliners. This job involved a new design and was more difficult for the workers to build. It involved some special cutting requirements and an unfamiliar assembly. Recently, the company seemed to be winning more bids on jobs of this type. To compute the costs of the two jobs, Gisela assembled the following information on the two jobs:
Job A500:

Job B75:

Required
Suppose that the fabric plant is set up as a profit center. Bolts of Fabric FB70 sell for $400 (or can be bought for $400 from outside suppliers). The fabric plant and the furniture plant both have excess capacity. Assume that Job A500 is a special order. The fabric and furniture plants have sufficient excess capacity to satisfy the demands of Job A500. What is the minimum transfer price for a bolt of FB70? If the maximum transfer price is $400, by how much do the fabric plant's profits increase if the two profit centers negotiate a transfer price that splits the joint benefit?
The sawmill buys logs from independent producers. The sawmill then processes the logs into four grades of lumber: firsts and seconds, No. 1 common, No. 2 common, and No. 3 common. All costs incurred in the mill are common to the four grades of lumber. All four grades of lumber are used by the furniture plant. The mill transfers everything it produces to the furniture plant, and the grades are transferred at cost. Trucks are used to move the lumber from the mill to the furniture plant. Although no outside sales exist, the mill could sell to external customers, and the selling prices of the four grades are known.
The fabric plant is responsible for producing the fabric that is used by the furniture plant. To produce three totally different fabrics (identified by fabric ID codes FB60, FB70, and FB80, respectively), the plant has three separate production operations-one for each fabric. Thus, production of all three fabrics occurs at the same time in different locations in the plant. Each fabric's production operation has two processes: the weaving and pattern process and the coloring and bolting process. In the weaving and pattern process, yarn is used to create yards of fabric with different designs. In the next process, the fabric is dyed, cut into 25-yard sections, and wrapped around cardboard rods to form 25-yard bolts. The bolts are transported by forklift to the furniture plant's Receiving Department. All of the output of the fabric plant is used by the furniture plant (to produce the sofas and chairs). For accounting purposes, the fabric is transferred at cost to the furniture plant.
The furniture plant produces orders for customers on a special-order basis. The customers specify the quantity, style, fabric, lumber grade, and pattern. Typically, jobs are large (involving at least 500 units). The plant has two production departments: Cutting and Assembly. In the Cutting Department, the fabric and wooden frame components are sized and cut. Other components are purchased from external suppliers and are removed from stores as needed for assembly. After the fabric and wooden components are finished for the entire job, they are moved to the Assembly Department. The Assembly Department takes the individual components and assembles the sofas (or chairs).
Beauville Furniture has been in business for over two decades and has a good reputation. However, during the past five years, Beauville experienced eroding profits and declining sales. Bids were increasingly lost (even aggressive bids) on the more popular models. Yet, the company was winning bids on some of the more-difficult-to-produce items. Lance Hays, the owner and manager, was frustrated. He simply couldn't understand how some of his competitors could sell for such low prices. On a common sofa job involving 500 units, Beauville's bids were running $25 per unit, or $12,500 per job more than the winning bids (on average). Yet, on the more difficult items, Beauville's bids were running about $60 per unit less than the next closest bid. Gisela Berling, vice president of finance, was assigned the task of preparing a cost analysis of the company's product lines. Lance wanted to know if the company's costs were excessive. Perhaps the company was being wasteful, and it was simply costing more to produce furniture than it was costing its competitors.
Gisela prepared herself by reading recent literature on cost management and product costing and attending several conferences that explored the same issues. She then reviewed the costing procedures of the company's mill and two plants and did a preliminary assessment of their soundness. The production costs of the mill were common to all lumber grades and were assigned using the physical units method. Since the output and production costs were fairly uniform throughout the year, the mill used an actual costing system. Although Gisela had no difficulty with actual costing, she decided to explore the effects of using the sales-value-at-split-off method. Thus, cost and production data for the mill were gathered so that an analysis could be conducted. The two plants used normal costing systems. The fabric plant used process costing, and the furniture plant used job-order costing. Both plants used plantwide overhead rates based on direct labor hours. Based on her initial reviews, she concluded that the costing procedures for the fabric plant were satisfactory. Essentially, there was no evidence of product diversity. A statistical analysis revealed that about 90 percent of the variability in the plant's overhead cost could be explained by direct labor hours. Thus, the use of a plantwide overhead rate based on direct labor hours seemed justified. What did concern her, though, was the material waste that she observed in the plant. Maybe a standard cost system would be useful for increasing the overall cost efficiency of the plant. Consequently, as part of her report to Lance, she decided to include a description of the fabric plant's costing procedures-at least for one of the fabric types. She also decided to develop a standard cost sheet for the chosen fabric. The furniture plant, however, was a more difficult matter. Product diversity was present and could be causing some distortions in product costs. Furthermore, statistical analysis revealed that only about 40 percent of the variability in overhead cost was explained by the direct labor hours. She decided that additional analysis was needed so that a sound product costing method could be recommended. One possibility would be to increase the number of overhead rates. Thus, she decided to include departmental data so that the effect of moving to departmental rates could be assessed. Finally, she also wanted to explore the possibility of converting the sawmill and fabric plant into profit centers and changing the existing transfer pricing policy.
With the cooperation of the cost accounting manager for the mill and each plant's controller, she gathered the following data for last year:
Sawmill:
Joint manufacturing costs: $900,000
Fabric Plant:
Budgeted overhead: $1,200,000 (50% fixed)
Practical volume (direct labor hours): 120,000 hours
Actual overhead: $1,150,000 (50% fixed)
Actual hours worked:
Departmental data on Fabric FB70 (actual costs and actual outcomes):
*Unitsare measured in yards for the Weaving and Pattern Department and in bolts forthe Coloring and Bolting Department. Note: With the exception of the cardboard bolt rods, materials are added at the beginning of each process. The cost of the rods is relatively insignificant and is included in overhead.
Proposed standard cost sheet for Fabric FB70 (for the Coloring and Bolting Department only):
Furniture Plant:
Departmental data (budgeted):
After some discussion with the furniture plant controller, Gisela decided to use machine hours to calculate the overhead rate for the Cutting Department and direct labor hours for the Assembly Department rate (the Cutting Department was more automated than the Assembly Department). As part of her report, she wanted to compare the effects of plantwide rates and departmental rates on the cost of jobs. She wanted to know if overhead costing could be the source of the pricing problems the company was experiencing.
To assess the effect of the different overhead assignment procedures, Gisela decided to examine two prospective jobs. One job, Job A500, could produce 500 sofas, using a frequently requested style and Fabric FB70. Bids on this type of job were being lost more frequently to competitors. The second job, Job B75, would produce 75 specially designed recliners. This job involved a new design and was more difficult for the workers to build. It involved some special cutting requirements and an unfamiliar assembly. Recently, the company seemed to be winning more bids on jobs of this type. To compute the costs of the two jobs, Gisela assembled the following information on the two jobs:
Job A500:
Job B75:
Required
Suppose that the fabric plant is set up as a profit center. Bolts of Fabric FB70 sell for $400 (or can be bought for $400 from outside suppliers). The fabric plant and the furniture plant both have excess capacity. Assume that Job A500 is a special order. The fabric and furniture plants have sufficient excess capacity to satisfy the demands of Job A500. What is the minimum transfer price for a bolt of FB70? If the maximum transfer price is $400, by how much do the fabric plant's profits increase if the two profit centers negotiate a transfer price that splits the joint benefit?
Question
CableTech Bell Corporation (CTB) operates in the telecommunications industry. CTB has two divisions: the Phone Division and the Cable Service Division. The Phone Division manufactures telephones in several plants located in the Midwest. The product lines run from relatively inexpensive touch-tone wall and desk phones to expensive, high-quality cellular phones. CTB also operates a cable TV service in Ohio. The Cable Service Division offers three products: a basic package with 25 channels; an enhanced package, which is the basic package plus 15 additional channels and two movie channels; and a premium package, which is the basic package plus 25 additional channels and three movie channels.
The Cable Service Division reported the following activity for the month of March:

The unit costs are divided as follows: 70 percent production and 30 percent marketing and customer service. Direct labor cost is the only driver used for tracing. Typically, the division uses only production costs to define unit costs. The preceding unit product cost information was provided at the request of the marketing manager and was the result of a special study.
Bryce Youngers, the president of CTB, is reasonably satisfied with the performance of the Cable Service Division. March's performance is fairly typical of what has been happening over the past two years. The Phone Division, however, is another matter. Its overall profit performance has been declining. Two years ago, income before income taxes had been about 25 percent of sales. March's dismal performance was also typical for what has been happening this year and is expected to continue-unless some action by management is taken to reverse the trend. During March, the Phone Division reported the following results:


During March, the Phone Division purchased materials totaling $312,000. There are no significant inventories of supplies (beginning or ending). Supplies are accounted for separately from materials. CTB's Phone Division had sales totaling $1,170,000 for March.
Based on March's results, Bryce decided to meet with three of the Phone Division's managers: Kim Breashears, divisional manager; Jacob Carder, divisional controller; and Larry Hartley, sales manager. A transcript of their recorded conversation is given next:
Bryce: "March's profit performance is down once again, and I think we need to see if we can identify the problem and correct it-before it's too late. Kim, what's your assessment of the situation?"
Kim: "Foreign competition is eating us alive. They are coming in with lower-priced phones of comparable or higher quality than our own. I've talked with several of the retailers that carry our lines, and they say the same. They are convinced that we can sell more if we lower our prices."
Larry: "They're right. If we could lower our prices by 10 to 15 percent, I think that we'd regain most ofour lost market share. But we also need to make sure that the quality of our products meets that of our competitors. As you know, we are spending a lot of money each month on rework and warranties. That worries me. I'd like to see that warranty cost cut by 70 to 80 percent. If we could do that, then customers would be more satisfied with our products, and I bet that we would not only regain our market share but increase it."
Jacob: "Lowering prices without lowering per-unit costs will not help us increase our profitability.
I think we need to improve our cost accounting system. I am not confident that we really know how much each of our product lines is costing us. It may be that we are overpricing some of our units because we are overcosting them. We may be underpricing other units."
Larry: "This sounds promising-especially if the overcosting is for some of our high-volume lines. A price decrease for these products would make the biggest difference-and if we knew they were overcosted, then we could offer immediate price reductions."
Bryce: "Jacob, I need more explanation. We have been using the same cost accounting system for the last 10 years. Why would it be a problem?"
Jacob: "I think that our manufacturing environment has changed. Over the years, we have added a lot of different product lines. Some of these products make very different demands on our manufacturing overhead resources. We trace-or attempt to trace-overhead costs to the different products using direct labor cost, a unit-based cost driver. We may be doing more allocation than tracing. If so, then we probably don't have a very good idea of our actual product costs. Also, as you know, with the way computer technology has changed over time, it is easier and cheaper to collect and use detailed information-information that will allow us to assign costs more accurately."
Bryce: "This may be something we should explore. Jacob, what do you suggest?"
Jacob: "If we want more accurate product costs and if we really want to get in the cost reduction business, then we need to understand how costs behave. In particular, we need to understand activity cost behavior. Knowing what activities we perform, why we perform them, and how well we perform them will help us identify areas for improvement. We also need to know how the different products consume activity resources. What this boils down to is the need to use an activity-based management system. But before we jump into this, we need some idea of whether non-unit-based drivers add anything. Activity-based management is not an inexpensive undertaking. So I suggest that we do a preliminary study to see if direct labor cost is adequate for tracing. If not, then maybe some non-unit-drivers might be needed. In fact, if you would like,
I can gather some data that will provide some evidence on the usefulness of the activity-based approach."
Bryce: "What do you think, Kim? It's your division."
Kim: "What Jacob has said sounds promising. I think he should pursue it and do so quickly. I also think that we need to look at improving our quality. It sounds like we have a problem there. If quality could be improved, then our costs will drop. I'll talk to our quality people. Jacob, in the meantime, find out for us if moving to an activity-based system is the way to go. How much time do you need?"
Jacob: "I have already been gathering data. I could probably have a report within two weeks."

Based on my initial analysis, I am confident that an ABC system will offer significant improvement. For one of our conventional phone plants, I regressed total monthly overhead cost on monthly direct labor cost using the following 15 months of data:

The results were revealing. Although direct labor cost appears to be a driver of overhead cost, it really doesn't explain a lot of the variation. I then searched for other drivers-particularly non-unit drivers-that might offer more insight into overhead cost behavior. Every time a batch is produced, material movement occurs, regardless of the size of the batch. The number of moves seemed like a more logical driver. I was able to gather only 10 months of data for this. (Our information system doesn't provide the number of moves, so I had to build the data set by interviewing production personnel.) This information is provided next:

The regression results were impressive. There is no question in my mind that the number of moves is a good driver of materials-handling costs. Using the number of moves to assign materials-handling costs to products would likely be better than the cost assignment using direct labor cost. Furthermore, since small batches use the same number of moves as large batches, we have some evidence that we may be overcosting our high-volume products.
I looked at one more overhead activity: inspecting products. We have 15 inspectors who are paid an average of $4,000 per month. Each inspector offers about 160 hours of inspection capacity per month. However, it appears that they actually work only about 80 percent of those hours. The drop in demand we have experienced explains this idle time. I see no evidence of variable cost behavior here. I'm not exactly sure how to treat inspection cost, but I think that it is more related to inspection hours than direct labor cost. Some of the other overhead activities seem to be non-unit-level, as well-enough, in fact, to be concerned about how we assign costs.
After receiving the memo, Kim was intrigued. She then asked Jacob to use the same phone plant as a pilot for a preliminary ABC analysis. She instructed him to assign all overhead costs to the plant's two products (Regular and Deluxe models), using only four activities. The four activities were rework, moving materials, inspecting products, and a general catch-all activity labeled "other manufacturing activities." From the special study already performed, she knew that materials handling and inspecting involved significant cost; from production reports, she also knew that the rework activity involved significant cost. If the ABC and unit-based cost assignments did not differ by breaking out these three major activities, then ABC may not matter.
Pursuant to the request, Jacob produced the following cost and driver information:

Expected activity demands:

Required
Using the method of least squares, calculate two cost formulas: one for overhead using direct labor cost as the driver, and one for materials handling cost using number of moves as the driver. Comment on Jacob Carder's observations concerning the outcomes.
The Cable Service Division reported the following activity for the month of March:
The unit costs are divided as follows: 70 percent production and 30 percent marketing and customer service. Direct labor cost is the only driver used for tracing. Typically, the division uses only production costs to define unit costs. The preceding unit product cost information was provided at the request of the marketing manager and was the result of a special study.
Bryce Youngers, the president of CTB, is reasonably satisfied with the performance of the Cable Service Division. March's performance is fairly typical of what has been happening over the past two years. The Phone Division, however, is another matter. Its overall profit performance has been declining. Two years ago, income before income taxes had been about 25 percent of sales. March's dismal performance was also typical for what has been happening this year and is expected to continue-unless some action by management is taken to reverse the trend. During March, the Phone Division reported the following results:
During March, the Phone Division purchased materials totaling $312,000. There are no significant inventories of supplies (beginning or ending). Supplies are accounted for separately from materials. CTB's Phone Division had sales totaling $1,170,000 for March.
Based on March's results, Bryce decided to meet with three of the Phone Division's managers: Kim Breashears, divisional manager; Jacob Carder, divisional controller; and Larry Hartley, sales manager. A transcript of their recorded conversation is given next:
Bryce: "March's profit performance is down once again, and I think we need to see if we can identify the problem and correct it-before it's too late. Kim, what's your assessment of the situation?"
Kim: "Foreign competition is eating us alive. They are coming in with lower-priced phones of comparable or higher quality than our own. I've talked with several of the retailers that carry our lines, and they say the same. They are convinced that we can sell more if we lower our prices."
Larry: "They're right. If we could lower our prices by 10 to 15 percent, I think that we'd regain most ofour lost market share. But we also need to make sure that the quality of our products meets that of our competitors. As you know, we are spending a lot of money each month on rework and warranties. That worries me. I'd like to see that warranty cost cut by 70 to 80 percent. If we could do that, then customers would be more satisfied with our products, and I bet that we would not only regain our market share but increase it."
Jacob: "Lowering prices without lowering per-unit costs will not help us increase our profitability.
I think we need to improve our cost accounting system. I am not confident that we really know how much each of our product lines is costing us. It may be that we are overpricing some of our units because we are overcosting them. We may be underpricing other units."
Larry: "This sounds promising-especially if the overcosting is for some of our high-volume lines. A price decrease for these products would make the biggest difference-and if we knew they were overcosted, then we could offer immediate price reductions."
Bryce: "Jacob, I need more explanation. We have been using the same cost accounting system for the last 10 years. Why would it be a problem?"
Jacob: "I think that our manufacturing environment has changed. Over the years, we have added a lot of different product lines. Some of these products make very different demands on our manufacturing overhead resources. We trace-or attempt to trace-overhead costs to the different products using direct labor cost, a unit-based cost driver. We may be doing more allocation than tracing. If so, then we probably don't have a very good idea of our actual product costs. Also, as you know, with the way computer technology has changed over time, it is easier and cheaper to collect and use detailed information-information that will allow us to assign costs more accurately."
Bryce: "This may be something we should explore. Jacob, what do you suggest?"
Jacob: "If we want more accurate product costs and if we really want to get in the cost reduction business, then we need to understand how costs behave. In particular, we need to understand activity cost behavior. Knowing what activities we perform, why we perform them, and how well we perform them will help us identify areas for improvement. We also need to know how the different products consume activity resources. What this boils down to is the need to use an activity-based management system. But before we jump into this, we need some idea of whether non-unit-based drivers add anything. Activity-based management is not an inexpensive undertaking. So I suggest that we do a preliminary study to see if direct labor cost is adequate for tracing. If not, then maybe some non-unit-drivers might be needed. In fact, if you would like,
I can gather some data that will provide some evidence on the usefulness of the activity-based approach."
Bryce: "What do you think, Kim? It's your division."
Kim: "What Jacob has said sounds promising. I think he should pursue it and do so quickly. I also think that we need to look at improving our quality. It sounds like we have a problem there. If quality could be improved, then our costs will drop. I'll talk to our quality people. Jacob, in the meantime, find out for us if moving to an activity-based system is the way to go. How much time do you need?"
Jacob: "I have already been gathering data. I could probably have a report within two weeks."
Based on my initial analysis, I am confident that an ABC system will offer significant improvement. For one of our conventional phone plants, I regressed total monthly overhead cost on monthly direct labor cost using the following 15 months of data:
The results were revealing. Although direct labor cost appears to be a driver of overhead cost, it really doesn't explain a lot of the variation. I then searched for other drivers-particularly non-unit drivers-that might offer more insight into overhead cost behavior. Every time a batch is produced, material movement occurs, regardless of the size of the batch. The number of moves seemed like a more logical driver. I was able to gather only 10 months of data for this. (Our information system doesn't provide the number of moves, so I had to build the data set by interviewing production personnel.) This information is provided next:
The regression results were impressive. There is no question in my mind that the number of moves is a good driver of materials-handling costs. Using the number of moves to assign materials-handling costs to products would likely be better than the cost assignment using direct labor cost. Furthermore, since small batches use the same number of moves as large batches, we have some evidence that we may be overcosting our high-volume products.
I looked at one more overhead activity: inspecting products. We have 15 inspectors who are paid an average of $4,000 per month. Each inspector offers about 160 hours of inspection capacity per month. However, it appears that they actually work only about 80 percent of those hours. The drop in demand we have experienced explains this idle time. I see no evidence of variable cost behavior here. I'm not exactly sure how to treat inspection cost, but I think that it is more related to inspection hours than direct labor cost. Some of the other overhead activities seem to be non-unit-level, as well-enough, in fact, to be concerned about how we assign costs.
After receiving the memo, Kim was intrigued. She then asked Jacob to use the same phone plant as a pilot for a preliminary ABC analysis. She instructed him to assign all overhead costs to the plant's two products (Regular and Deluxe models), using only four activities. The four activities were rework, moving materials, inspecting products, and a general catch-all activity labeled "other manufacturing activities." From the special study already performed, she knew that materials handling and inspecting involved significant cost; from production reports, she also knew that the rework activity involved significant cost. If the ABC and unit-based cost assignments did not differ by breaking out these three major activities, then ABC may not matter.
Pursuant to the request, Jacob produced the following cost and driver information:
Expected activity demands:
Required
Using the method of least squares, calculate two cost formulas: one for overhead using direct labor cost as the driver, and one for materials handling cost using number of moves as the driver. Comment on Jacob Carder's observations concerning the outcomes.
Question
Zando Pharmaceuticals is an affiliate of the German-based Heisenberg Corporation, which employs 40,000 worldwide. Zando's St. Louis facility houses the U.S. corporate headquarters and Research and Development (R D). It produces 30 products, using 28 different batch processes. The facility has 2,000 employees on-site. In recent years, Zando's profitability has suffered, which can be attributed to increased competition, customer dissatisfaction, and regulatory pressures. Luis Alvarado, president of Zando, called a meeting to consider ways to improve profitability. He labeled the meeting a strategic planning session and invited the following officers: Kathy Shorts, environmental manager; Troy Lewis, head of R D; Johnny Mizukawa, vice president of production and quality; Larry Sower, vice president of finance; and Doreen Savara, marketing vice president.
Luis : "You all have received the quarterly financial reports for the last two years. The trends are negative. We are losing market share, profits are decreasing, and our costs seem to be increasing. We need to take actions to increase sales and reduce costs, and we need to do so as quickly as possible. Given our research strengths, it seems to me that our best bet is to grow revenues by introducing new products with proprietary rights. As far as costs are concerned, we need to improve our performance on that dimension as well. Lower per-unit costs for new and existing products are needed. Any suggestions?"
Troy : "For our products, our ability to control costs resides in development-my area-rather than manufacturing. We probably need to pay more attention to product and process design issues to ensure a reasonably level per-unit cost. Revenues are also affected in this stage. Once we patent a drug, the clock begins to tick, and we need to reduce time to market. Significantly, reducing time to market will allow us to generate revenues for a longer period of time than we are currently experiencing. It would also be helpful if we could reduce the cycle time for product development. Both actions would increase revenues. Finally, we can increase revenues by increasing the volume of new products."
Johnny : "There is a lot of merit to the observation that cost reduction opportunities reside mostly in product development. Once a drug is approved, its approval includes the manufacturing process. Any future changes in the manufacturing process require approval from the U.S. Food and Drug Administration. Because of this, we have been reluctant, historically, to engage in process improvement or reengineering. However, I wonder if we shouldn't reconsider this longstanding policy. Some of the quality problems we have could be corrected by changing some of our existing processes, and the costs saved may easily exceed any cost incurred from seeking FDA approval. I think our quality costs are at least 15 percent of sales. That's a lot of opportunity for improvement."
Kathy : "I agree that cost reduction-both in the product development stage and the manufacturing stage-should be a key strategic theme. The environmental area also offers some very good opportunities. A recent pollution prevention act passed by the legislature requires that we calculate the costs of generating hazardous substances for each process. This act was the incentive we needed to begin developing an environmental cost management system. The results so far indicate that environmental costs are much more than we realized. They are estimated to be in the range of 20 to 30 percent of total operating costs. Environmental costs can be reduced by such things as computerizing chemical inventory, eliminating the use of chlorinated solvents and other hazardous materials, reducing our use of virgin feedstocks, and redesigning processes and products so that we can reduce toxic residue release. We can really have a positive environmental impact while simultaneously reducing costs if more attention is paid to environmental issues during product development."
Doreen : "I like what I am hearing because I think that it also affects our ability to increase market share and revenues. For example, environmental impact is one of our major concerns. Some retail pharmacy chains pay particular attention to green products, and right now we are not competing well. Our environmental image is negative and needs to be improved. I am convinced that doing so will allow us to increase market share. Quality is another important matter. We have had to recall two batches of products during the past two years due to poor quality, and this has hurt our image more than the environmental issue. Improving the processes to avoid these kinds of problems will save us a lot of grief. Product image and reputation are essential to increasing customer satisfaction and market share."
Luis : "We started with the need to improve financial performance by increasing revenues and reducing costs. So far, we have some very good suggestions to help achieve these two objectives, but I have some concerns. First, do we have the talent and capabilities to improve quality and environmental performance? Troy, do your professionals really understand what they need to do to improve process and product designs so that we can see the desired quality and environmental improvements? Also, how can we reduce the cycle time for products and the time to market once patented?"
Troy : "Let me answer those questions in order. First, we probably are lacking the understanding on the design issues. We will need to do some training to help our research scientists and chemical engineers understand the consequences. We may need to hire a couple of professionals who have experience in dealing with these issues. Second, we may need to make cycle time and time to market significant performance measures and reward our people for actions that reduce those measures. Our employees need to align their interests with those of the company. If we can achieve this, we should see more revenue produced per employee."
Luis : "Good. Now, Johnny, tell us about production and quality. Do our manufacturing engineers and production workers need help with environmental and quality issues?"
Johnny : "Without question, training will be needed. Moreover, I really need to hire a couple of quality engineers."
Kathy : "I also think that we need an environmental engineer with experience in pharmaceutical manufacturing processes."
Luis : "Good. We certainly shouldn't ignore the necessary infrastructure to bring about the needed changes. Larry, you have been relatively quiet, what do you think about all this? Do you have any suggestions?"
Larry : "Infrastructure is important. If this is all going to work, timely and accurate information will be needed. It is hard to design products and processes with cost being a significant issue without providing the right kind of cost information. We are in the process of revamping the cost management information system so that it is activity based and so that we can provide quality and environmental cost information. After listening to the comments made here, I might also suggest that we need a strategic measurement system that can be used to align the interests of our employees with our improvement strategy. People need to know what is important, that the important factors are being measured, and that they are going to be evaluated and rewarded based on these factors. Finally, I would encourage the use of target costing to help manage costs during product development. To help you all understand the importance of good information, I have assembled some activity data relating to two new products currently under development. These two products will use the same process, using different setups. The data are organized into resource, activity, and cost object modules with an accompanying list of activity drivers to facilitate the use of an ABC software package recently acquired by Zando."
Resource Module (Projected General Ledger Costs of Manufacturing Process Associated with the Two Products)

Activity Module

Cost Object Module (Products and Projected Activity Usage)

List of Activity Drivers

Required
Use the comments from the executive meeting to identify strategic objectives and possible performance measures for each of five perspectives: financial, customer, environmental, process, and learning and growth. Would you recommend the Balanced Scorecard for Zando? Why?
Luis : "You all have received the quarterly financial reports for the last two years. The trends are negative. We are losing market share, profits are decreasing, and our costs seem to be increasing. We need to take actions to increase sales and reduce costs, and we need to do so as quickly as possible. Given our research strengths, it seems to me that our best bet is to grow revenues by introducing new products with proprietary rights. As far as costs are concerned, we need to improve our performance on that dimension as well. Lower per-unit costs for new and existing products are needed. Any suggestions?"
Troy : "For our products, our ability to control costs resides in development-my area-rather than manufacturing. We probably need to pay more attention to product and process design issues to ensure a reasonably level per-unit cost. Revenues are also affected in this stage. Once we patent a drug, the clock begins to tick, and we need to reduce time to market. Significantly, reducing time to market will allow us to generate revenues for a longer period of time than we are currently experiencing. It would also be helpful if we could reduce the cycle time for product development. Both actions would increase revenues. Finally, we can increase revenues by increasing the volume of new products."
Johnny : "There is a lot of merit to the observation that cost reduction opportunities reside mostly in product development. Once a drug is approved, its approval includes the manufacturing process. Any future changes in the manufacturing process require approval from the U.S. Food and Drug Administration. Because of this, we have been reluctant, historically, to engage in process improvement or reengineering. However, I wonder if we shouldn't reconsider this longstanding policy. Some of the quality problems we have could be corrected by changing some of our existing processes, and the costs saved may easily exceed any cost incurred from seeking FDA approval. I think our quality costs are at least 15 percent of sales. That's a lot of opportunity for improvement."
Kathy : "I agree that cost reduction-both in the product development stage and the manufacturing stage-should be a key strategic theme. The environmental area also offers some very good opportunities. A recent pollution prevention act passed by the legislature requires that we calculate the costs of generating hazardous substances for each process. This act was the incentive we needed to begin developing an environmental cost management system. The results so far indicate that environmental costs are much more than we realized. They are estimated to be in the range of 20 to 30 percent of total operating costs. Environmental costs can be reduced by such things as computerizing chemical inventory, eliminating the use of chlorinated solvents and other hazardous materials, reducing our use of virgin feedstocks, and redesigning processes and products so that we can reduce toxic residue release. We can really have a positive environmental impact while simultaneously reducing costs if more attention is paid to environmental issues during product development."
Doreen : "I like what I am hearing because I think that it also affects our ability to increase market share and revenues. For example, environmental impact is one of our major concerns. Some retail pharmacy chains pay particular attention to green products, and right now we are not competing well. Our environmental image is negative and needs to be improved. I am convinced that doing so will allow us to increase market share. Quality is another important matter. We have had to recall two batches of products during the past two years due to poor quality, and this has hurt our image more than the environmental issue. Improving the processes to avoid these kinds of problems will save us a lot of grief. Product image and reputation are essential to increasing customer satisfaction and market share."
Luis : "We started with the need to improve financial performance by increasing revenues and reducing costs. So far, we have some very good suggestions to help achieve these two objectives, but I have some concerns. First, do we have the talent and capabilities to improve quality and environmental performance? Troy, do your professionals really understand what they need to do to improve process and product designs so that we can see the desired quality and environmental improvements? Also, how can we reduce the cycle time for products and the time to market once patented?"
Troy : "Let me answer those questions in order. First, we probably are lacking the understanding on the design issues. We will need to do some training to help our research scientists and chemical engineers understand the consequences. We may need to hire a couple of professionals who have experience in dealing with these issues. Second, we may need to make cycle time and time to market significant performance measures and reward our people for actions that reduce those measures. Our employees need to align their interests with those of the company. If we can achieve this, we should see more revenue produced per employee."
Luis : "Good. Now, Johnny, tell us about production and quality. Do our manufacturing engineers and production workers need help with environmental and quality issues?"
Johnny : "Without question, training will be needed. Moreover, I really need to hire a couple of quality engineers."
Kathy : "I also think that we need an environmental engineer with experience in pharmaceutical manufacturing processes."
Luis : "Good. We certainly shouldn't ignore the necessary infrastructure to bring about the needed changes. Larry, you have been relatively quiet, what do you think about all this? Do you have any suggestions?"
Larry : "Infrastructure is important. If this is all going to work, timely and accurate information will be needed. It is hard to design products and processes with cost being a significant issue without providing the right kind of cost information. We are in the process of revamping the cost management information system so that it is activity based and so that we can provide quality and environmental cost information. After listening to the comments made here, I might also suggest that we need a strategic measurement system that can be used to align the interests of our employees with our improvement strategy. People need to know what is important, that the important factors are being measured, and that they are going to be evaluated and rewarded based on these factors. Finally, I would encourage the use of target costing to help manage costs during product development. To help you all understand the importance of good information, I have assembled some activity data relating to two new products currently under development. These two products will use the same process, using different setups. The data are organized into resource, activity, and cost object modules with an accompanying list of activity drivers to facilitate the use of an ABC software package recently acquired by Zando."
Resource Module (Projected General Ledger Costs of Manufacturing Process Associated with the Two Products)
Activity Module
Cost Object Module (Products and Projected Activity Usage)
List of Activity Drivers
Required
Use the comments from the executive meeting to identify strategic objectives and possible performance measures for each of five perspectives: financial, customer, environmental, process, and learning and growth. Would you recommend the Balanced Scorecard for Zando? Why?
Question
CableTech Bell Corporation (CTB) operates in the telecommunications industry. CTB has two divisions: the Phone Division and the Cable Service Division. The Phone Division manufactures telephones in several plants located in the Midwest. The product lines run from relatively inexpensive touch-tone wall and desk phones to expensive, high-quality cellular phones. CTB also operates a cable TV service in Ohio. The Cable Service Division offers three products: a basic package with 25 channels; an enhanced package, which is the basic package plus 15 additional channels and two movie channels; and a premium package, which is the basic package plus 25 additional channels and three movie channels.
The Cable Service Division reported the following activity for the month of March:

The unit costs are divided as follows: 70 percent production and 30 percent marketing and customer service. Direct labor cost is the only driver used for tracing. Typically, the division uses only production costs to define unit costs. The preceding unit product cost information was provided at the request of the marketing manager and was the result of a special study.
Bryce Youngers, the president of CTB, is reasonably satisfied with the performance of the Cable Service Division. March's performance is fairly typical of what has been happening over the past two years. The Phone Division, however, is another matter. Its overall profit performance has been declining. Two years ago, income before income taxes had been about 25 percent of sales. March's dismal performance was also typical for what has been happening this year and is expected to continue-unless some action by management is taken to reverse the trend. During March, the Phone Division reported the following results:


During March, the Phone Division purchased materials totaling $312,000. There are no significant inventories of supplies (beginning or ending). Supplies are accounted for separately from materials. CTB's Phone Division had sales totaling $1,170,000 for March.
Based on March's results, Bryce decided to meet with three of the Phone Division's managers: Kim Breashears, divisional manager; Jacob Carder, divisional controller; and Larry Hartley, sales manager. A transcript of their recorded conversation is given next:
Bryce: "March's profit performance is down once again, and I think we need to see if we can identify the problem and correct it-before it's too late. Kim, what's your assessment of the situation?"
Kim: "Foreign competition is eating us alive. They are coming in with lower-priced phones of comparable or higher quality than our own. I've talked with several of the retailers that carry our lines, and they say the same. They are convinced that we can sell more if we lower our prices."
Larry: "They're right. If we could lower our prices by 10 to 15 percent, I think that we'd regain most ofour lost market share. But we also need to make sure that the quality of our products meets that of our competitors. As you know, we are spending a lot of money each month on rework and warranties. That worries me. I'd like to see that warranty cost cut by 70 to 80 percent. If we could do that, then customers would be more satisfied with our products, and I bet that we would not only regain our market share but increase it."
Jacob: "Lowering prices without lowering per-unit costs will not help us increase our profitability.
I think we need to improve our cost accounting system. I am not confident that we really know how much each of our product lines is costing us. It may be that we are overpricing some of our units because we are overcosting them. We may be underpricing other units."
Larry: "This sounds promising-especially if the overcosting is for some of our high-volume lines. A price decrease for these products would make the biggest difference-and if we knew they were overcosted, then we could offer immediate price reductions."
Bryce: "Jacob, I need more explanation. We have been using the same cost accounting system for the last 10 years. Why would it be a problem?"
Jacob: "I think that our manufacturing environment has changed. Over the years, we have added a lot of different product lines. Some of these products make very different demands on our manufacturing overhead resources. We trace-or attempt to trace-overhead costs to the different products using direct labor cost, a unit-based cost driver. We may be doing more allocation than tracing. If so, then we probably don't have a very good idea of our actual product costs. Also, as you know, with the way computer technology has changed over time, it is easier and cheaper to collect and use detailed information-information that will allow us to assign costs more accurately."
Bryce: "This may be something we should explore. Jacob, what do you suggest?"
Jacob: "If we want more accurate product costs and if we really want to get in the cost reduction business, then we need to understand how costs behave. In particular, we need to understand activity cost behavior. Knowing what activities we perform, why we perform them, and how well we perform them will help us identify areas for improvement. We also need to know how the different products consume activity resources. What this boils down to is the need to use an activity-based management system. But before we jump into this, we need some idea of whether non-unit-based drivers add anything. Activity-based management is not an inexpensive undertaking. So I suggest that we do a preliminary study to see if direct labor cost is adequate for tracing. If not, then maybe some non-unit-drivers might be needed. In fact, if you would like,
I can gather some data that will provide some evidence on the usefulness of the activity-based approach."
Bryce: "What do you think, Kim? It's your division."
Kim: "What Jacob has said sounds promising. I think he should pursue it and do so quickly. I also think that we need to look at improving our quality. It sounds like we have a problem there. If quality could be improved, then our costs will drop. I'll talk to our quality people. Jacob, in the meantime, find out for us if moving to an activity-based system is the way to go. How much time do you need?"
Jacob: "I have already been gathering data. I could probably have a report within two weeks."

Based on my initial analysis, I am confident that an ABC system will offer significant improvement. For one of our conventional phone plants, I regressed total monthly overhead cost on monthly direct labor cost using the following 15 months of data:

The results were revealing. Although direct labor cost appears to be a driver of overhead cost, it really doesn't explain a lot of the variation. I then searched for other drivers-particularly non-unit drivers-that might offer more insight into overhead cost behavior. Every time a batch is produced, material movement occurs, regardless of the size of the batch. The number of moves seemed like a more logical driver. I was able to gather only 10 months of data for this. (Our information system doesn't provide the number of moves, so I had to build the data set by interviewing production personnel.) This information is provided next:

The regression results were impressive. There is no question in my mind that the number of moves is a good driver of materials-handling costs. Using the number of moves to assign materials-handling costs to products would likely be better than the cost assignment using direct labor cost. Furthermore, since small batches use the same number of moves as large batches, we have some evidence that we may be overcosting our high-volume products.
I looked at one more overhead activity: inspecting products. We have 15 inspectors who are paid an average of $4,000 per month. Each inspector offers about 160 hours of inspection capacity per month. However, it appears that they actually work only about 80 percent of those hours. The drop in demand we have experienced explains this idle time. I see no evidence of variable cost behavior here. I'm not exactly sure how to treat inspection cost, but I think that it is more related to inspection hours than direct labor cost. Some of the other overhead activities seem to be non-unit-level, as well-enough, in fact, to be concerned about how we assign costs.
After receiving the memo, Kim was intrigued. She then asked Jacob to use the same phone plant as a pilot for a preliminary ABC analysis. She instructed him to assign all overhead costs to the plant's two products (Regular and Deluxe models), using only four activities. The four activities were rework, moving materials, inspecting products, and a general catch-all activity labeled "other manufacturing activities." From the special study already performed, she knew that materials handling and inspecting involved significant cost; from production reports, she also knew that the rework activity involved significant cost. If the ABC and unit-based cost assignments did not differ by breaking out these three major activities, then ABC may not matter.
Pursuant to the request, Jacob produced the following cost and driver information:

Expected activity demands:

Required
How would you describe the cost behavior of the inspection activity? Assume that the quality control manager implements a program that reduces the number of defective units by 50 percent. Because of the improved quality, the demand for inspection hours will also drop by 50 percent. What is the potential monthly reduction in inspection costs? How did knowledge of inspection's cost behavior help?
The Cable Service Division reported the following activity for the month of March:
The unit costs are divided as follows: 70 percent production and 30 percent marketing and customer service. Direct labor cost is the only driver used for tracing. Typically, the division uses only production costs to define unit costs. The preceding unit product cost information was provided at the request of the marketing manager and was the result of a special study.
Bryce Youngers, the president of CTB, is reasonably satisfied with the performance of the Cable Service Division. March's performance is fairly typical of what has been happening over the past two years. The Phone Division, however, is another matter. Its overall profit performance has been declining. Two years ago, income before income taxes had been about 25 percent of sales. March's dismal performance was also typical for what has been happening this year and is expected to continue-unless some action by management is taken to reverse the trend. During March, the Phone Division reported the following results:
During March, the Phone Division purchased materials totaling $312,000. There are no significant inventories of supplies (beginning or ending). Supplies are accounted for separately from materials. CTB's Phone Division had sales totaling $1,170,000 for March.
Based on March's results, Bryce decided to meet with three of the Phone Division's managers: Kim Breashears, divisional manager; Jacob Carder, divisional controller; and Larry Hartley, sales manager. A transcript of their recorded conversation is given next:
Bryce: "March's profit performance is down once again, and I think we need to see if we can identify the problem and correct it-before it's too late. Kim, what's your assessment of the situation?"
Kim: "Foreign competition is eating us alive. They are coming in with lower-priced phones of comparable or higher quality than our own. I've talked with several of the retailers that carry our lines, and they say the same. They are convinced that we can sell more if we lower our prices."
Larry: "They're right. If we could lower our prices by 10 to 15 percent, I think that we'd regain most ofour lost market share. But we also need to make sure that the quality of our products meets that of our competitors. As you know, we are spending a lot of money each month on rework and warranties. That worries me. I'd like to see that warranty cost cut by 70 to 80 percent. If we could do that, then customers would be more satisfied with our products, and I bet that we would not only regain our market share but increase it."
Jacob: "Lowering prices without lowering per-unit costs will not help us increase our profitability.
I think we need to improve our cost accounting system. I am not confident that we really know how much each of our product lines is costing us. It may be that we are overpricing some of our units because we are overcosting them. We may be underpricing other units."
Larry: "This sounds promising-especially if the overcosting is for some of our high-volume lines. A price decrease for these products would make the biggest difference-and if we knew they were overcosted, then we could offer immediate price reductions."
Bryce: "Jacob, I need more explanation. We have been using the same cost accounting system for the last 10 years. Why would it be a problem?"
Jacob: "I think that our manufacturing environment has changed. Over the years, we have added a lot of different product lines. Some of these products make very different demands on our manufacturing overhead resources. We trace-or attempt to trace-overhead costs to the different products using direct labor cost, a unit-based cost driver. We may be doing more allocation than tracing. If so, then we probably don't have a very good idea of our actual product costs. Also, as you know, with the way computer technology has changed over time, it is easier and cheaper to collect and use detailed information-information that will allow us to assign costs more accurately."
Bryce: "This may be something we should explore. Jacob, what do you suggest?"
Jacob: "If we want more accurate product costs and if we really want to get in the cost reduction business, then we need to understand how costs behave. In particular, we need to understand activity cost behavior. Knowing what activities we perform, why we perform them, and how well we perform them will help us identify areas for improvement. We also need to know how the different products consume activity resources. What this boils down to is the need to use an activity-based management system. But before we jump into this, we need some idea of whether non-unit-based drivers add anything. Activity-based management is not an inexpensive undertaking. So I suggest that we do a preliminary study to see if direct labor cost is adequate for tracing. If not, then maybe some non-unit-drivers might be needed. In fact, if you would like,
I can gather some data that will provide some evidence on the usefulness of the activity-based approach."
Bryce: "What do you think, Kim? It's your division."
Kim: "What Jacob has said sounds promising. I think he should pursue it and do so quickly. I also think that we need to look at improving our quality. It sounds like we have a problem there. If quality could be improved, then our costs will drop. I'll talk to our quality people. Jacob, in the meantime, find out for us if moving to an activity-based system is the way to go. How much time do you need?"
Jacob: "I have already been gathering data. I could probably have a report within two weeks."
Based on my initial analysis, I am confident that an ABC system will offer significant improvement. For one of our conventional phone plants, I regressed total monthly overhead cost on monthly direct labor cost using the following 15 months of data:
The results were revealing. Although direct labor cost appears to be a driver of overhead cost, it really doesn't explain a lot of the variation. I then searched for other drivers-particularly non-unit drivers-that might offer more insight into overhead cost behavior. Every time a batch is produced, material movement occurs, regardless of the size of the batch. The number of moves seemed like a more logical driver. I was able to gather only 10 months of data for this. (Our information system doesn't provide the number of moves, so I had to build the data set by interviewing production personnel.) This information is provided next:
The regression results were impressive. There is no question in my mind that the number of moves is a good driver of materials-handling costs. Using the number of moves to assign materials-handling costs to products would likely be better than the cost assignment using direct labor cost. Furthermore, since small batches use the same number of moves as large batches, we have some evidence that we may be overcosting our high-volume products.
I looked at one more overhead activity: inspecting products. We have 15 inspectors who are paid an average of $4,000 per month. Each inspector offers about 160 hours of inspection capacity per month. However, it appears that they actually work only about 80 percent of those hours. The drop in demand we have experienced explains this idle time. I see no evidence of variable cost behavior here. I'm not exactly sure how to treat inspection cost, but I think that it is more related to inspection hours than direct labor cost. Some of the other overhead activities seem to be non-unit-level, as well-enough, in fact, to be concerned about how we assign costs.
After receiving the memo, Kim was intrigued. She then asked Jacob to use the same phone plant as a pilot for a preliminary ABC analysis. She instructed him to assign all overhead costs to the plant's two products (Regular and Deluxe models), using only four activities. The four activities were rework, moving materials, inspecting products, and a general catch-all activity labeled "other manufacturing activities." From the special study already performed, she knew that materials handling and inspecting involved significant cost; from production reports, she also knew that the rework activity involved significant cost. If the ABC and unit-based cost assignments did not differ by breaking out these three major activities, then ABC may not matter.
Pursuant to the request, Jacob produced the following cost and driver information:
Expected activity demands:
Required
How would you describe the cost behavior of the inspection activity? Assume that the quality control manager implements a program that reduces the number of defective units by 50 percent. Because of the improved quality, the demand for inspection hours will also drop by 50 percent. What is the potential monthly reduction in inspection costs? How did knowledge of inspection's cost behavior help?
Question
Zando Pharmaceuticals is an affiliate of the German-based Heisenberg Corporation, which employs 40,000 worldwide. Zando's St. Louis facility houses the U.S. corporate headquarters and Research and Development (R D). It produces 30 products, using 28 different batch processes. The facility has 2,000 employees on-site. In recent years, Zando's profitability has suffered, which can be attributed to increased competition, customer dissatisfaction, and regulatory pressures. Luis Alvarado, president of Zando, called a meeting to consider ways to improve profitability. He labeled the meeting a strategic planning session and invited the following officers: Kathy Shorts, environmental manager; Troy Lewis, head of R D; Johnny Mizukawa, vice president of production and quality; Larry Sower, vice president of finance; and Doreen Savara, marketing vice president.
Luis : "You all have received the quarterly financial reports for the last two years. The trends are negative. We are losing market share, profits are decreasing, and our costs seem to be increasing. We need to take actions to increase sales and reduce costs, and we need to do so as quickly as possible. Given our research strengths, it seems to me that our best bet is to grow revenues by introducing new products with proprietary rights. As far as costs are concerned, we need to improve our performance on that dimension as well. Lower per-unit costs for new and existing products are needed. Any suggestions?"
Troy : "For our products, our ability to control costs resides in development-my area-rather than manufacturing. We probably need to pay more attention to product and process design issues to ensure a reasonably level per-unit cost. Revenues are also affected in this stage. Once we patent a drug, the clock begins to tick, and we need to reduce time to market. Significantly, reducing time to market will allow us to generate revenues for a longer period of time than we are currently experiencing. It would also be helpful if we could reduce the cycle time for product development. Both actions would increase revenues. Finally, we can increase revenues by increasing the volume of new products."
Johnny : "There is a lot of merit to the observation that cost reduction opportunities reside mostly in product development. Once a drug is approved, its approval includes the manufacturing process. Any future changes in the manufacturing process require approval from the U.S. Food and Drug Administration. Because of this, we have been reluctant, historically, to engage in process improvement or reengineering. However, I wonder if we shouldn't reconsider this longstanding policy. Some of the quality problems we have could be corrected by changing some of our existing processes, and the costs saved may easily exceed any cost incurred from seeking FDA approval. I think our quality costs are at least 15 percent of sales. That's a lot of opportunity for improvement."
Kathy : "I agree that cost reduction-both in the product development stage and the manufacturing stage-should be a key strategic theme. The environmental area also offers some very good opportunities. A recent pollution prevention act passed by the legislature requires that we calculate the costs of generating hazardous substances for each process. This act was the incentive we needed to begin developing an environmental cost management system. The results so far indicate that environmental costs are much more than we realized. They are estimated to be in the range of 20 to 30 percent of total operating costs. Environmental costs can be reduced by such things as computerizing chemical inventory, eliminating the use of chlorinated solvents and other hazardous materials, reducing our use of virgin feedstocks, and redesigning processes and products so that we can reduce toxic residue release. We can really have a positive environmental impact while simultaneously reducing costs if more attention is paid to environmental issues during product development."
Doreen : "I like what I am hearing because I think that it also affects our ability to increase market share and revenues. For example, environmental impact is one of our major concerns. Some retail pharmacy chains pay particular attention to green products, and right now we are not competing well. Our environmental image is negative and needs to be improved. I am convinced that doing so will allow us to increase market share. Quality is another important matter. We have had to recall two batches of products during the past two years due to poor quality, and this has hurt our image more than the environmental issue. Improving the processes to avoid these kinds of problems will save us a lot of grief. Product image and reputation are essential to increasing customer satisfaction and market share."
Luis : "We started with the need to improve financial performance by increasing revenues and reducing costs. So far, we have some very good suggestions to help achieve these two objectives, but I have some concerns. First, do we have the talent and capabilities to improve quality and environmental performance? Troy, do your professionals really understand what they need to do to improve process and product designs so that we can see the desired quality and environmental improvements? Also, how can we reduce the cycle time for products and the time to market once patented?"
Troy : "Let me answer those questions in order. First, we probably are lacking the understanding on the design issues. We will need to do some training to help our research scientists and chemical engineers understand the consequences. We may need to hire a couple of professionals who have experience in dealing with these issues. Second, we may need to make cycle time and time to market significant performance measures and reward our people for actions that reduce those measures. Our employees need to align their interests with those of the company. If we can achieve this, we should see more revenue produced per employee."
Luis : "Good. Now, Johnny, tell us about production and quality. Do our manufacturing engineers and production workers need help with environmental and quality issues?"
Johnny : "Without question, training will be needed. Moreover, I really need to hire a couple of quality engineers."
Kathy : "I also think that we need an environmental engineer with experience in pharmaceutical manufacturing processes."
Luis : "Good. We certainly shouldn't ignore the necessary infrastructure to bring about the needed changes. Larry, you have been relatively quiet, what do you think about all this? Do you have any suggestions?"
Larry : "Infrastructure is important. If this is all going to work, timely and accurate information will be needed. It is hard to design products and processes with cost being a significant issue without providing the right kind of cost information. We are in the process of revamping the cost management information system so that it is activity based and so that we can provide quality and environmental cost information. After listening to the comments made here, I might also suggest that we need a strategic measurement system that can be used to align the interests of our employees with our improvement strategy. People need to know what is important, that the important factors are being measured, and that they are going to be evaluated and rewarded based on these factors. Finally, I would encourage the use of target costing to help manage costs during product development. To help you all understand the importance of good information, I have assembled some activity data relating to two new products currently under development. These two products will use the same process, using different setups. The data are organized into resource, activity, and cost object modules with an accompanying list of activity drivers to facilitate the use of an ABC software package recently acquired by Zando."
Resource Module (Projected General Ledger Costs of Manufacturing Process Associated with the Two Products)

Activity Module

Cost Object Module (Products and Projected Activity Usage)

List of Activity Drivers
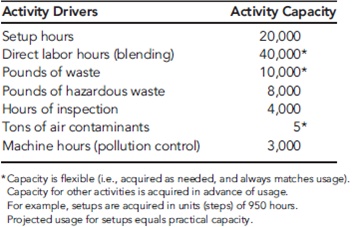
Required
Suppose that Doreen suggested gainsharing in response to Troy's suggestion to reward product development employees for improving cycle time and time to market. What is gainsharing? How could it be used in the product development setting?
Luis : "You all have received the quarterly financial reports for the last two years. The trends are negative. We are losing market share, profits are decreasing, and our costs seem to be increasing. We need to take actions to increase sales and reduce costs, and we need to do so as quickly as possible. Given our research strengths, it seems to me that our best bet is to grow revenues by introducing new products with proprietary rights. As far as costs are concerned, we need to improve our performance on that dimension as well. Lower per-unit costs for new and existing products are needed. Any suggestions?"
Troy : "For our products, our ability to control costs resides in development-my area-rather than manufacturing. We probably need to pay more attention to product and process design issues to ensure a reasonably level per-unit cost. Revenues are also affected in this stage. Once we patent a drug, the clock begins to tick, and we need to reduce time to market. Significantly, reducing time to market will allow us to generate revenues for a longer period of time than we are currently experiencing. It would also be helpful if we could reduce the cycle time for product development. Both actions would increase revenues. Finally, we can increase revenues by increasing the volume of new products."
Johnny : "There is a lot of merit to the observation that cost reduction opportunities reside mostly in product development. Once a drug is approved, its approval includes the manufacturing process. Any future changes in the manufacturing process require approval from the U.S. Food and Drug Administration. Because of this, we have been reluctant, historically, to engage in process improvement or reengineering. However, I wonder if we shouldn't reconsider this longstanding policy. Some of the quality problems we have could be corrected by changing some of our existing processes, and the costs saved may easily exceed any cost incurred from seeking FDA approval. I think our quality costs are at least 15 percent of sales. That's a lot of opportunity for improvement."
Kathy : "I agree that cost reduction-both in the product development stage and the manufacturing stage-should be a key strategic theme. The environmental area also offers some very good opportunities. A recent pollution prevention act passed by the legislature requires that we calculate the costs of generating hazardous substances for each process. This act was the incentive we needed to begin developing an environmental cost management system. The results so far indicate that environmental costs are much more than we realized. They are estimated to be in the range of 20 to 30 percent of total operating costs. Environmental costs can be reduced by such things as computerizing chemical inventory, eliminating the use of chlorinated solvents and other hazardous materials, reducing our use of virgin feedstocks, and redesigning processes and products so that we can reduce toxic residue release. We can really have a positive environmental impact while simultaneously reducing costs if more attention is paid to environmental issues during product development."
Doreen : "I like what I am hearing because I think that it also affects our ability to increase market share and revenues. For example, environmental impact is one of our major concerns. Some retail pharmacy chains pay particular attention to green products, and right now we are not competing well. Our environmental image is negative and needs to be improved. I am convinced that doing so will allow us to increase market share. Quality is another important matter. We have had to recall two batches of products during the past two years due to poor quality, and this has hurt our image more than the environmental issue. Improving the processes to avoid these kinds of problems will save us a lot of grief. Product image and reputation are essential to increasing customer satisfaction and market share."
Luis : "We started with the need to improve financial performance by increasing revenues and reducing costs. So far, we have some very good suggestions to help achieve these two objectives, but I have some concerns. First, do we have the talent and capabilities to improve quality and environmental performance? Troy, do your professionals really understand what they need to do to improve process and product designs so that we can see the desired quality and environmental improvements? Also, how can we reduce the cycle time for products and the time to market once patented?"
Troy : "Let me answer those questions in order. First, we probably are lacking the understanding on the design issues. We will need to do some training to help our research scientists and chemical engineers understand the consequences. We may need to hire a couple of professionals who have experience in dealing with these issues. Second, we may need to make cycle time and time to market significant performance measures and reward our people for actions that reduce those measures. Our employees need to align their interests with those of the company. If we can achieve this, we should see more revenue produced per employee."
Luis : "Good. Now, Johnny, tell us about production and quality. Do our manufacturing engineers and production workers need help with environmental and quality issues?"
Johnny : "Without question, training will be needed. Moreover, I really need to hire a couple of quality engineers."
Kathy : "I also think that we need an environmental engineer with experience in pharmaceutical manufacturing processes."
Luis : "Good. We certainly shouldn't ignore the necessary infrastructure to bring about the needed changes. Larry, you have been relatively quiet, what do you think about all this? Do you have any suggestions?"
Larry : "Infrastructure is important. If this is all going to work, timely and accurate information will be needed. It is hard to design products and processes with cost being a significant issue without providing the right kind of cost information. We are in the process of revamping the cost management information system so that it is activity based and so that we can provide quality and environmental cost information. After listening to the comments made here, I might also suggest that we need a strategic measurement system that can be used to align the interests of our employees with our improvement strategy. People need to know what is important, that the important factors are being measured, and that they are going to be evaluated and rewarded based on these factors. Finally, I would encourage the use of target costing to help manage costs during product development. To help you all understand the importance of good information, I have assembled some activity data relating to two new products currently under development. These two products will use the same process, using different setups. The data are organized into resource, activity, and cost object modules with an accompanying list of activity drivers to facilitate the use of an ABC software package recently acquired by Zando."
Resource Module (Projected General Ledger Costs of Manufacturing Process Associated with the Two Products)
Activity Module
Cost Object Module (Products and Projected Activity Usage)
List of Activity Drivers
Required
Suppose that Doreen suggested gainsharing in response to Troy's suggestion to reward product development employees for improving cycle time and time to market. What is gainsharing? How could it be used in the product development setting?
Question
CableTech Bell Corporation (CTB) operates in the telecommunications industry. CTB has two divisions: the Phone Division and the Cable Service Division. The Phone Division manufactures telephones in several plants located in the Midwest. The product lines run from relatively inexpensive touch-tone wall and desk phones to expensive, high-quality cellular phones. CTB also operates a cable TV service in Ohio. The Cable Service Division offers three products: a basic package with 25 channels; an enhanced package, which is the basic package plus 15 additional channels and two movie channels; and a premium package, which is the basic package plus 25 additional channels and three movie channels.
The Cable Service Division reported the following activity for the month of March:

The unit costs are divided as follows: 70 percent production and 30 percent marketing and customer service. Direct labor cost is the only driver used for tracing. Typically, the division uses only production costs to define unit costs. The preceding unit product cost information was provided at the request of the marketing manager and was the result of a special study.
Bryce Youngers, the president of CTB, is reasonably satisfied with the performance of the Cable Service Division. March's performance is fairly typical of what has been happening over the past two years. The Phone Division, however, is another matter. Its overall profit performance has been declining. Two years ago, income before income taxes had been about 25 percent of sales. March's dismal performance was also typical for what has been happening this year and is expected to continue-unless some action by management is taken to reverse the trend. During March, the Phone Division reported the following results:


During March, the Phone Division purchased materials totaling $312,000. There are no significant inventories of supplies (beginning or ending). Supplies are accounted for separately from materials. CTB's Phone Division had sales totaling $1,170,000 for March.
Based on March's results, Bryce decided to meet with three of the Phone Division's managers: Kim Breashears, divisional manager; Jacob Carder, divisional controller; and Larry Hartley, sales manager. A transcript of their recorded conversation is given next:
Bryce: "March's profit performance is down once again, and I think we need to see if we can identify the problem and correct it-before it's too late. Kim, what's your assessment of the situation?"
Kim: "Foreign competition is eating us alive. They are coming in with lower-priced phones of comparable or higher quality than our own. I've talked with several of the retailers that carry our lines, and they say the same. They are convinced that we can sell more if we lower our prices."
Larry: "They're right. If we could lower our prices by 10 to 15 percent, I think that we'd regain most ofour lost market share. But we also need to make sure that the quality of our products meets that of our competitors. As you know, we are spending a lot of money each month on rework and warranties. That worries me. I'd like to see that warranty cost cut by 70 to 80 percent. If we could do that, then customers would be more satisfied with our products, and I bet that we would not only regain our market share but increase it."
Jacob: "Lowering prices without lowering per-unit costs will not help us increase our profitability.
I think we need to improve our cost accounting system. I am not confident that we really know how much each of our product lines is costing us. It may be that we are overpricing some of our units because we are overcosting them. We may be underpricing other units."
Larry: "This sounds promising-especially if the overcosting is for some of our high-volume lines. A price decrease for these products would make the biggest difference-and if we knew they were overcosted, then we could offer immediate price reductions."
Bryce: "Jacob, I need more explanation. We have been using the same cost accounting system for the last 10 years. Why would it be a problem?"
Jacob: "I think that our manufacturing environment has changed. Over the years, we have added a lot of different product lines. Some of these products make very different demands on our manufacturing overhead resources. We trace-or attempt to trace-overhead costs to the different products using direct labor cost, a unit-based cost driver. We may be doing more allocation than tracing. If so, then we probably don't have a very good idea of our actual product costs. Also, as you know, with the way computer technology has changed over time, it is easier and cheaper to collect and use detailed information-information that will allow us to assign costs more accurately."
Bryce: "This may be something we should explore. Jacob, what do you suggest?"
Jacob: "If we want more accurate product costs and if we really want to get in the cost reduction business, then we need to understand how costs behave. In particular, we need to understand activity cost behavior. Knowing what activities we perform, why we perform them, and how well we perform them will help us identify areas for improvement. We also need to know how the different products consume activity resources. What this boils down to is the need to use an activity-based management system. But before we jump into this, we need some idea of whether non-unit-based drivers add anything. Activity-based management is not an inexpensive undertaking. So I suggest that we do a preliminary study to see if direct labor cost is adequate for tracing. If not, then maybe some non-unit-drivers might be needed. In fact, if you would like,
I can gather some data that will provide some evidence on the usefulness of the activity-based approach."
Bryce: "What do you think, Kim? It's your division."
Kim: "What Jacob has said sounds promising. I think he should pursue it and do so quickly. I also think that we need to look at improving our quality. It sounds like we have a problem there. If quality could be improved, then our costs will drop. I'll talk to our quality people. Jacob, in the meantime, find out for us if moving to an activity-based system is the way to go. How much time do you need?"
Jacob: "I have already been gathering data. I could probably have a report within two weeks."

Based on my initial analysis, I am confident that an ABC system will offer significant improvement. For one of our conventional phone plants, I regressed total monthly overhead cost on monthly direct labor cost using the following 15 months of data:
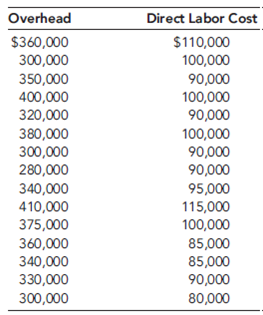
The results were revealing. Although direct labor cost appears to be a driver of overhead cost, it really doesn't explain a lot of the variation. I then searched for other drivers-particularly non-unit drivers-that might offer more insight into overhead cost behavior. Every time a batch is produced, material movement occurs, regardless of the size of the batch. The number of moves seemed like a more logical driver. I was able to gather only 10 months of data for this. (Our information system doesn't provide the number of moves, so I had to build the data set by interviewing production personnel.) This information is provided next:

The regression results were impressive. There is no question in my mind that the number of moves is a good driver of materials-handling costs. Using the number of moves to assign materials-handling costs to products would likely be better than the cost assignment using direct labor cost. Furthermore, since small batches use the same number of moves as large batches, we have some evidence that we may be overcosting our high-volume products.
I looked at one more overhead activity: inspecting products. We have 15 inspectors who are paid an average of $4,000 per month. Each inspector offers about 160 hours of inspection capacity per month. However, it appears that they actually work only about 80 percent of those hours. The drop in demand we have experienced explains this idle time. I see no evidence of variable cost behavior here. I'm not exactly sure how to treat inspection cost, but I think that it is more related to inspection hours than direct labor cost. Some of the other overhead activities seem to be non-unit-level, as well-enough, in fact, to be concerned about how we assign costs.
After receiving the memo, Kim was intrigued. She then asked Jacob to use the same phone plant as a pilot for a preliminary ABC analysis. She instructed him to assign all overhead costs to the plant's two products (Regular and Deluxe models), using only four activities. The four activities were rework, moving materials, inspecting products, and a general catch-all activity labeled "other manufacturing activities." From the special study already performed, she knew that materials handling and inspecting involved significant cost; from production reports, she also knew that the rework activity involved significant cost. If the ABC and unit-based cost assignments did not differ by breaking out these three major activities, then ABC may not matter.
Pursuant to the request, Jacob produced the following cost and driver information:

Expected activity demands:

Required
Calulate the overhead cost per unit for each phone model using direct labor cost to assign all overhead costs to products.
The Cable Service Division reported the following activity for the month of March:
The unit costs are divided as follows: 70 percent production and 30 percent marketing and customer service. Direct labor cost is the only driver used for tracing. Typically, the division uses only production costs to define unit costs. The preceding unit product cost information was provided at the request of the marketing manager and was the result of a special study.
Bryce Youngers, the president of CTB, is reasonably satisfied with the performance of the Cable Service Division. March's performance is fairly typical of what has been happening over the past two years. The Phone Division, however, is another matter. Its overall profit performance has been declining. Two years ago, income before income taxes had been about 25 percent of sales. March's dismal performance was also typical for what has been happening this year and is expected to continue-unless some action by management is taken to reverse the trend. During March, the Phone Division reported the following results:
During March, the Phone Division purchased materials totaling $312,000. There are no significant inventories of supplies (beginning or ending). Supplies are accounted for separately from materials. CTB's Phone Division had sales totaling $1,170,000 for March.
Based on March's results, Bryce decided to meet with three of the Phone Division's managers: Kim Breashears, divisional manager; Jacob Carder, divisional controller; and Larry Hartley, sales manager. A transcript of their recorded conversation is given next:
Bryce: "March's profit performance is down once again, and I think we need to see if we can identify the problem and correct it-before it's too late. Kim, what's your assessment of the situation?"
Kim: "Foreign competition is eating us alive. They are coming in with lower-priced phones of comparable or higher quality than our own. I've talked with several of the retailers that carry our lines, and they say the same. They are convinced that we can sell more if we lower our prices."
Larry: "They're right. If we could lower our prices by 10 to 15 percent, I think that we'd regain most ofour lost market share. But we also need to make sure that the quality of our products meets that of our competitors. As you know, we are spending a lot of money each month on rework and warranties. That worries me. I'd like to see that warranty cost cut by 70 to 80 percent. If we could do that, then customers would be more satisfied with our products, and I bet that we would not only regain our market share but increase it."
Jacob: "Lowering prices without lowering per-unit costs will not help us increase our profitability.
I think we need to improve our cost accounting system. I am not confident that we really know how much each of our product lines is costing us. It may be that we are overpricing some of our units because we are overcosting them. We may be underpricing other units."
Larry: "This sounds promising-especially if the overcosting is for some of our high-volume lines. A price decrease for these products would make the biggest difference-and if we knew they were overcosted, then we could offer immediate price reductions."
Bryce: "Jacob, I need more explanation. We have been using the same cost accounting system for the last 10 years. Why would it be a problem?"
Jacob: "I think that our manufacturing environment has changed. Over the years, we have added a lot of different product lines. Some of these products make very different demands on our manufacturing overhead resources. We trace-or attempt to trace-overhead costs to the different products using direct labor cost, a unit-based cost driver. We may be doing more allocation than tracing. If so, then we probably don't have a very good idea of our actual product costs. Also, as you know, with the way computer technology has changed over time, it is easier and cheaper to collect and use detailed information-information that will allow us to assign costs more accurately."
Bryce: "This may be something we should explore. Jacob, what do you suggest?"
Jacob: "If we want more accurate product costs and if we really want to get in the cost reduction business, then we need to understand how costs behave. In particular, we need to understand activity cost behavior. Knowing what activities we perform, why we perform them, and how well we perform them will help us identify areas for improvement. We also need to know how the different products consume activity resources. What this boils down to is the need to use an activity-based management system. But before we jump into this, we need some idea of whether non-unit-based drivers add anything. Activity-based management is not an inexpensive undertaking. So I suggest that we do a preliminary study to see if direct labor cost is adequate for tracing. If not, then maybe some non-unit-drivers might be needed. In fact, if you would like,
I can gather some data that will provide some evidence on the usefulness of the activity-based approach."
Bryce: "What do you think, Kim? It's your division."
Kim: "What Jacob has said sounds promising. I think he should pursue it and do so quickly. I also think that we need to look at improving our quality. It sounds like we have a problem there. If quality could be improved, then our costs will drop. I'll talk to our quality people. Jacob, in the meantime, find out for us if moving to an activity-based system is the way to go. How much time do you need?"
Jacob: "I have already been gathering data. I could probably have a report within two weeks."
Based on my initial analysis, I am confident that an ABC system will offer significant improvement. For one of our conventional phone plants, I regressed total monthly overhead cost on monthly direct labor cost using the following 15 months of data:
The results were revealing. Although direct labor cost appears to be a driver of overhead cost, it really doesn't explain a lot of the variation. I then searched for other drivers-particularly non-unit drivers-that might offer more insight into overhead cost behavior. Every time a batch is produced, material movement occurs, regardless of the size of the batch. The number of moves seemed like a more logical driver. I was able to gather only 10 months of data for this. (Our information system doesn't provide the number of moves, so I had to build the data set by interviewing production personnel.) This information is provided next:
The regression results were impressive. There is no question in my mind that the number of moves is a good driver of materials-handling costs. Using the number of moves to assign materials-handling costs to products would likely be better than the cost assignment using direct labor cost. Furthermore, since small batches use the same number of moves as large batches, we have some evidence that we may be overcosting our high-volume products.
I looked at one more overhead activity: inspecting products. We have 15 inspectors who are paid an average of $4,000 per month. Each inspector offers about 160 hours of inspection capacity per month. However, it appears that they actually work only about 80 percent of those hours. The drop in demand we have experienced explains this idle time. I see no evidence of variable cost behavior here. I'm not exactly sure how to treat inspection cost, but I think that it is more related to inspection hours than direct labor cost. Some of the other overhead activities seem to be non-unit-level, as well-enough, in fact, to be concerned about how we assign costs.
After receiving the memo, Kim was intrigued. She then asked Jacob to use the same phone plant as a pilot for a preliminary ABC analysis. She instructed him to assign all overhead costs to the plant's two products (Regular and Deluxe models), using only four activities. The four activities were rework, moving materials, inspecting products, and a general catch-all activity labeled "other manufacturing activities." From the special study already performed, she knew that materials handling and inspecting involved significant cost; from production reports, she also knew that the rework activity involved significant cost. If the ABC and unit-based cost assignments did not differ by breaking out these three major activities, then ABC may not matter.
Pursuant to the request, Jacob produced the following cost and driver information:
Expected activity demands:
Required
Calulate the overhead cost per unit for each phone model using direct labor cost to assign all overhead costs to products.
Question
Zando Pharmaceuticals is an affiliate of the German-based Heisenberg Corporation, which employs 40,000 worldwide. Zando's St. Louis facility houses the U.S. corporate headquarters and Research and Development (R D). It produces 30 products, using 28 different batch processes. The facility has 2,000 employees on-site. In recent years, Zando's profitability has suffered, which can be attributed to increased competition, customer dissatisfaction, and regulatory pressures. Luis Alvarado, president of Zando, called a meeting to consider ways to improve profitability. He labeled the meeting a strategic planning session and invited the following officers: Kathy Shorts, environmental manager; Troy Lewis, head of R D; Johnny Mizukawa, vice president of production and quality; Larry Sower, vice president of finance; and Doreen Savara, marketing vice president.
Luis : "You all have received the quarterly financial reports for the last two years. The trends are negative. We are losing market share, profits are decreasing, and our costs seem to be increasing. We need to take actions to increase sales and reduce costs, and we need to do so as quickly as possible. Given our research strengths, it seems to me that our best bet is to grow revenues by introducing new products with proprietary rights. As far as costs are concerned, we need to improve our performance on that dimension as well. Lower per-unit costs for new and existing products are needed. Any suggestions?"
Troy : "For our products, our ability to control costs resides in development-my area-rather than manufacturing. We probably need to pay more attention to product and process design issues to ensure a reasonably level per-unit cost. Revenues are also affected in this stage. Once we patent a drug, the clock begins to tick, and we need to reduce time to market. Significantly, reducing time to market will allow us to generate revenues for a longer period of time than we are currently experiencing. It would also be helpful if we could reduce the cycle time for product development. Both actions would increase revenues. Finally, we can increase revenues by increasing the volume of new products."
Johnny : "There is a lot of merit to the observation that cost reduction opportunities reside mostly in product development. Once a drug is approved, its approval includes the manufacturing process. Any future changes in the manufacturing process require approval from the U.S. Food and Drug Administration. Because of this, we have been reluctant, historically, to engage in process improvement or reengineering. However, I wonder if we shouldn't reconsider this longstanding policy. Some of the quality problems we have could be corrected by changing some of our existing processes, and the costs saved may easily exceed any cost incurred from seeking FDA approval. I think our quality costs are at least 15 percent of sales. That's a lot of opportunity for improvement."
Kathy : "I agree that cost reduction-both in the product development stage and the manufacturing stage-should be a key strategic theme. The environmental area also offers some very good opportunities. A recent pollution prevention act passed by the legislature requires that we calculate the costs of generating hazardous substances for each process. This act was the incentive we needed to begin developing an environmental cost management system. The results so far indicate that environmental costs are much more than we realized. They are estimated to be in the range of 20 to 30 percent of total operating costs. Environmental costs can be reduced by such things as computerizing chemical inventory, eliminating the use of chlorinated solvents and other hazardous materials, reducing our use of virgin feedstocks, and redesigning processes and products so that we can reduce toxic residue release. We can really have a positive environmental impact while simultaneously reducing costs if more attention is paid to environmental issues during product development."
Doreen : "I like what I am hearing because I think that it also affects our ability to increase market share and revenues. For example, environmental impact is one of our major concerns. Some retail pharmacy chains pay particular attention to green products, and right now we are not competing well. Our environmental image is negative and needs to be improved. I am convinced that doing so will allow us to increase market share. Quality is another important matter. We have had to recall two batches of products during the past two years due to poor quality, and this has hurt our image more than the environmental issue. Improving the processes to avoid these kinds of problems will save us a lot of grief. Product image and reputation are essential to increasing customer satisfaction and market share."
Luis : "We started with the need to improve financial performance by increasing revenues and reducing costs. So far, we have some very good suggestions to help achieve these two objectives, but I have some concerns. First, do we have the talent and capabilities to improve quality and environmental performance? Troy, do your professionals really understand what they need to do to improve process and product designs so that we can see the desired quality and environmental improvements? Also, how can we reduce the cycle time for products and the time to market once patented?"
Troy : "Let me answer those questions in order. First, we probably are lacking the understanding on the design issues. We will need to do some training to help our research scientists and chemical engineers understand the consequences. We may need to hire a couple of professionals who have experience in dealing with these issues. Second, we may need to make cycle time and time to market significant performance measures and reward our people for actions that reduce those measures. Our employees need to align their interests with those of the company. If we can achieve this, we should see more revenue produced per employee."
Luis : "Good. Now, Johnny, tell us about production and quality. Do our manufacturing engineers and production workers need help with environmental and quality issues?"
Johnny : "Without question, training will be needed. Moreover, I really need to hire a couple of quality engineers."
Kathy : "I also think that we need an environmental engineer with experience in pharmaceutical manufacturing processes."
Luis : "Good. We certainly shouldn't ignore the necessary infrastructure to bring about the needed changes. Larry, you have been relatively quiet, what do you think about all this? Do you have any suggestions?"
Larry : "Infrastructure is important. If this is all going to work, timely and accurate information will be needed. It is hard to design products and processes with cost being a significant issue without providing the right kind of cost information. We are in the process of revamping the cost management information system so that it is activity based and so that we can provide quality and environmental cost information. After listening to the comments made here, I might also suggest that we need a strategic measurement system that can be used to align the interests of our employees with our improvement strategy. People need to know what is important, that the important factors are being measured, and that they are going to be evaluated and rewarded based on these factors. Finally, I would encourage the use of target costing to help manage costs during product development. To help you all understand the importance of good information, I have assembled some activity data relating to two new products currently under development. These two products will use the same process, using different setups. The data are organized into resource, activity, and cost object modules with an accompanying list of activity drivers to facilitate the use of an ABC software package recently acquired by Zando."
Resource Module (Projected General Ledger Costs of Manufacturing Process Associated with the Two Products)

Activity Module

Cost Object Module (Products and Projected Activity Usage)
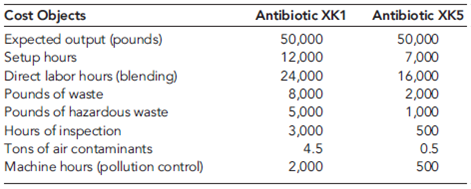
List of Activity Drivers

Required
Determine the cost of all activities for the proposed new process. Now, assign the cost of the secondary activity to the primary activities.
Luis : "You all have received the quarterly financial reports for the last two years. The trends are negative. We are losing market share, profits are decreasing, and our costs seem to be increasing. We need to take actions to increase sales and reduce costs, and we need to do so as quickly as possible. Given our research strengths, it seems to me that our best bet is to grow revenues by introducing new products with proprietary rights. As far as costs are concerned, we need to improve our performance on that dimension as well. Lower per-unit costs for new and existing products are needed. Any suggestions?"
Troy : "For our products, our ability to control costs resides in development-my area-rather than manufacturing. We probably need to pay more attention to product and process design issues to ensure a reasonably level per-unit cost. Revenues are also affected in this stage. Once we patent a drug, the clock begins to tick, and we need to reduce time to market. Significantly, reducing time to market will allow us to generate revenues for a longer period of time than we are currently experiencing. It would also be helpful if we could reduce the cycle time for product development. Both actions would increase revenues. Finally, we can increase revenues by increasing the volume of new products."
Johnny : "There is a lot of merit to the observation that cost reduction opportunities reside mostly in product development. Once a drug is approved, its approval includes the manufacturing process. Any future changes in the manufacturing process require approval from the U.S. Food and Drug Administration. Because of this, we have been reluctant, historically, to engage in process improvement or reengineering. However, I wonder if we shouldn't reconsider this longstanding policy. Some of the quality problems we have could be corrected by changing some of our existing processes, and the costs saved may easily exceed any cost incurred from seeking FDA approval. I think our quality costs are at least 15 percent of sales. That's a lot of opportunity for improvement."
Kathy : "I agree that cost reduction-both in the product development stage and the manufacturing stage-should be a key strategic theme. The environmental area also offers some very good opportunities. A recent pollution prevention act passed by the legislature requires that we calculate the costs of generating hazardous substances for each process. This act was the incentive we needed to begin developing an environmental cost management system. The results so far indicate that environmental costs are much more than we realized. They are estimated to be in the range of 20 to 30 percent of total operating costs. Environmental costs can be reduced by such things as computerizing chemical inventory, eliminating the use of chlorinated solvents and other hazardous materials, reducing our use of virgin feedstocks, and redesigning processes and products so that we can reduce toxic residue release. We can really have a positive environmental impact while simultaneously reducing costs if more attention is paid to environmental issues during product development."
Doreen : "I like what I am hearing because I think that it also affects our ability to increase market share and revenues. For example, environmental impact is one of our major concerns. Some retail pharmacy chains pay particular attention to green products, and right now we are not competing well. Our environmental image is negative and needs to be improved. I am convinced that doing so will allow us to increase market share. Quality is another important matter. We have had to recall two batches of products during the past two years due to poor quality, and this has hurt our image more than the environmental issue. Improving the processes to avoid these kinds of problems will save us a lot of grief. Product image and reputation are essential to increasing customer satisfaction and market share."
Luis : "We started with the need to improve financial performance by increasing revenues and reducing costs. So far, we have some very good suggestions to help achieve these two objectives, but I have some concerns. First, do we have the talent and capabilities to improve quality and environmental performance? Troy, do your professionals really understand what they need to do to improve process and product designs so that we can see the desired quality and environmental improvements? Also, how can we reduce the cycle time for products and the time to market once patented?"
Troy : "Let me answer those questions in order. First, we probably are lacking the understanding on the design issues. We will need to do some training to help our research scientists and chemical engineers understand the consequences. We may need to hire a couple of professionals who have experience in dealing with these issues. Second, we may need to make cycle time and time to market significant performance measures and reward our people for actions that reduce those measures. Our employees need to align their interests with those of the company. If we can achieve this, we should see more revenue produced per employee."
Luis : "Good. Now, Johnny, tell us about production and quality. Do our manufacturing engineers and production workers need help with environmental and quality issues?"
Johnny : "Without question, training will be needed. Moreover, I really need to hire a couple of quality engineers."
Kathy : "I also think that we need an environmental engineer with experience in pharmaceutical manufacturing processes."
Luis : "Good. We certainly shouldn't ignore the necessary infrastructure to bring about the needed changes. Larry, you have been relatively quiet, what do you think about all this? Do you have any suggestions?"
Larry : "Infrastructure is important. If this is all going to work, timely and accurate information will be needed. It is hard to design products and processes with cost being a significant issue without providing the right kind of cost information. We are in the process of revamping the cost management information system so that it is activity based and so that we can provide quality and environmental cost information. After listening to the comments made here, I might also suggest that we need a strategic measurement system that can be used to align the interests of our employees with our improvement strategy. People need to know what is important, that the important factors are being measured, and that they are going to be evaluated and rewarded based on these factors. Finally, I would encourage the use of target costing to help manage costs during product development. To help you all understand the importance of good information, I have assembled some activity data relating to two new products currently under development. These two products will use the same process, using different setups. The data are organized into resource, activity, and cost object modules with an accompanying list of activity drivers to facilitate the use of an ABC software package recently acquired by Zando."
Resource Module (Projected General Ledger Costs of Manufacturing Process Associated with the Two Products)
Activity Module
Cost Object Module (Products and Projected Activity Usage)
List of Activity Drivers
Required
Determine the cost of all activities for the proposed new process. Now, assign the cost of the secondary activity to the primary activities.
Question
CableTech Bell Corporation (CTB) operates in the telecommunications industry. CTB has two divisions: the Phone Division and the Cable Service Division. The Phone Division manufactures telephones in several plants located in the Midwest. The product lines run from relatively inexpensive touch-tone wall and desk phones to expensive, high-quality cellular phones. CTB also operates a cable TV service in Ohio. The Cable Service Division offers three products: a basic package with 25 channels; an enhanced package, which is the basic package plus 15 additional channels and two movie channels; and a premium package, which is the basic package plus 25 additional channels and three movie channels.
The Cable Service Division reported the following activity for the month of March:

The unit costs are divided as follows: 70 percent production and 30 percent marketing and customer service. Direct labor cost is the only driver used for tracing. Typically, the division uses only production costs to define unit costs. The preceding unit product cost information was provided at the request of the marketing manager and was the result of a special study.
Bryce Youngers, the president of CTB, is reasonably satisfied with the performance of the Cable Service Division. March's performance is fairly typical of what has been happening over the past two years. The Phone Division, however, is another matter. Its overall profit performance has been declining. Two years ago, income before income taxes had been about 25 percent of sales. March's dismal performance was also typical for what has been happening this year and is expected to continue-unless some action by management is taken to reverse the trend. During March, the Phone Division reported the following results:


During March, the Phone Division purchased materials totaling $312,000. There are no significant inventories of supplies (beginning or ending). Supplies are accounted for separately from materials. CTB's Phone Division had sales totaling $1,170,000 for March.
Based on March's results, Bryce decided to meet with three of the Phone Division's managers: Kim Breashears, divisional manager; Jacob Carder, divisional controller; and Larry Hartley, sales manager. A transcript of their recorded conversation is given next:
Bryce: "March's profit performance is down once again, and I think we need to see if we can identify the problem and correct it-before it's too late. Kim, what's your assessment of the situation?"
Kim: "Foreign competition is eating us alive. They are coming in with lower-priced phones of comparable or higher quality than our own. I've talked with several of the retailers that carry our lines, and they say the same. They are convinced that we can sell more if we lower our prices."
Larry: "They're right. If we could lower our prices by 10 to 15 percent, I think that we'd regain most ofour lost market share. But we also need to make sure that the quality of our products meets that of our competitors. As you know, we are spending a lot of money each month on rework and warranties. That worries me. I'd like to see that warranty cost cut by 70 to 80 percent. If we could do that, then customers would be more satisfied with our products, and I bet that we would not only regain our market share but increase it."
Jacob: "Lowering prices without lowering per-unit costs will not help us increase our profitability.
I think we need to improve our cost accounting system. I am not confident that we really know how much each of our product lines is costing us. It may be that we are overpricing some of our units because we are overcosting them. We may be underpricing other units."
Larry: "This sounds promising-especially if the overcosting is for some of our high-volume lines. A price decrease for these products would make the biggest difference-and if we knew they were overcosted, then we could offer immediate price reductions."
Bryce: "Jacob, I need more explanation. We have been using the same cost accounting system for the last 10 years. Why would it be a problem?"
Jacob: "I think that our manufacturing environment has changed. Over the years, we have added a lot of different product lines. Some of these products make very different demands on our manufacturing overhead resources. We trace-or attempt to trace-overhead costs to the different products using direct labor cost, a unit-based cost driver. We may be doing more allocation than tracing. If so, then we probably don't have a very good idea of our actual product costs. Also, as you know, with the way computer technology has changed over time, it is easier and cheaper to collect and use detailed information-information that will allow us to assign costs more accurately."
Bryce: "This may be something we should explore. Jacob, what do you suggest?"
Jacob: "If we want more accurate product costs and if we really want to get in the cost reduction business, then we need to understand how costs behave. In particular, we need to understand activity cost behavior. Knowing what activities we perform, why we perform them, and how well we perform them will help us identify areas for improvement. We also need to know how the different products consume activity resources. What this boils down to is the need to use an activity-based management system. But before we jump into this, we need some idea of whether non-unit-based drivers add anything. Activity-based management is not an inexpensive undertaking. So I suggest that we do a preliminary study to see if direct labor cost is adequate for tracing. If not, then maybe some non-unit-drivers might be needed. In fact, if you would like,
I can gather some data that will provide some evidence on the usefulness of the activity-based approach."
Bryce: "What do you think, Kim? It's your division."
Kim: "What Jacob has said sounds promising. I think he should pursue it and do so quickly. I also think that we need to look at improving our quality. It sounds like we have a problem there. If quality could be improved, then our costs will drop. I'll talk to our quality people. Jacob, in the meantime, find out for us if moving to an activity-based system is the way to go. How much time do you need?"
Jacob: "I have already been gathering data. I could probably have a report within two weeks."

Based on my initial analysis, I am confident that an ABC system will offer significant improvement. For one of our conventional phone plants, I regressed total monthly overhead cost on monthly direct labor cost using the following 15 months of data:

The results were revealing. Although direct labor cost appears to be a driver of overhead cost, it really doesn't explain a lot of the variation. I then searched for other drivers-particularly non-unit drivers-that might offer more insight into overhead cost behavior. Every time a batch is produced, material movement occurs, regardless of the size of the batch. The number of moves seemed like a more logical driver. I was able to gather only 10 months of data for this. (Our information system doesn't provide the number of moves, so I had to build the data set by interviewing production personnel.) This information is provided next:

The regression results were impressive. There is no question in my mind that the number of moves is a good driver of materials-handling costs. Using the number of moves to assign materials-handling costs to products would likely be better than the cost assignment using direct labor cost. Furthermore, since small batches use the same number of moves as large batches, we have some evidence that we may be overcosting our high-volume products.
I looked at one more overhead activity: inspecting products. We have 15 inspectors who are paid an average of $4,000 per month. Each inspector offers about 160 hours of inspection capacity per month. However, it appears that they actually work only about 80 percent of those hours. The drop in demand we have experienced explains this idle time. I see no evidence of variable cost behavior here. I'm not exactly sure how to treat inspection cost, but I think that it is more related to inspection hours than direct labor cost. Some of the other overhead activities seem to be non-unit-level, as well-enough, in fact, to be concerned about how we assign costs.
After receiving the memo, Kim was intrigued. She then asked Jacob to use the same phone plant as a pilot for a preliminary ABC analysis. She instructed him to assign all overhead costs to the plant's two products (Regular and Deluxe models), using only four activities. The four activities were rework, moving materials, inspecting products, and a general catch-all activity labeled "other manufacturing activities." From the special study already performed, she knew that materials handling and inspecting involved significant cost; from production reports, she also knew that the rework activity involved significant cost. If the ABC and unit-based cost assignments did not differ by breaking out these three major activities, then ABC may not matter.
Pursuant to the request, Jacob produced the following cost and driver information:

Expected activity demands:

Required
Calculate the overhead cost per unit using the four activities and drivers identified by Kim and Jacob. If you were Kim, would you be inclined to implement an ABC system based on the evidence from this pilot test?
The Cable Service Division reported the following activity for the month of March:
The unit costs are divided as follows: 70 percent production and 30 percent marketing and customer service. Direct labor cost is the only driver used for tracing. Typically, the division uses only production costs to define unit costs. The preceding unit product cost information was provided at the request of the marketing manager and was the result of a special study.
Bryce Youngers, the president of CTB, is reasonably satisfied with the performance of the Cable Service Division. March's performance is fairly typical of what has been happening over the past two years. The Phone Division, however, is another matter. Its overall profit performance has been declining. Two years ago, income before income taxes had been about 25 percent of sales. March's dismal performance was also typical for what has been happening this year and is expected to continue-unless some action by management is taken to reverse the trend. During March, the Phone Division reported the following results:
During March, the Phone Division purchased materials totaling $312,000. There are no significant inventories of supplies (beginning or ending). Supplies are accounted for separately from materials. CTB's Phone Division had sales totaling $1,170,000 for March.
Based on March's results, Bryce decided to meet with three of the Phone Division's managers: Kim Breashears, divisional manager; Jacob Carder, divisional controller; and Larry Hartley, sales manager. A transcript of their recorded conversation is given next:
Bryce: "March's profit performance is down once again, and I think we need to see if we can identify the problem and correct it-before it's too late. Kim, what's your assessment of the situation?"
Kim: "Foreign competition is eating us alive. They are coming in with lower-priced phones of comparable or higher quality than our own. I've talked with several of the retailers that carry our lines, and they say the same. They are convinced that we can sell more if we lower our prices."
Larry: "They're right. If we could lower our prices by 10 to 15 percent, I think that we'd regain most ofour lost market share. But we also need to make sure that the quality of our products meets that of our competitors. As you know, we are spending a lot of money each month on rework and warranties. That worries me. I'd like to see that warranty cost cut by 70 to 80 percent. If we could do that, then customers would be more satisfied with our products, and I bet that we would not only regain our market share but increase it."
Jacob: "Lowering prices without lowering per-unit costs will not help us increase our profitability.
I think we need to improve our cost accounting system. I am not confident that we really know how much each of our product lines is costing us. It may be that we are overpricing some of our units because we are overcosting them. We may be underpricing other units."
Larry: "This sounds promising-especially if the overcosting is for some of our high-volume lines. A price decrease for these products would make the biggest difference-and if we knew they were overcosted, then we could offer immediate price reductions."
Bryce: "Jacob, I need more explanation. We have been using the same cost accounting system for the last 10 years. Why would it be a problem?"
Jacob: "I think that our manufacturing environment has changed. Over the years, we have added a lot of different product lines. Some of these products make very different demands on our manufacturing overhead resources. We trace-or attempt to trace-overhead costs to the different products using direct labor cost, a unit-based cost driver. We may be doing more allocation than tracing. If so, then we probably don't have a very good idea of our actual product costs. Also, as you know, with the way computer technology has changed over time, it is easier and cheaper to collect and use detailed information-information that will allow us to assign costs more accurately."
Bryce: "This may be something we should explore. Jacob, what do you suggest?"
Jacob: "If we want more accurate product costs and if we really want to get in the cost reduction business, then we need to understand how costs behave. In particular, we need to understand activity cost behavior. Knowing what activities we perform, why we perform them, and how well we perform them will help us identify areas for improvement. We also need to know how the different products consume activity resources. What this boils down to is the need to use an activity-based management system. But before we jump into this, we need some idea of whether non-unit-based drivers add anything. Activity-based management is not an inexpensive undertaking. So I suggest that we do a preliminary study to see if direct labor cost is adequate for tracing. If not, then maybe some non-unit-drivers might be needed. In fact, if you would like,
I can gather some data that will provide some evidence on the usefulness of the activity-based approach."
Bryce: "What do you think, Kim? It's your division."
Kim: "What Jacob has said sounds promising. I think he should pursue it and do so quickly. I also think that we need to look at improving our quality. It sounds like we have a problem there. If quality could be improved, then our costs will drop. I'll talk to our quality people. Jacob, in the meantime, find out for us if moving to an activity-based system is the way to go. How much time do you need?"
Jacob: "I have already been gathering data. I could probably have a report within two weeks."
Based on my initial analysis, I am confident that an ABC system will offer significant improvement. For one of our conventional phone plants, I regressed total monthly overhead cost on monthly direct labor cost using the following 15 months of data:
The results were revealing. Although direct labor cost appears to be a driver of overhead cost, it really doesn't explain a lot of the variation. I then searched for other drivers-particularly non-unit drivers-that might offer more insight into overhead cost behavior. Every time a batch is produced, material movement occurs, regardless of the size of the batch. The number of moves seemed like a more logical driver. I was able to gather only 10 months of data for this. (Our information system doesn't provide the number of moves, so I had to build the data set by interviewing production personnel.) This information is provided next:
The regression results were impressive. There is no question in my mind that the number of moves is a good driver of materials-handling costs. Using the number of moves to assign materials-handling costs to products would likely be better than the cost assignment using direct labor cost. Furthermore, since small batches use the same number of moves as large batches, we have some evidence that we may be overcosting our high-volume products.
I looked at one more overhead activity: inspecting products. We have 15 inspectors who are paid an average of $4,000 per month. Each inspector offers about 160 hours of inspection capacity per month. However, it appears that they actually work only about 80 percent of those hours. The drop in demand we have experienced explains this idle time. I see no evidence of variable cost behavior here. I'm not exactly sure how to treat inspection cost, but I think that it is more related to inspection hours than direct labor cost. Some of the other overhead activities seem to be non-unit-level, as well-enough, in fact, to be concerned about how we assign costs.
After receiving the memo, Kim was intrigued. She then asked Jacob to use the same phone plant as a pilot for a preliminary ABC analysis. She instructed him to assign all overhead costs to the plant's two products (Regular and Deluxe models), using only four activities. The four activities were rework, moving materials, inspecting products, and a general catch-all activity labeled "other manufacturing activities." From the special study already performed, she knew that materials handling and inspecting involved significant cost; from production reports, she also knew that the rework activity involved significant cost. If the ABC and unit-based cost assignments did not differ by breaking out these three major activities, then ABC may not matter.
Pursuant to the request, Jacob produced the following cost and driver information:
Expected activity demands:
Required
Calculate the overhead cost per unit using the four activities and drivers identified by Kim and Jacob. If you were Kim, would you be inclined to implement an ABC system based on the evidence from this pilot test?
Question
Zando Pharmaceuticals is an affiliate of the German-based Heisenberg Corporation, which employs 40,000 worldwide. Zando's St. Louis facility houses the U.S. corporate headquarters and Research and Development (R D). It produces 30 products, using 28 different batch processes. The facility has 2,000 employees on-site. In recent years, Zando's profitability has suffered, which can be attributed to increased competition, customer dissatisfaction, and regulatory pressures. Luis Alvarado, president of Zando, called a meeting to consider ways to improve profitability. He labeled the meeting a strategic planning session and invited the following officers: Kathy Shorts, environmental manager; Troy Lewis, head of R D; Johnny Mizukawa, vice president of production and quality; Larry Sower, vice president of finance; and Doreen Savara, marketing vice president.
Luis : "You all have received the quarterly financial reports for the last two years. The trends are negative. We are losing market share, profits are decreasing, and our costs seem to be increasing. We need to take actions to increase sales and reduce costs, and we need to do so as quickly as possible. Given our research strengths, it seems to me that our best bet is to grow revenues by introducing new products with proprietary rights. As far as costs are concerned, we need to improve our performance on that dimension as well. Lower per-unit costs for new and existing products are needed. Any suggestions?"
Troy : "For our products, our ability to control costs resides in development-my area-rather than manufacturing. We probably need to pay more attention to product and process design issues to ensure a reasonably level per-unit cost. Revenues are also affected in this stage. Once we patent a drug, the clock begins to tick, and we need to reduce time to market. Significantly, reducing time to market will allow us to generate revenues for a longer period of time than we are currently experiencing. It would also be helpful if we could reduce the cycle time for product development. Both actions would increase revenues. Finally, we can increase revenues by increasing the volume of new products."
Johnny : "There is a lot of merit to the observation that cost reduction opportunities reside mostly in product development. Once a drug is approved, its approval includes the manufacturing process. Any future changes in the manufacturing process require approval from the U.S. Food and Drug Administration. Because of this, we have been reluctant, historically, to engage in process improvement or reengineering. However, I wonder if we shouldn't reconsider this longstanding policy. Some of the quality problems we have could be corrected by changing some of our existing processes, and the costs saved may easily exceed any cost incurred from seeking FDA approval. I think our quality costs are at least 15 percent of sales. That's a lot of opportunity for improvement."
Kathy : "I agree that cost reduction-both in the product development stage and the manufacturing stage-should be a key strategic theme. The environmental area also offers some very good opportunities. A recent pollution prevention act passed by the legislature requires that we calculate the costs of generating hazardous substances for each process. This act was the incentive we needed to begin developing an environmental cost management system. The results so far indicate that environmental costs are much more than we realized. They are estimated to be in the range of 20 to 30 percent of total operating costs. Environmental costs can be reduced by such things as computerizing chemical inventory, eliminating the use of chlorinated solvents and other hazardous materials, reducing our use of virgin feedstocks, and redesigning processes and products so that we can reduce toxic residue release. We can really have a positive environmental impact while simultaneously reducing costs if more attention is paid to environmental issues during product development."
Doreen : "I like what I am hearing because I think that it also affects our ability to increase market share and revenues. For example, environmental impact is one of our major concerns. Some retail pharmacy chains pay particular attention to green products, and right now we are not competing well. Our environmental image is negative and needs to be improved. I am convinced that doing so will allow us to increase market share. Quality is another important matter. We have had to recall two batches of products during the past two years due to poor quality, and this has hurt our image more than the environmental issue. Improving the processes to avoid these kinds of problems will save us a lot of grief. Product image and reputation are essential to increasing customer satisfaction and market share."
Luis : "We started with the need to improve financial performance by increasing revenues and reducing costs. So far, we have some very good suggestions to help achieve these two objectives, but I have some concerns. First, do we have the talent and capabilities to improve quality and environmental performance? Troy, do your professionals really understand what they need to do to improve process and product designs so that we can see the desired quality and environmental improvements? Also, how can we reduce the cycle time for products and the time to market once patented?"
Troy : "Let me answer those questions in order. First, we probably are lacking the understanding on the design issues. We will need to do some training to help our research scientists and chemical engineers understand the consequences. We may need to hire a couple of professionals who have experience in dealing with these issues. Second, we may need to make cycle time and time to market significant performance measures and reward our people for actions that reduce those measures. Our employees need to align their interests with those of the company. If we can achieve this, we should see more revenue produced per employee."
Luis : "Good. Now, Johnny, tell us about production and quality. Do our manufacturing engineers and production workers need help with environmental and quality issues?"
Johnny : "Without question, training will be needed. Moreover, I really need to hire a couple of quality engineers."
Kathy : "I also think that we need an environmental engineer with experience in pharmaceutical manufacturing processes."
Luis : "Good. We certainly shouldn't ignore the necessary infrastructure to bring about the needed changes. Larry, you have been relatively quiet, what do you think about all this? Do you have any suggestions?"
Larry : "Infrastructure is important. If this is all going to work, timely and accurate information will be needed. It is hard to design products and processes with cost being a significant issue without providing the right kind of cost information. We are in the process of revamping the cost management information system so that it is activity based and so that we can provide quality and environmental cost information. After listening to the comments made here, I might also suggest that we need a strategic measurement system that can be used to align the interests of our employees with our improvement strategy. People need to know what is important, that the important factors are being measured, and that they are going to be evaluated and rewarded based on these factors. Finally, I would encourage the use of target costing to help manage costs during product development. To help you all understand the importance of good information, I have assembled some activity data relating to two new products currently under development. These two products will use the same process, using different setups. The data are organized into resource, activity, and cost object modules with an accompanying list of activity drivers to facilitate the use of an ABC software package recently acquired by Zando."
Resource Module (Projected General Ledger Costs of Manufacturing Process Associated with the Two Products)

Activity Module

Cost Object Module (Products and Projected Activity Usage)

List of Activity Drivers

Required
Classify the primary activities into three categories: environmental, quality, and other (neither quality nor environmental). Did some activities end up in more than one category? Explain.
Luis : "You all have received the quarterly financial reports for the last two years. The trends are negative. We are losing market share, profits are decreasing, and our costs seem to be increasing. We need to take actions to increase sales and reduce costs, and we need to do so as quickly as possible. Given our research strengths, it seems to me that our best bet is to grow revenues by introducing new products with proprietary rights. As far as costs are concerned, we need to improve our performance on that dimension as well. Lower per-unit costs for new and existing products are needed. Any suggestions?"
Troy : "For our products, our ability to control costs resides in development-my area-rather than manufacturing. We probably need to pay more attention to product and process design issues to ensure a reasonably level per-unit cost. Revenues are also affected in this stage. Once we patent a drug, the clock begins to tick, and we need to reduce time to market. Significantly, reducing time to market will allow us to generate revenues for a longer period of time than we are currently experiencing. It would also be helpful if we could reduce the cycle time for product development. Both actions would increase revenues. Finally, we can increase revenues by increasing the volume of new products."
Johnny : "There is a lot of merit to the observation that cost reduction opportunities reside mostly in product development. Once a drug is approved, its approval includes the manufacturing process. Any future changes in the manufacturing process require approval from the U.S. Food and Drug Administration. Because of this, we have been reluctant, historically, to engage in process improvement or reengineering. However, I wonder if we shouldn't reconsider this longstanding policy. Some of the quality problems we have could be corrected by changing some of our existing processes, and the costs saved may easily exceed any cost incurred from seeking FDA approval. I think our quality costs are at least 15 percent of sales. That's a lot of opportunity for improvement."
Kathy : "I agree that cost reduction-both in the product development stage and the manufacturing stage-should be a key strategic theme. The environmental area also offers some very good opportunities. A recent pollution prevention act passed by the legislature requires that we calculate the costs of generating hazardous substances for each process. This act was the incentive we needed to begin developing an environmental cost management system. The results so far indicate that environmental costs are much more than we realized. They are estimated to be in the range of 20 to 30 percent of total operating costs. Environmental costs can be reduced by such things as computerizing chemical inventory, eliminating the use of chlorinated solvents and other hazardous materials, reducing our use of virgin feedstocks, and redesigning processes and products so that we can reduce toxic residue release. We can really have a positive environmental impact while simultaneously reducing costs if more attention is paid to environmental issues during product development."
Doreen : "I like what I am hearing because I think that it also affects our ability to increase market share and revenues. For example, environmental impact is one of our major concerns. Some retail pharmacy chains pay particular attention to green products, and right now we are not competing well. Our environmental image is negative and needs to be improved. I am convinced that doing so will allow us to increase market share. Quality is another important matter. We have had to recall two batches of products during the past two years due to poor quality, and this has hurt our image more than the environmental issue. Improving the processes to avoid these kinds of problems will save us a lot of grief. Product image and reputation are essential to increasing customer satisfaction and market share."
Luis : "We started with the need to improve financial performance by increasing revenues and reducing costs. So far, we have some very good suggestions to help achieve these two objectives, but I have some concerns. First, do we have the talent and capabilities to improve quality and environmental performance? Troy, do your professionals really understand what they need to do to improve process and product designs so that we can see the desired quality and environmental improvements? Also, how can we reduce the cycle time for products and the time to market once patented?"
Troy : "Let me answer those questions in order. First, we probably are lacking the understanding on the design issues. We will need to do some training to help our research scientists and chemical engineers understand the consequences. We may need to hire a couple of professionals who have experience in dealing with these issues. Second, we may need to make cycle time and time to market significant performance measures and reward our people for actions that reduce those measures. Our employees need to align their interests with those of the company. If we can achieve this, we should see more revenue produced per employee."
Luis : "Good. Now, Johnny, tell us about production and quality. Do our manufacturing engineers and production workers need help with environmental and quality issues?"
Johnny : "Without question, training will be needed. Moreover, I really need to hire a couple of quality engineers."
Kathy : "I also think that we need an environmental engineer with experience in pharmaceutical manufacturing processes."
Luis : "Good. We certainly shouldn't ignore the necessary infrastructure to bring about the needed changes. Larry, you have been relatively quiet, what do you think about all this? Do you have any suggestions?"
Larry : "Infrastructure is important. If this is all going to work, timely and accurate information will be needed. It is hard to design products and processes with cost being a significant issue without providing the right kind of cost information. We are in the process of revamping the cost management information system so that it is activity based and so that we can provide quality and environmental cost information. After listening to the comments made here, I might also suggest that we need a strategic measurement system that can be used to align the interests of our employees with our improvement strategy. People need to know what is important, that the important factors are being measured, and that they are going to be evaluated and rewarded based on these factors. Finally, I would encourage the use of target costing to help manage costs during product development. To help you all understand the importance of good information, I have assembled some activity data relating to two new products currently under development. These two products will use the same process, using different setups. The data are organized into resource, activity, and cost object modules with an accompanying list of activity drivers to facilitate the use of an ABC software package recently acquired by Zando."
Resource Module (Projected General Ledger Costs of Manufacturing Process Associated with the Two Products)
Activity Module
Cost Object Module (Products and Projected Activity Usage)
List of Activity Drivers
Required
Classify the primary activities into three categories: environmental, quality, and other (neither quality nor environmental). Did some activities end up in more than one category? Explain.
Question
CableTech Bell Corporation (CTB) operates in the telecommunications industry. CTB has two divisions: the Phone Division and the Cable Service Division. The Phone Division manufactures telephones in several plants located in the Midwest. The product lines run from relatively inexpensive touch-tone wall and desk phones to expensive, high-quality cellular phones. CTB also operates a cable TV service in Ohio. The Cable Service Division offers three products: a basic package with 25 channels; an enhanced package, which is the basic package plus 15 additional channels and two movie channels; and a premium package, which is the basic package plus 25 additional channels and three movie channels.
The Cable Service Division reported the following activity for the month of March:

The unit costs are divided as follows: 70 percent production and 30 percent marketing and customer service. Direct labor cost is the only driver used for tracing. Typically, the division uses only production costs to define unit costs. The preceding unit product cost information was provided at the request of the marketing manager and was the result of a special study.
Bryce Youngers, the president of CTB, is reasonably satisfied with the performance of the Cable Service Division. March's performance is fairly typical of what has been happening over the past two years. The Phone Division, however, is another matter. Its overall profit performance has been declining. Two years ago, income before income taxes had been about 25 percent of sales. March's dismal performance was also typical for what has been happening this year and is expected to continue-unless some action by management is taken to reverse the trend. During March, the Phone Division reported the following results:


During March, the Phone Division purchased materials totaling $312,000. There are no significant inventories of supplies (beginning or ending). Supplies are accounted for separately from materials. CTB's Phone Division had sales totaling $1,170,000 for March.
Based on March's results, Bryce decided to meet with three of the Phone Division's managers: Kim Breashears, divisional manager; Jacob Carder, divisional controller; and Larry Hartley, sales manager. A transcript of their recorded conversation is given next:
Bryce: "March's profit performance is down once again, and I think we need to see if we can identify the problem and correct it-before it's too late. Kim, what's your assessment of the situation?"
Kim: "Foreign competition is eating us alive. They are coming in with lower-priced phones of comparable or higher quality than our own. I've talked with several of the retailers that carry our lines, and they say the same. They are convinced that we can sell more if we lower our prices."
Larry: "They're right. If we could lower our prices by 10 to 15 percent, I think that we'd regain most ofour lost market share. But we also need to make sure that the quality of our products meets that of our competitors. As you know, we are spending a lot of money each month on rework and warranties. That worries me. I'd like to see that warranty cost cut by 70 to 80 percent. If we could do that, then customers would be more satisfied with our products, and I bet that we would not only regain our market share but increase it."
Jacob: "Lowering prices without lowering per-unit costs will not help us increase our profitability.
I think we need to improve our cost accounting system. I am not confident that we really know how much each of our product lines is costing us. It may be that we are overpricing some of our units because we are overcosting them. We may be underpricing other units."
Larry: "This sounds promising-especially if the overcosting is for some of our high-volume lines. A price decrease for these products would make the biggest difference-and if we knew they were overcosted, then we could offer immediate price reductions."
Bryce: "Jacob, I need more explanation. We have been using the same cost accounting system for the last 10 years. Why would it be a problem?"
Jacob: "I think that our manufacturing environment has changed. Over the years, we have added a lot of different product lines. Some of these products make very different demands on our manufacturing overhead resources. We trace-or attempt to trace-overhead costs to the different products using direct labor cost, a unit-based cost driver. We may be doing more allocation than tracing. If so, then we probably don't have a very good idea of our actual product costs. Also, as you know, with the way computer technology has changed over time, it is easier and cheaper to collect and use detailed information-information that will allow us to assign costs more accurately."
Bryce: "This may be something we should explore. Jacob, what do you suggest?"
Jacob: "If we want more accurate product costs and if we really want to get in the cost reduction business, then we need to understand how costs behave. In particular, we need to understand activity cost behavior. Knowing what activities we perform, why we perform them, and how well we perform them will help us identify areas for improvement. We also need to know how the different products consume activity resources. What this boils down to is the need to use an activity-based management system. But before we jump into this, we need some idea of whether non-unit-based drivers add anything. Activity-based management is not an inexpensive undertaking. So I suggest that we do a preliminary study to see if direct labor cost is adequate for tracing. If not, then maybe some non-unit-drivers might be needed. In fact, if you would like,
I can gather some data that will provide some evidence on the usefulness of the activity-based approach."
Bryce: "What do you think, Kim? It's your division."
Kim: "What Jacob has said sounds promising. I think he should pursue it and do so quickly. I also think that we need to look at improving our quality. It sounds like we have a problem there. If quality could be improved, then our costs will drop. I'll talk to our quality people. Jacob, in the meantime, find out for us if moving to an activity-based system is the way to go. How much time do you need?"
Jacob: "I have already been gathering data. I could probably have a report within two weeks."
Based on my initial analysis, I am confident that an ABC system will offer significant improvement. For one of our conventional phone plants, I regressed total monthly overhead cost on monthly direct labor cost using the following 15 months of data:

The results were revealing. Although direct labor cost appears to be a driver of overhead cost, it really doesn't explain a lot of the variation. I then searched for other drivers-particularly non-unit drivers-that might offer more insight into overhead cost behavior. Every time a batch is produced, material movement occurs, regardless of the size of the batch. The number of moves seemed like a more logical driver. I was able to gather only 10 months of data for this. (Our information system doesn't provide the number of moves, so I had to build the data set by interviewing production personnel.) This information is provided next:

The regression results were impressive. There is no question in my mind that the number of moves is a good driver of materials-handling costs. Using the number of moves to assign materials-handling costs to products would likely be better than the cost assignment using direct labor cost. Furthermore, since small batches use the same number of moves as large batches, we have some evidence that we may be overcosting our high-volume products.
I looked at one more overhead activity: inspecting products. We have 15 inspectors who are paid an average of $4,000 per month. Each inspector offers about 160 hours of inspection capacity per month. However, it appears that they actually work only about 80 percent of those hours. The drop in demand we have experienced explains this idle time. I see no evidence of variable cost behavior here. I'm not exactly sure how to treat inspection cost, but I think that it is more related to inspection hours than direct labor cost. Some of the other overhead activities seem to be non-unit-level, as well-enough, in fact, to be concerned about how we assign costs.
After receiving the memo, Kim was intrigued. She then asked Jacob to use the same phone plant as a pilot for a preliminary ABC analysis. She instructed him to assign all overhead costs to the plant's two products (Regular and Deluxe models), using only four activities. The four activities were rework, moving materials, inspecting products, and a general catch-all activity labeled "other manufacturing activities." From the special study already performed, she knew that materials handling and inspecting involved significant cost; from production reports, she also knew that the rework activity involved significant cost. If the ABC and unit-based cost assignments did not differ by breaking out these three major activities, then ABC may not matter.
Pursuant to the request, Jacob produced the following cost and driver information:

Expected activity demands:

Required
Suppose someone urged Kim to look into Time-Driven Activity-Based Costing (TDABC) instead of ABC. What would be the advantages of using a TDABC aproach?
The Cable Service Division reported the following activity for the month of March:
The unit costs are divided as follows: 70 percent production and 30 percent marketing and customer service. Direct labor cost is the only driver used for tracing. Typically, the division uses only production costs to define unit costs. The preceding unit product cost information was provided at the request of the marketing manager and was the result of a special study.
Bryce Youngers, the president of CTB, is reasonably satisfied with the performance of the Cable Service Division. March's performance is fairly typical of what has been happening over the past two years. The Phone Division, however, is another matter. Its overall profit performance has been declining. Two years ago, income before income taxes had been about 25 percent of sales. March's dismal performance was also typical for what has been happening this year and is expected to continue-unless some action by management is taken to reverse the trend. During March, the Phone Division reported the following results:
During March, the Phone Division purchased materials totaling $312,000. There are no significant inventories of supplies (beginning or ending). Supplies are accounted for separately from materials. CTB's Phone Division had sales totaling $1,170,000 for March.
Based on March's results, Bryce decided to meet with three of the Phone Division's managers: Kim Breashears, divisional manager; Jacob Carder, divisional controller; and Larry Hartley, sales manager. A transcript of their recorded conversation is given next:
Bryce: "March's profit performance is down once again, and I think we need to see if we can identify the problem and correct it-before it's too late. Kim, what's your assessment of the situation?"
Kim: "Foreign competition is eating us alive. They are coming in with lower-priced phones of comparable or higher quality than our own. I've talked with several of the retailers that carry our lines, and they say the same. They are convinced that we can sell more if we lower our prices."
Larry: "They're right. If we could lower our prices by 10 to 15 percent, I think that we'd regain most ofour lost market share. But we also need to make sure that the quality of our products meets that of our competitors. As you know, we are spending a lot of money each month on rework and warranties. That worries me. I'd like to see that warranty cost cut by 70 to 80 percent. If we could do that, then customers would be more satisfied with our products, and I bet that we would not only regain our market share but increase it."
Jacob: "Lowering prices without lowering per-unit costs will not help us increase our profitability.
I think we need to improve our cost accounting system. I am not confident that we really know how much each of our product lines is costing us. It may be that we are overpricing some of our units because we are overcosting them. We may be underpricing other units."
Larry: "This sounds promising-especially if the overcosting is for some of our high-volume lines. A price decrease for these products would make the biggest difference-and if we knew they were overcosted, then we could offer immediate price reductions."
Bryce: "Jacob, I need more explanation. We have been using the same cost accounting system for the last 10 years. Why would it be a problem?"
Jacob: "I think that our manufacturing environment has changed. Over the years, we have added a lot of different product lines. Some of these products make very different demands on our manufacturing overhead resources. We trace-or attempt to trace-overhead costs to the different products using direct labor cost, a unit-based cost driver. We may be doing more allocation than tracing. If so, then we probably don't have a very good idea of our actual product costs. Also, as you know, with the way computer technology has changed over time, it is easier and cheaper to collect and use detailed information-information that will allow us to assign costs more accurately."
Bryce: "This may be something we should explore. Jacob, what do you suggest?"
Jacob: "If we want more accurate product costs and if we really want to get in the cost reduction business, then we need to understand how costs behave. In particular, we need to understand activity cost behavior. Knowing what activities we perform, why we perform them, and how well we perform them will help us identify areas for improvement. We also need to know how the different products consume activity resources. What this boils down to is the need to use an activity-based management system. But before we jump into this, we need some idea of whether non-unit-based drivers add anything. Activity-based management is not an inexpensive undertaking. So I suggest that we do a preliminary study to see if direct labor cost is adequate for tracing. If not, then maybe some non-unit-drivers might be needed. In fact, if you would like,
I can gather some data that will provide some evidence on the usefulness of the activity-based approach."
Bryce: "What do you think, Kim? It's your division."
Kim: "What Jacob has said sounds promising. I think he should pursue it and do so quickly. I also think that we need to look at improving our quality. It sounds like we have a problem there. If quality could be improved, then our costs will drop. I'll talk to our quality people. Jacob, in the meantime, find out for us if moving to an activity-based system is the way to go. How much time do you need?"
Jacob: "I have already been gathering data. I could probably have a report within two weeks."
Based on my initial analysis, I am confident that an ABC system will offer significant improvement. For one of our conventional phone plants, I regressed total monthly overhead cost on monthly direct labor cost using the following 15 months of data:
The results were revealing. Although direct labor cost appears to be a driver of overhead cost, it really doesn't explain a lot of the variation. I then searched for other drivers-particularly non-unit drivers-that might offer more insight into overhead cost behavior. Every time a batch is produced, material movement occurs, regardless of the size of the batch. The number of moves seemed like a more logical driver. I was able to gather only 10 months of data for this. (Our information system doesn't provide the number of moves, so I had to build the data set by interviewing production personnel.) This information is provided next:
The regression results were impressive. There is no question in my mind that the number of moves is a good driver of materials-handling costs. Using the number of moves to assign materials-handling costs to products would likely be better than the cost assignment using direct labor cost. Furthermore, since small batches use the same number of moves as large batches, we have some evidence that we may be overcosting our high-volume products.
I looked at one more overhead activity: inspecting products. We have 15 inspectors who are paid an average of $4,000 per month. Each inspector offers about 160 hours of inspection capacity per month. However, it appears that they actually work only about 80 percent of those hours. The drop in demand we have experienced explains this idle time. I see no evidence of variable cost behavior here. I'm not exactly sure how to treat inspection cost, but I think that it is more related to inspection hours than direct labor cost. Some of the other overhead activities seem to be non-unit-level, as well-enough, in fact, to be concerned about how we assign costs.
After receiving the memo, Kim was intrigued. She then asked Jacob to use the same phone plant as a pilot for a preliminary ABC analysis. She instructed him to assign all overhead costs to the plant's two products (Regular and Deluxe models), using only four activities. The four activities were rework, moving materials, inspecting products, and a general catch-all activity labeled "other manufacturing activities." From the special study already performed, she knew that materials handling and inspecting involved significant cost; from production reports, she also knew that the rework activity involved significant cost. If the ABC and unit-based cost assignments did not differ by breaking out these three major activities, then ABC may not matter.
Pursuant to the request, Jacob produced the following cost and driver information:
Expected activity demands:
Required
Suppose someone urged Kim to look into Time-Driven Activity-Based Costing (TDABC) instead of ABC. What would be the advantages of using a TDABC aproach?
Question
Zando Pharmaceuticals is an affiliate of the German-based Heisenberg Corporation, which employs 40,000 worldwide. Zando's St. Louis facility houses the U.S. corporate headquarters and Research and Development (R D). It produces 30 products, using 28 different batch processes. The facility has 2,000 employees on-site. In recent years, Zando's profitability has suffered, which can be attributed to increased competition, customer dissatisfaction, and regulatory pressures. Luis Alvarado, president of Zando, called a meeting to consider ways to improve profitability. He labeled the meeting a strategic planning session and invited the following officers: Kathy Shorts, environmental manager; Troy Lewis, head of R D; Johnny Mizukawa, vice president of production and quality; Larry Sower, vice president of finance; and Doreen Savara, marketing vice president.
Luis : "You all have received the quarterly financial reports for the last two years. The trends are negative. We are losing market share, profits are decreasing, and our costs seem to be increasing. We need to take actions to increase sales and reduce costs, and we need to do so as quickly as possible. Given our research strengths, it seems to me that our best bet is to grow revenues by introducing new products with proprietary rights. As far as costs are concerned, we need to improve our performance on that dimension as well. Lower per-unit costs for new and existing products are needed. Any suggestions?"
Troy : "For our products, our ability to control costs resides in development-my area-rather than manufacturing. We probably need to pay more attention to product and process design issues to ensure a reasonably level per-unit cost. Revenues are also affected in this stage. Once we patent a drug, the clock begins to tick, and we need to reduce time to market. Significantly, reducing time to market will allow us to generate revenues for a longer period of time than we are currently experiencing. It would also be helpful if we could reduce the cycle time for product development. Both actions would increase revenues. Finally, we can increase revenues by increasing the volume of new products."
Johnny : "There is a lot of merit to the observation that cost reduction opportunities reside mostly in product development. Once a drug is approved, its approval includes the manufacturing process. Any future changes in the manufacturing process require approval from the U.S. Food and Drug Administration. Because of this, we have been reluctant, historically, to engage in process improvement or reengineering. However, I wonder if we shouldn't reconsider this longstanding policy. Some of the quality problems we have could be corrected by changing some of our existing processes, and the costs saved may easily exceed any cost incurred from seeking FDA approval. I think our quality costs are at least 15 percent of sales. That's a lot of opportunity for improvement."
Kathy : "I agree that cost reduction-both in the product development stage and the manufacturing stage-should be a key strategic theme. The environmental area also offers some very good opportunities. A recent pollution prevention act passed by the legislature requires that we calculate the costs of generating hazardous substances for each process. This act was the incentive we needed to begin developing an environmental cost management system. The results so far indicate that environmental costs are much more than we realized. They are estimated to be in the range of 20 to 30 percent of total operating costs. Environmental costs can be reduced by such things as computerizing chemical inventory, eliminating the use of chlorinated solvents and other hazardous materials, reducing our use of virgin feedstocks, and redesigning processes and products so that we can reduce toxic residue release. We can really have a positive environmental impact while simultaneously reducing costs if more attention is paid to environmental issues during product development."
Doreen : "I like what I am hearing because I think that it also affects our ability to increase market share and revenues. For example, environmental impact is one of our major concerns. Some retail pharmacy chains pay particular attention to green products, and right now we are not competing well. Our environmental image is negative and needs to be improved. I am convinced that doing so will allow us to increase market share. Quality is another important matter. We have had to recall two batches of products during the past two years due to poor quality, and this has hurt our image more than the environmental issue. Improving the processes to avoid these kinds of problems will save us a lot of grief. Product image and reputation are essential to increasing customer satisfaction and market share."
Luis : "We started with the need to improve financial performance by increasing revenues and reducing costs. So far, we have some very good suggestions to help achieve these two objectives, but I have some concerns. First, do we have the talent and capabilities to improve quality and environmental performance? Troy, do your professionals really understand what they need to do to improve process and product designs so that we can see the desired quality and environmental improvements? Also, how can we reduce the cycle time for products and the time to market once patented?"
Troy : "Let me answer those questions in order. First, we probably are lacking the understanding on the design issues. We will need to do some training to help our research scientists and chemical engineers understand the consequences. We may need to hire a couple of professionals who have experience in dealing with these issues. Second, we may need to make cycle time and time to market significant performance measures and reward our people for actions that reduce those measures. Our employees need to align their interests with those of the company. If we can achieve this, we should see more revenue produced per employee."
Luis : "Good. Now, Johnny, tell us about production and quality. Do our manufacturing engineers and production workers need help with environmental and quality issues?"
Johnny : "Without question, training will be needed. Moreover, I really need to hire a couple of quality engineers."
Kathy : "I also think that we need an environmental engineer with experience in pharmaceutical manufacturing processes."
Luis : "Good. We certainly shouldn't ignore the necessary infrastructure to bring about the needed changes. Larry, you have been relatively quiet, what do you think about all this? Do you have any suggestions?"
Larry : "Infrastructure is important. If this is all going to work, timely and accurate information will be needed. It is hard to design products and processes with cost being a significant issue without providing the right kind of cost information. We are in the process of revamping the cost management information system so that it is activity based and so that we can provide quality and environmental cost information. After listening to the comments made here, I might also suggest that we need a strategic measurement system that can be used to align the interests of our employees with our improvement strategy. People need to know what is important, that the important factors are being measured, and that they are going to be evaluated and rewarded based on these factors. Finally, I would encourage the use of target costing to help manage costs during product development. To help you all understand the importance of good information, I have assembled some activity data relating to two new products currently under development. These two products will use the same process, using different setups. The data are organized into resource, activity, and cost object modules with an accompanying list of activity drivers to facilitate the use of an ABC software package recently acquired by Zando."
Resource Module (Projected General Ledger Costs of Manufacturing Process Associated with the Two Products)
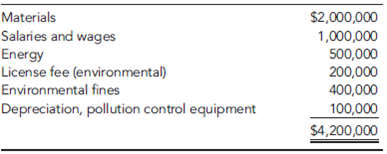
Activity Module
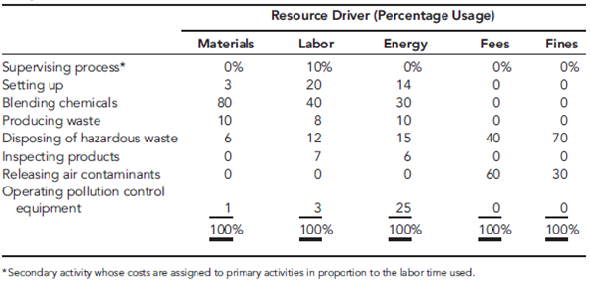
Cost Object Module (Products and Projected Activity Usage)

List of Activity Drivers

Required
Calculate the cost per unit for each of the proposed products using primary activity rates. Now, calculate the environmental cost per unit and the quality cost per unit. What does this tell you about the relative desirability of the two products?
Luis : "You all have received the quarterly financial reports for the last two years. The trends are negative. We are losing market share, profits are decreasing, and our costs seem to be increasing. We need to take actions to increase sales and reduce costs, and we need to do so as quickly as possible. Given our research strengths, it seems to me that our best bet is to grow revenues by introducing new products with proprietary rights. As far as costs are concerned, we need to improve our performance on that dimension as well. Lower per-unit costs for new and existing products are needed. Any suggestions?"
Troy : "For our products, our ability to control costs resides in development-my area-rather than manufacturing. We probably need to pay more attention to product and process design issues to ensure a reasonably level per-unit cost. Revenues are also affected in this stage. Once we patent a drug, the clock begins to tick, and we need to reduce time to market. Significantly, reducing time to market will allow us to generate revenues for a longer period of time than we are currently experiencing. It would also be helpful if we could reduce the cycle time for product development. Both actions would increase revenues. Finally, we can increase revenues by increasing the volume of new products."
Johnny : "There is a lot of merit to the observation that cost reduction opportunities reside mostly in product development. Once a drug is approved, its approval includes the manufacturing process. Any future changes in the manufacturing process require approval from the U.S. Food and Drug Administration. Because of this, we have been reluctant, historically, to engage in process improvement or reengineering. However, I wonder if we shouldn't reconsider this longstanding policy. Some of the quality problems we have could be corrected by changing some of our existing processes, and the costs saved may easily exceed any cost incurred from seeking FDA approval. I think our quality costs are at least 15 percent of sales. That's a lot of opportunity for improvement."
Kathy : "I agree that cost reduction-both in the product development stage and the manufacturing stage-should be a key strategic theme. The environmental area also offers some very good opportunities. A recent pollution prevention act passed by the legislature requires that we calculate the costs of generating hazardous substances for each process. This act was the incentive we needed to begin developing an environmental cost management system. The results so far indicate that environmental costs are much more than we realized. They are estimated to be in the range of 20 to 30 percent of total operating costs. Environmental costs can be reduced by such things as computerizing chemical inventory, eliminating the use of chlorinated solvents and other hazardous materials, reducing our use of virgin feedstocks, and redesigning processes and products so that we can reduce toxic residue release. We can really have a positive environmental impact while simultaneously reducing costs if more attention is paid to environmental issues during product development."
Doreen : "I like what I am hearing because I think that it also affects our ability to increase market share and revenues. For example, environmental impact is one of our major concerns. Some retail pharmacy chains pay particular attention to green products, and right now we are not competing well. Our environmental image is negative and needs to be improved. I am convinced that doing so will allow us to increase market share. Quality is another important matter. We have had to recall two batches of products during the past two years due to poor quality, and this has hurt our image more than the environmental issue. Improving the processes to avoid these kinds of problems will save us a lot of grief. Product image and reputation are essential to increasing customer satisfaction and market share."
Luis : "We started with the need to improve financial performance by increasing revenues and reducing costs. So far, we have some very good suggestions to help achieve these two objectives, but I have some concerns. First, do we have the talent and capabilities to improve quality and environmental performance? Troy, do your professionals really understand what they need to do to improve process and product designs so that we can see the desired quality and environmental improvements? Also, how can we reduce the cycle time for products and the time to market once patented?"
Troy : "Let me answer those questions in order. First, we probably are lacking the understanding on the design issues. We will need to do some training to help our research scientists and chemical engineers understand the consequences. We may need to hire a couple of professionals who have experience in dealing with these issues. Second, we may need to make cycle time and time to market significant performance measures and reward our people for actions that reduce those measures. Our employees need to align their interests with those of the company. If we can achieve this, we should see more revenue produced per employee."
Luis : "Good. Now, Johnny, tell us about production and quality. Do our manufacturing engineers and production workers need help with environmental and quality issues?"
Johnny : "Without question, training will be needed. Moreover, I really need to hire a couple of quality engineers."
Kathy : "I also think that we need an environmental engineer with experience in pharmaceutical manufacturing processes."
Luis : "Good. We certainly shouldn't ignore the necessary infrastructure to bring about the needed changes. Larry, you have been relatively quiet, what do you think about all this? Do you have any suggestions?"
Larry : "Infrastructure is important. If this is all going to work, timely and accurate information will be needed. It is hard to design products and processes with cost being a significant issue without providing the right kind of cost information. We are in the process of revamping the cost management information system so that it is activity based and so that we can provide quality and environmental cost information. After listening to the comments made here, I might also suggest that we need a strategic measurement system that can be used to align the interests of our employees with our improvement strategy. People need to know what is important, that the important factors are being measured, and that they are going to be evaluated and rewarded based on these factors. Finally, I would encourage the use of target costing to help manage costs during product development. To help you all understand the importance of good information, I have assembled some activity data relating to two new products currently under development. These two products will use the same process, using different setups. The data are organized into resource, activity, and cost object modules with an accompanying list of activity drivers to facilitate the use of an ABC software package recently acquired by Zando."
Resource Module (Projected General Ledger Costs of Manufacturing Process Associated with the Two Products)
Activity Module
Cost Object Module (Products and Projected Activity Usage)
List of Activity Drivers
Required
Calculate the cost per unit for each of the proposed products using primary activity rates. Now, calculate the environmental cost per unit and the quality cost per unit. What does this tell you about the relative desirability of the two products?

Unlock Deck
Sign up to unlock the cards in this deck!
Unlock Deck
Unlock Deck
1/33
Play
Full screen (f)
Deck 21: Cases
1
Beauville Furniture Corporation produces sofas, recliners, and lounge chairs. Beauville is located in a medium-sized community in the southeastern part of the United States. It is a major employer in the community. In fact, the economic well-being of the community is tied very strongly to Beauville. Beauville operates a sawmill, a fabric plant, and a furniture plant in the same community.
The sawmill buys logs from independent producers. The sawmill then processes the logs into four grades of lumber: firsts and seconds, No. 1 common, No. 2 common, and No. 3 common. All costs incurred in the mill are common to the four grades of lumber. All four grades of lumber are used by the furniture plant. The mill transfers everything it produces to the furniture plant, and the grades are transferred at cost. Trucks are used to move the lumber from the mill to the furniture plant. Although no outside sales exist, the mill could sell to external customers, and the selling prices of the four grades are known.
The fabric plant is responsible for producing the fabric that is used by the furniture plant. To produce three totally different fabrics (identified by fabric ID codes FB60, FB70, and FB80, respectively), the plant has three separate production operations-one for each fabric. Thus, production of all three fabrics occurs at the same time in different locations in the plant. Each fabric's production operation has two processes: the weaving and pattern process and the coloring and bolting process. In the weaving and pattern process, yarn is used to create yards of fabric with different designs. In the next process, the fabric is dyed, cut into 25-yard sections, and wrapped around cardboard rods to form 25-yard bolts. The bolts are transported by forklift to the furniture plant's Receiving Department. All of the output of the fabric plant is used by the furniture plant (to produce the sofas and chairs). For accounting purposes, the fabric is transferred at cost to the furniture plant.
The furniture plant produces orders for customers on a special-order basis. The customers specify the quantity, style, fabric, lumber grade, and pattern. Typically, jobs are large (involving at least 500 units). The plant has two production departments: Cutting and Assembly. In the Cutting Department, the fabric and wooden frame components are sized and cut. Other components are purchased from external suppliers and are removed from stores as needed for assembly. After the fabric and wooden components are finished for the entire job, they are moved to the Assembly Department. The Assembly Department takes the individual components and assembles the sofas (or chairs).
Beauville Furniture has been in business for over two decades and has a good reputation. However, during the past five years, Beauville experienced eroding profits and declining sales. Bids were increasingly lost (even aggressive bids) on the more popular models. Yet, the company was winning bids on some of the more-difficult-to-produce items. Lance Hays, the owner and manager, was frustrated. He simply couldn't understand how some of his competitors could sell for such low prices. On a common sofa job involving 500 units, Beauville's bids were running $25 per unit, or $12,500 per job more than the winning bids (on average). Yet, on the more difficult items, Beauville's bids were running about $60 per unit less than the next closest bid. Gisela Berling, vice president of finance, was assigned the task of preparing a cost analysis of the company's product lines. Lance wanted to know if the company's costs were excessive. Perhaps the company was being wasteful, and it was simply costing more to produce furniture than it was costing its competitors.
Gisela prepared herself by reading recent literature on cost management and product costing and attending several conferences that explored the same issues. She then reviewed the costing procedures of the company's mill and two plants and did a preliminary assessment of their soundness. The production costs of the mill were common to all lumber grades and were assigned using the physical units method. Since the output and production costs were fairly uniform throughout the year, the mill used an actual costing system. Although Gisela had no difficulty with actual costing, she decided to explore the effects of using the sales-value-at-split-off method. Thus, cost and production data for the mill were gathered so that an analysis could be conducted. The two plants used normal costing systems. The fabric plant used process costing, and the furniture plant used job-order costing. Both plants used plantwide overhead rates based on direct labor hours. Based on her initial reviews, she concluded that the costing procedures for the fabric plant were satisfactory. Essentially, there was no evidence of product diversity. A statistical analysis revealed that about 90 percent of the variability in the plant's overhead cost could be explained by direct labor hours. Thus, the use of a plantwide overhead rate based on direct labor hours seemed justified. What did concern her, though, was the material waste that she observed in the plant. Maybe a standard cost system would be useful for increasing the overall cost efficiency of the plant. Consequently, as part of her report to Lance, she decided to include a description of the fabric plant's costing procedures-at least for one of the fabric types. She also decided to develop a standard cost sheet for the chosen fabric. The furniture plant, however, was a more difficult matter. Product diversity was present and could be causing some distortions in product costs. Furthermore, statistical analysis revealed that only about 40 percent of the variability in overhead cost was explained by the direct labor hours. She decided that additional analysis was needed so that a sound product costing method could be recommended. One possibility would be to increase the number of overhead rates. Thus, she decided to include departmental data so that the effect of moving to departmental rates could be assessed. Finally, she also wanted to explore the possibility of converting the sawmill and fabric plant into profit centers and changing the existing transfer pricing policy.
With the cooperation of the cost accounting manager for the mill and each plant's controller, she gathered the following data for last year:
Sawmill:
Joint manufacturing costs: $900,000
Fabric Plant:
Budgeted overhead: $1,200,000 (50% fixed)
Practical volume (direct labor hours): 120,000 hours
Actual overhead: $1,150,000 (50% fixed)
Actual hours worked:
Departmental data on Fabric FB70 (actual costs and actual outcomes):
*Unitsare measured in yards for the Weaving and Pattern Department and in bolts forthe Coloring and Bolting Department. Note: With the exception of the cardboard bolt rods, materials are added at the beginning of each process. The cost of the rods is relatively insignificant and is included in overhead.
Proposed standard cost sheet for Fabric FB70 (for the Coloring and Bolting Department only):
Furniture Plant:
Departmental data (budgeted):
After some discussion with the furniture plant controller, Gisela decided to use machine hours to calculate the overhead rate for the Cutting Department and direct labor hours for the Assembly Department rate (the Cutting Department was more automated than the Assembly Department). As part of her report, she wanted to compare the effects of plantwide rates and departmental rates on the cost of jobs. She wanted to know if overhead costing could be the source of the pricing problems the company was experiencing.
To assess the effect of the different overhead assignment procedures, Gisela decided to examine two prospective jobs. One job, Job A500, could produce 500 sofas, using a frequently requested style and Fabric FB70. Bids on this type of job were being lost more frequently to competitors. The second job, Job B75, would produce 75 specially designed recliners. This job involved a new design and was more difficult for the workers to build. It involved some special cutting requirements and an unfamiliar assembly. Recently, the company seemed to be winning more bids on jobs of this type. To compute the costs of the two jobs, Gisela assembled the following information on the two jobs:
Job A500:
Job B75:
Required
Allocate the joint manufacturing costs to each grade, and calculate the cost per board foot for each grade: (a) using the physical units method of allocation, and (b) using the sales-value-at- split-off method. Which method should the mill use? Explain. What is the effect on the cost of each proposed job if the mill switches to the sales-value-at-split-off method?
From the case of Beauville Furniture Corporation the following calculations are made:
1.(a)Given:
 Apportioned on the basis of quantity produced:
Allocation of joint manufacturing cost by using the physical unit's method :
First and second
 No. 1 common
 No. 2 common
 No.3 common
 b.
b.
Joint manufacturing costs are distributed based on split-off value
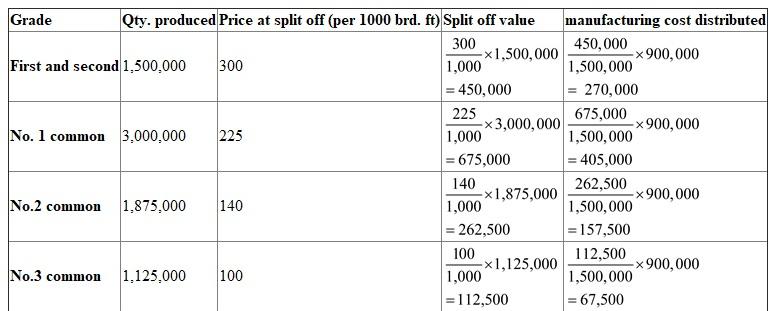
1.(a)Given:
Apportioned on the basis of quantity produced:Allocation of joint manufacturing cost by using the physical unit's method :
First and second
No. 1 common No. 2 common No.3 common b. Joint manufacturing costs are distributed based on split-off value
2
Zando Pharmaceuticals is an affiliate of the German-based Heisenberg Corporation, which employs 40,000 worldwide. Zando's St. Louis facility houses the U.S. corporate headquarters and Research and Development (R D). It produces 30 products, using 28 different batch processes. The facility has 2,000 employees on-site. In recent years, Zando's profitability has suffered, which can be attributed to increased competition, customer dissatisfaction, and regulatory pressures. Luis Alvarado, president of Zando, called a meeting to consider ways to improve profitability. He labeled the meeting a strategic planning session and invited the following officers: Kathy Shorts, environmental manager; Troy Lewis, head of R D; Johnny Mizukawa, vice president of production and quality; Larry Sower, vice president of finance; and Doreen Savara, marketing vice president.
Luis : "You all have received the quarterly financial reports for the last two years. The trends are negative. We are losing market share, profits are decreasing, and our costs seem to be increasing. We need to take actions to increase sales and reduce costs, and we need to do so as quickly as possible. Given our research strengths, it seems to me that our best bet is to grow revenues by introducing new products with proprietary rights. As far as costs are concerned, we need to improve our performance on that dimension as well. Lower per-unit costs for new and existing products are needed. Any suggestions?"
Troy : "For our products, our ability to control costs resides in development-my area-rather than manufacturing. We probably need to pay more attention to product and process design issues to ensure a reasonably level per-unit cost. Revenues are also affected in this stage. Once we patent a drug, the clock begins to tick, and we need to reduce time to market. Significantly, reducing time to market will allow us to generate revenues for a longer period of time than we are currently experiencing. It would also be helpful if we could reduce the cycle time for product development. Both actions would increase revenues. Finally, we can increase revenues by increasing the volume of new products."
Johnny : "There is a lot of merit to the observation that cost reduction opportunities reside mostly in product development. Once a drug is approved, its approval includes the manufacturing process. Any future changes in the manufacturing process require approval from the U.S. Food and Drug Administration. Because of this, we have been reluctant, historically, to engage in process improvement or reengineering. However, I wonder if we shouldn't reconsider this longstanding policy. Some of the quality problems we have could be corrected by changing some of our existing processes, and the costs saved may easily exceed any cost incurred from seeking FDA approval. I think our quality costs are at least 15 percent of sales. That's a lot of opportunity for improvement."
Kathy : "I agree that cost reduction-both in the product development stage and the manufacturing stage-should be a key strategic theme. The environmental area also offers some very good opportunities. A recent pollution prevention act passed by the legislature requires that we calculate the costs of generating hazardous substances for each process. This act was the incentive we needed to begin developing an environmental cost management system. The results so far indicate that environmental costs are much more than we realized. They are estimated to be in the range of 20 to 30 percent of total operating costs. Environmental costs can be reduced by such things as computerizing chemical inventory, eliminating the use of chlorinated solvents and other hazardous materials, reducing our use of virgin feedstocks, and redesigning processes and products so that we can reduce toxic residue release. We can really have a positive environmental impact while simultaneously reducing costs if more attention is paid to environmental issues during product development."
Doreen : "I like what I am hearing because I think that it also affects our ability to increase market share and revenues. For example, environmental impact is one of our major concerns. Some retail pharmacy chains pay particular attention to green products, and right now we are not competing well. Our environmental image is negative and needs to be improved. I am convinced that doing so will allow us to increase market share. Quality is another important matter. We have had to recall two batches of products during the past two years due to poor quality, and this has hurt our image more than the environmental issue. Improving the processes to avoid these kinds of problems will save us a lot of grief. Product image and reputation are essential to increasing customer satisfaction and market share."
Luis : "We started with the need to improve financial performance by increasing revenues and reducing costs. So far, we have some very good suggestions to help achieve these two objectives, but I have some concerns. First, do we have the talent and capabilities to improve quality and environmental performance? Troy, do your professionals really understand what they need to do to improve process and product designs so that we can see the desired quality and environmental improvements? Also, how can we reduce the cycle time for products and the time to market once patented?"
Troy : "Let me answer those questions in order. First, we probably are lacking the understanding on the design issues. We will need to do some training to help our research scientists and chemical engineers understand the consequences. We may need to hire a couple of professionals who have experience in dealing with these issues. Second, we may need to make cycle time and time to market significant performance measures and reward our people for actions that reduce those measures. Our employees need to align their interests with those of the company. If we can achieve this, we should see more revenue produced per employee."
Luis : "Good. Now, Johnny, tell us about production and quality. Do our manufacturing engineers and production workers need help with environmental and quality issues?"
Johnny : "Without question, training will be needed. Moreover, I really need to hire a couple of quality engineers."
Kathy : "I also think that we need an environmental engineer with experience in pharmaceutical manufacturing processes."
Luis : "Good. We certainly shouldn't ignore the necessary infrastructure to bring about the needed changes. Larry, you have been relatively quiet, what do you think about all this? Do you have any suggestions?"
Larry : "Infrastructure is important. If this is all going to work, timely and accurate information will be needed. It is hard to design products and processes with cost being a significant issue without providing the right kind of cost information. We are in the process of revamping the cost management information system so that it is activity based and so that we can provide quality and environmental cost information. After listening to the comments made here, I might also suggest that we need a strategic measurement system that can be used to align the interests of our employees with our improvement strategy. People need to know what is important, that the important factors are being measured, and that they are going to be evaluated and rewarded based on these factors. Finally, I would encourage the use of target costing to help manage costs during product development. To help you all understand the importance of good information, I have assembled some activity data relating to two new products currently under development. These two products will use the same process, using different setups. The data are organized into resource, activity, and cost object modules with an accompanying list of activity drivers to facilitate the use of an ABC software package recently acquired by Zando."
Resource Module (Projected General Ledger Costs of Manufacturing Process Associated with the Two Products)
Activity Module
Cost Object Module (Products and Projected Activity Usage)
List of Activity Drivers
Required
Following Larry's suggestion, Luis decided to use target costing to help improve new product profitability. Based on analyses by Luis and Doreen, the target prices for XK1 and XK5 are $50 per pound and $35 per pound, respectively. Luis has indicated that any new product should earn a gross profit equal to 20 percent of sales. Based on this information, answer the following:
a. What is the target cost for each product? Given this information, what should be done?
b. Suppose Doreen indicates that sales for each product can be increased by 50 percent if the selling price is lowered by 10 percent. Assuming the same target profit (Luis wants the original target profit per pound maintained), calculate the new target costs. If all non-value-added costs were eliminated, could the target be met? (Calculate the unit cost at the 50,000-unit level.) Now, calculate the effect on total profits under a scenario where non-value-added costs are not eliminated versus a scenario where all non-value-added costs are eliminated. (Include in this analysis any possible increase in sales volume.)
not answer
3
Beauville Furniture Corporation produces sofas, recliners, and lounge chairs. Beauville is located in a medium-sized community in the southeastern part of the United States. It is a major employer in the community. In fact, the economic well-being of the community is tied very strongly to Beauville. Beauville operates a sawmill, a fabric plant, and a furniture plant in the same community.
The sawmill buys logs from independent producers. The sawmill then processes the logs into four grades of lumber: firsts and seconds, No. 1 common, No. 2 common, and No. 3 common. All costs incurred in the mill are common to the four grades of lumber. All four grades of lumber are used by the furniture plant. The mill transfers everything it produces to the furniture plant, and the grades are transferred at cost. Trucks are used to move the lumber from the mill to the furniture plant. Although no outside sales exist, the mill could sell to external customers, and the selling prices of the four grades are known.
The fabric plant is responsible for producing the fabric that is used by the furniture plant. To produce three totally different fabrics (identified by fabric ID codes FB60, FB70, and FB80, respectively), the plant has three separate production operations-one for each fabric. Thus, production of all three fabrics occurs at the same time in different locations in the plant. Each fabric's production operation has two processes: the weaving and pattern process and the coloring and bolting process. In the weaving and pattern process, yarn is used to create yards of fabric with different designs. In the next process, the fabric is dyed, cut into 25-yard sections, and wrapped around cardboard rods to form 25-yard bolts. The bolts are transported by forklift to the furniture plant's Receiving Department. All of the output of the fabric plant is used by the furniture plant (to produce the sofas and chairs). For accounting purposes, the fabric is transferred at cost to the furniture plant.
The furniture plant produces orders for customers on a special-order basis. The customers specify the quantity, style, fabric, lumber grade, and pattern. Typically, jobs are large (involving at least 500 units). The plant has two production departments: Cutting and Assembly. In the Cutting Department, the fabric and wooden frame components are sized and cut. Other components are purchased from external suppliers and are removed from stores as needed for assembly. After the fabric and wooden components are finished for the entire job, they are moved to the Assembly Department. The Assembly Department takes the individual components and assembles the sofas (or chairs).
Beauville Furniture has been in business for over two decades and has a good reputation. However, during the past five years, Beauville experienced eroding profits and declining sales. Bids were increasingly lost (even aggressive bids) on the more popular models. Yet, the company was winning bids on some of the more-difficult-to-produce items. Lance Hays, the owner and manager, was frustrated. He simply couldn't understand how some of his competitors could sell for such low prices. On a common sofa job involving 500 units, Beauville's bids were running $25 per unit, or $12,500 per job more than the winning bids (on average). Yet, on the more difficult items, Beauville's bids were running about $60 per unit less than the next closest bid. Gisela Berling, vice president of finance, was assigned the task of preparing a cost analysis of the company's product lines. Lance wanted to know if the company's costs were excessive. Perhaps the company was being wasteful, and it was simply costing more to produce furniture than it was costing its competitors.
Gisela prepared herself by reading recent literature on cost management and product costing and attending several conferences that explored the same issues. She then reviewed the costing procedures of the company's mill and two plants and did a preliminary assessment of their soundness. The production costs of the mill were common to all lumber grades and were assigned using the physical units method. Since the output and production costs were fairly uniform throughout the year, the mill used an actual costing system. Although Gisela had no difficulty with actual costing, she decided to explore the effects of using the sales-value-at-split-off method. Thus, cost and production data for the mill were gathered so that an analysis could be conducted. The two plants used normal costing systems. The fabric plant used process costing, and the furniture plant used job-order costing. Both plants used plantwide overhead rates based on direct labor hours. Based on her initial reviews, she concluded that the costing procedures for the fabric plant were satisfactory. Essentially, there was no evidence of product diversity. A statistical analysis revealed that about 90 percent of the variability in the plant's overhead cost could be explained by direct labor hours. Thus, the use of a plantwide overhead rate based on direct labor hours seemed justified. What did concern her, though, was the material waste that she observed in the plant. Maybe a standard cost system would be useful for increasing the overall cost efficiency of the plant. Consequently, as part of her report to Lance, she decided to include a description of the fabric plant's costing procedures-at least for one of the fabric types. She also decided to develop a standard cost sheet for the chosen fabric. The furniture plant, however, was a more difficult matter. Product diversity was present and could be causing some distortions in product costs. Furthermore, statistical analysis revealed that only about 40 percent of the variability in overhead cost was explained by the direct labor hours. She decided that additional analysis was needed so that a sound product costing method could be recommended. One possibility would be to increase the number of overhead rates. Thus, she decided to include departmental data so that the effect of moving to departmental rates could be assessed. Finally, she also wanted to explore the possibility of converting the sawmill and fabric plant into profit centers and changing the existing transfer pricing policy.
With the cooperation of the cost accounting manager for the mill and each plant's controller, she gathered the following data for last year:
Sawmill:
Joint manufacturing costs: $900,000
Fabric Plant:
Budgeted overhead: $1,200,000 (50% fixed)
Practical volume (direct labor hours): 120,000 hours
Actual overhead: $1,150,000 (50% fixed)
Actual hours worked:
Departmental data on Fabric FB70 (actual costs and actual outcomes):
*Unitsare measured in yards for the Weaving and Pattern Department and in bolts forthe Coloring and Bolting Department. Note: With the exception of the cardboard bolt rods, materials are added at the beginning of each process. The cost of the rods is relatively insignificant and is included in overhead.
Proposed standard cost sheet for Fabric FB70 (for the Coloring and Bolting Department only):
Furniture Plant:
Departmental data (budgeted):
After some discussion with the furniture plant controller, Gisela decided to use machine hours to calculate the overhead rate for the Cutting Department and direct labor hours for the Assembly Department rate (the Cutting Department was more automated than the Assembly Department). As part of her report, she wanted to compare the effects of plantwide rates and departmental rates on the cost of jobs. She wanted to know if overhead costing could be the source of the pricing problems the company was experiencing.
To assess the effect of the different overhead assignment procedures, Gisela decided to examine two prospective jobs. One job, Job A500, could produce 500 sofas, using a frequently requested style and Fabric FB70. Bids on this type of job were being lost more frequently to competitors. The second job, Job B75, would produce 75 specially designed recliners. This job involved a new design and was more difficult for the workers to build. It involved some special cutting requirements and an unfamiliar assembly. Recently, the company seemed to be winning more bids on jobs of this type. To compute the costs of the two jobs, Gisela assembled the following information on the two jobs:
Job A500:
Job B75:
Required
Calculate the plantwide overhead rate for the fabric plant.
From the case of Beauville Furniture Corporation the following calculations are made.
The plant wide overhead rate for the fabric plant is calculated as follows:
In order to calculate plant wide Overhead rate for the fabric plant, it is necessary to find out the overhead per labor hour.
 Hence, the overhead per labor hour is
 To get the plant wide overhead rate, the total direct costs and the total overhead costs are to be calculated.
Total direct costs are obtained by multiplying the direct labor hours with the overhead per labor hour.
That is, total direct costs is,
 Total overhead cost is, the total costs involved in weaving, pattern, coloring and bottling.
That is,
 Finally, to obtain the plant wide overhead rate, the total overhead costs are to be divided by the total
The plant wide overhead rate for the fabric plant is calculated as follows:
In order to calculate plant wide Overhead rate for the fabric plant, it is necessary to find out the overhead per labor hour.
Hence, the overhead per labor hour is To get the plant wide overhead rate, the total direct costs and the total overhead costs are to be calculated.Total direct costs are obtained by multiplying the direct labor hours with the overhead per labor hour.
That is, total direct costs is,
Total overhead cost is, the total costs involved in weaving, pattern, coloring and bottling.That is,
Finally, to obtain the plant wide overhead rate, the total overhead costs are to be divided by the total 4
Sabrina Hoffman is founder and CEO of Golden Care, Inc., which owns and operates several assisted- living facilities. The facilities are apartment-style buildings with 25 to 30 one- or two-bedroom apartments. While each apartment has its own complete kitchen, in every building Golden Care offers communal dining options and an on-site nurse who is available 24 hours a day. Residents can choose monthly meal options that include one or two meals per day in the dining room. Residents who require nursing services (e.g., blood pressure monitoring and injections) can receive those services from the nurse. However, Golden Care facilities are not nursing homes, all residents are ambulatory, and custodial care is not an option. In the five years it has been in operation, the company has expanded from one facility to five, located in southwestern cities. The income statement for last year follows.
Sabrina originally got into the business because she had trouble finding adequate facilities for her mother. The concept worked well, and income over the past five years had grown nicely at 20 percent per year. However, Sabrina sensed clouds on the horizon. She knew that the population was aging and that her current clients would be moving to more traditional forms of nursing care. As a result, Sabrina wanted to consider adding one or more nursing homes to Golden Care. These nursing homes would be staffed around the clock with RNs and LPNs. The residents would likely have more severe medical problems and would be confined to beds or wheelchairs. Sabrina knew that quality care of this type was needed. So, she contacted Peter Verdon, her marketing manager, and Bernadette Masters, her accountant, for a brainstorming session.
Peter : "Sabrina, I really like the concept. As you know, several of our facilities have faced seeing their long-term residents move out to local nursing homes. Not only are these homes of lower quality than what we could provide, but losing a resident is heartrending for the staff, as well as for the remaining residents. I like the idea of providing a transition from less care to more."
Bernadette : "I agree with you, Peter. But let's not forget the differences between assisted-living and full-time, nursing-home-type care. Our expenses will really increase."
Sabrina : "That's why I wanted to talk with both of you. As you know, Golden Care's mission statement emphasizes the need to make a profit. We can't continue to serve our residents and provide high- quality care if we don't make enough money to pay our staff a living wage and earn enough of a profit to smooth over the rough patches and continue to improve our business. Could the two of you look into this idea, and get back to me in a week or so?"
Throughout the following week, the three communicated by e-mail. By the end of the week, a number of possibilities had surfaced, and these were summarized in a message from Bernadette to the others.
TO: [email protected], [email protected]
FROM: [email protected]
MESSAGE:
I've compiled the ideas from all of our e-mails into the following list. This may be a good starting point for our meeting tomorrow.
1. Buy an existing nursing home in one of Golden Care's current locations.
2. Buy an existing nursing home in another city.
3. Build a new nursing home facility in one of Golden Care's current locations.
4. Build a new nursing home facility in another city.
5. Build a wing on to an existing Golden Care facility. The Apache Junction facility has sufficient open land for an addition.
The next day, Sabrina, Peter, and Bernadette met again in Sabrina's office.
Sabrina : "I didn't realize there were so many possibilities. Are we going to have to work up numbers on each of them?"
Bernadette : "No, I think we can eliminate a few of them pretty quickly. For example, building a new facility would cost more than the other options, and it would involve the most risk."
Peter : "I agree, and I also think we might eliminate the purchase of an existing nursing home for the same reasons. Also, existing homes would not give us the option of building a facility that is state of the art and meets our needs, and it would lock us into a preexisting patient mix."
Sabrina : "I like that thinking. Let's restrict our attention to Option 5."
Bernadette : "I thought you might like that option, so Peter and I sketched out two alternatives for an extension of the Apache Junction building. We call the alternatives Basic Care and Lifestyle Care."
Peter : "There are different markets for each type of care. If we want to concentrate on Medicare and Medicaid patients, the reimbursement is lower, and we would want to offer the Basic Care option. Private insurance and private-pay patients could afford more services; if we are marketing to these patients, we could offer the Lifestyle Care option. Both alternatives provide high-quality nursing care. Basic Care concentrates on the quality nursing and maintenance activities. For example, the addition would have 25 double rooms, two nursing stations, two recreation rooms, a treatment room, and an office. The Lifestyle Care option adds physical and recreational therapy with a specially equipped gym and pool. That addition would have 30 single rooms, two nursing stations, a recreation room, a swimming pool, a hydrotherapy spa and gym, a treatment room, and an office. In each case, there would be cable TV and telephone hookups in each room and a buffer area between the nursing home and the apartments."
Sabrina : "Why the buffer area? Won't that add unnecessary cost?"
Peter : "It adds cost, but it will be well worth it. Sabrina, you must remember that the nursing home patients are different from the apartment residents. Some of the patients will have advanced dementia. We'll lose apartment residents in a hurry if they have to be reminded every day of what might be in store for them later on."
Sabrina : "I see your point. Bernadette, what will these two plans cost? I'll tell you right now that I like the Lifestyle Care option better. It fits with our history of doing whatever we can to make life better for our residents."
Bernadette : "I've checked into the costs of putting on a new wing and operating both alternatives. Here's a listing."
"In both cases, total administrative costs for Golden Care would increase by $30,000 per year. This seems high, but the increased legal and insurance requirements will add significantly more paperwork and accounting."
Sabrina : "All this sounds reasonable, but why is reimbursement such an important factor?"
Peter : "Well, if you admit Medicaid patients, the state will reimburse at most $30,000 per year. Private insurance policies will pay roughly $46,000 per year. We can charge up to about $65,000 for private patients, but this type of care is so expensive that many of these patients exhaust their funds and go on Medicaid. The nice aspect of Medicaid is that we can be virtually assured that we will operate at capacity."
Sabrina : "Can we cross that bridge when we come to it?"
Peter : " No, not really. Once the patient is a resident of our facility, it is hard to evict him or her. Also, while it is legal to force patients out before they go on Medicaid and to refuse to accept Medicaid patients, once we do accept Medicaid patients, we are prevented by law from evicting them-no matter how high our costs go."
Sabrina : "OK, it looks as if we have some hard work ahead of us to decide whether or not to get into this line of business."
Required
How did Sabrina, Bernadette, and Peter use the tactical decision-making model of Chapter 17?
Unlock Deck
Unlock for access to all 33 flashcards in this deck.
Unlock Deck
k this deck
5
Beauville Furniture Corporation produces sofas, recliners, and lounge chairs. Beauville is located in a medium-sized community in the southeastern part of the United States. It is a major employer in the community. In fact, the economic well-being of the community is tied very strongly to Beauville. Beauville operates a sawmill, a fabric plant, and a furniture plant in the same community.
The sawmill buys logs from independent producers. The sawmill then processes the logs into four grades of lumber: firsts and seconds, No. 1 common, No. 2 common, and No. 3 common. All costs incurred in the mill are common to the four grades of lumber. All four grades of lumber are used by the furniture plant. The mill transfers everything it produces to the furniture plant, and the grades are transferred at cost. Trucks are used to move the lumber from the mill to the furniture plant. Although no outside sales exist, the mill could sell to external customers, and the selling prices of the four grades are known.
The fabric plant is responsible for producing the fabric that is used by the furniture plant. To produce three totally different fabrics (identified by fabric ID codes FB60, FB70, and FB80, respectively), the plant has three separate production operations-one for each fabric. Thus, production of all three fabrics occurs at the same time in different locations in the plant. Each fabric's production operation has two processes: the weaving and pattern process and the coloring and bolting process. In the weaving and pattern process, yarn is used to create yards of fabric with different designs. In the next process, the fabric is dyed, cut into 25-yard sections, and wrapped around cardboard rods to form 25-yard bolts. The bolts are transported by forklift to the furniture plant's Receiving Department. All of the output of the fabric plant is used by the furniture plant (to produce the sofas and chairs). For accounting purposes, the fabric is transferred at cost to the furniture plant.
The furniture plant produces orders for customers on a special-order basis. The customers specify the quantity, style, fabric, lumber grade, and pattern. Typically, jobs are large (involving at least 500 units). The plant has two production departments: Cutting and Assembly. In the Cutting Department, the fabric and wooden frame components are sized and cut. Other components are purchased from external suppliers and are removed from stores as needed for assembly. After the fabric and wooden components are finished for the entire job, they are moved to the Assembly Department. The Assembly Department takes the individual components and assembles the sofas (or chairs).
Beauville Furniture has been in business for over two decades and has a good reputation. However, during the past five years, Beauville experienced eroding profits and declining sales. Bids were increasingly lost (even aggressive bids) on the more popular models. Yet, the company was winning bids on some of the more-difficult-to-produce items. Lance Hays, the owner and manager, was frustrated. He simply couldn't understand how some of his competitors could sell for such low prices. On a common sofa job involving 500 units, Beauville's bids were running $25 per unit, or $12,500 per job more than the winning bids (on average). Yet, on the more difficult items, Beauville's bids were running about $60 per unit less than the next closest bid. Gisela Berling, vice president of finance, was assigned the task of preparing a cost analysis of the company's product lines. Lance wanted to know if the company's costs were excessive. Perhaps the company was being wasteful, and it was simply costing more to produce furniture than it was costing its competitors.
Gisela prepared herself by reading recent literature on cost management and product costing and attending several conferences that explored the same issues. She then reviewed the costing procedures of the company's mill and two plants and did a preliminary assessment of their soundness. The production costs of the mill were common to all lumber grades and were assigned using the physical units method. Since the output and production costs were fairly uniform throughout the year, the mill used an actual costing system. Although Gisela had no difficulty with actual costing, she decided to explore the effects of using the sales-value-at-split-off method. Thus, cost and production data for the mill were gathered so that an analysis could be conducted. The two plants used normal costing systems. The fabric plant used process costing, and the furniture plant used job-order costing. Both plants used plantwide overhead rates based on direct labor hours. Based on her initial reviews, she concluded that the costing procedures for the fabric plant were satisfactory. Essentially, there was no evidence of product diversity. A statistical analysis revealed that about 90 percent of the variability in the plant's overhead cost could be explained by direct labor hours. Thus, the use of a plantwide overhead rate based on direct labor hours seemed justified. What did concern her, though, was the material waste that she observed in the plant. Maybe a standard cost system would be useful for increasing the overall cost efficiency of the plant. Consequently, as part of her report to Lance, she decided to include a description of the fabric plant's costing procedures-at least for one of the fabric types. She also decided to develop a standard cost sheet for the chosen fabric. The furniture plant, however, was a more difficult matter. Product diversity was present and could be causing some distortions in product costs. Furthermore, statistical analysis revealed that only about 40 percent of the variability in overhead cost was explained by the direct labor hours. She decided that additional analysis was needed so that a sound product costing method could be recommended. One possibility would be to increase the number of overhead rates. Thus, she decided to include departmental data so that the effect of moving to departmental rates could be assessed. Finally, she also wanted to explore the possibility of converting the sawmill and fabric plant into profit centers and changing the existing transfer pricing policy.
With the cooperation of the cost accounting manager for the mill and each plant's controller, she gathered the following data for last year:
Sawmill:
Joint manufacturing costs: $900,000
Fabric Plant:
Budgeted overhead: $1,200,000 (50% fixed)
Practical volume (direct labor hours): 120,000 hours
Actual overhead: $1,150,000 (50% fixed)
Actual hours worked:
Departmental data on Fabric FB70 (actual costs and actual outcomes):
*Unitsare measured in yards for the Weaving and Pattern Department and in bolts forthe Coloring and Bolting Department. Note: With the exception of the cardboard bolt rods, materials are added at the beginning of each process. The cost of the rods is relatively insignificant and is included in overhead.
Proposed standard cost sheet for Fabric FB70 (for the Coloring and Bolting Department only):
Furniture Plant:
Departmental data (budgeted):
After some discussion with the furniture plant controller, Gisela decided to use machine hours to calculate the overhead rate for the Cutting Department and direct labor hours for the Assembly Department rate (the Cutting Department was more automated than the Assembly Department). As part of her report, she wanted to compare the effects of plantwide rates and departmental rates on the cost of jobs. She wanted to know if overhead costing could be the source of the pricing problems the company was experiencing.
To assess the effect of the different overhead assignment procedures, Gisela decided to examine two prospective jobs. One job, Job A500, could produce 500 sofas, using a frequently requested style and Fabric FB70. Bids on this type of job were being lost more frequently to competitors. The second job, Job B75, would produce 75 specially designed recliners. This job involved a new design and was more difficult for the workers to build. It involved some special cutting requirements and an unfamiliar assembly. Recently, the company seemed to be winning more bids on jobs of this type. To compute the costs of the two jobs, Gisela assembled the following information on the two jobs:
Job A500:
Job B75:
Required
Calculate the amount of under- or overapplied overhead for the fabric plant.
Unlock Deck
Unlock for access to all 33 flashcards in this deck.
Unlock Deck
k this deck
6
Sabrina Hoffman is founder and CEO of Golden Care, Inc., which owns and operates several assisted- living facilities. The facilities are apartment-style buildings with 25 to 30 one- or two-bedroom apartments. While each apartment has its own complete kitchen, in every building Golden Care offers communal dining options and an on-site nurse who is available 24 hours a day. Residents can choose monthly meal options that include one or two meals per day in the dining room. Residents who require nursing services (e.g., blood pressure monitoring and injections) can receive those services from the nurse. However, Golden Care facilities are not nursing homes, all residents are ambulatory, and custodial care is not an option. In the five years it has been in operation, the company has expanded from one facility to five, located in southwestern cities. The income statement for last year follows.
Sabrina originally got into the business because she had trouble finding adequate facilities for her mother. The concept worked well, and income over the past five years had grown nicely at 20 percent per year. However, Sabrina sensed clouds on the horizon. She knew that the population was aging and that her current clients would be moving to more traditional forms of nursing care. As a result, Sabrina wanted to consider adding one or more nursing homes to Golden Care. These nursing homes would be staffed around the clock with RNs and LPNs. The residents would likely have more severe medical problems and would be confined to beds or wheelchairs. Sabrina knew that quality care of this type was needed. So, she contacted Peter Verdon, her marketing manager, and Bernadette Masters, her accountant, for a brainstorming session.
Peter : "Sabrina, I really like the concept. As you know, several of our facilities have faced seeing their long-term residents move out to local nursing homes. Not only are these homes of lower quality than what we could provide, but losing a resident is heartrending for the staff, as well as for the remaining residents. I like the idea of providing a transition from less care to more."
Bernadette : "I agree with you, Peter. But let's not forget the differences between assisted-living and full-time, nursing-home-type care. Our expenses will really increase."
Sabrina : "That's why I wanted to talk with both of you. As you know, Golden Care's mission statement emphasizes the need to make a profit. We can't continue to serve our residents and provide high- quality care if we don't make enough money to pay our staff a living wage and earn enough of a profit to smooth over the rough patches and continue to improve our business. Could the two of you look into this idea, and get back to me in a week or so?"
Throughout the following week, the three communicated by e-mail. By the end of the week, a number of possibilities had surfaced, and these were summarized in a message from Bernadette to the others.
TO: [email protected], [email protected]
FROM: [email protected]
MESSAGE:
I've compiled the ideas from all of our e-mails into the following list. This may be a good starting point for our meeting tomorrow.
1. Buy an existing nursing home in one of Golden Care's current locations.
2. Buy an existing nursing home in another city.
3. Build a new nursing home facility in one of Golden Care's current locations.
4. Build a new nursing home facility in another city.
5. Build a wing on to an existing Golden Care facility. The Apache Junction facility has sufficient open land for an addition.
The next day, Sabrina, Peter, and Bernadette met again in Sabrina's office.
Sabrina : "I didn't realize there were so many possibilities. Are we going to have to work up numbers on each of them?"
Bernadette : "No, I think we can eliminate a few of them pretty quickly. For example, building a new facility would cost more than the other options, and it would involve the most risk."
Peter : "I agree, and I also think we might eliminate the purchase of an existing nursing home for the same reasons. Also, existing homes would not give us the option of building a facility that is state of the art and meets our needs, and it would lock us into a preexisting patient mix."
Sabrina : "I like that thinking. Let's restrict our attention to Option 5."
Bernadette : "I thought you might like that option, so Peter and I sketched out two alternatives for an extension of the Apache Junction building. We call the alternatives Basic Care and Lifestyle Care."
Peter : "There are different markets for each type of care. If we want to concentrate on Medicare and Medicaid patients, the reimbursement is lower, and we would want to offer the Basic Care option. Private insurance and private-pay patients could afford more services; if we are marketing to these patients, we could offer the Lifestyle Care option. Both alternatives provide high-quality nursing care. Basic Care concentrates on the quality nursing and maintenance activities. For example, the addition would have 25 double rooms, two nursing stations, two recreation rooms, a treatment room, and an office. The Lifestyle Care option adds physical and recreational therapy with a specially equipped gym and pool. That addition would have 30 single rooms, two nursing stations, a recreation room, a swimming pool, a hydrotherapy spa and gym, a treatment room, and an office. In each case, there would be cable TV and telephone hookups in each room and a buffer area between the nursing home and the apartments."
Sabrina : "Why the buffer area? Won't that add unnecessary cost?"
Peter : "It adds cost, but it will be well worth it. Sabrina, you must remember that the nursing home patients are different from the apartment residents. Some of the patients will have advanced dementia. We'll lose apartment residents in a hurry if they have to be reminded every day of what might be in store for them later on."
Sabrina : "I see your point. Bernadette, what will these two plans cost? I'll tell you right now that I like the Lifestyle Care option better. It fits with our history of doing whatever we can to make life better for our residents."
Bernadette : "I've checked into the costs of putting on a new wing and operating both alternatives. Here's a listing."
"In both cases, total administrative costs for Golden Care would increase by $30,000 per year. This seems high, but the increased legal and insurance requirements will add significantly more paperwork and accounting."
Sabrina : "All this sounds reasonable, but why is reimbursement such an important factor?"
Peter : "Well, if you admit Medicaid patients, the state will reimburse at most $30,000 per year. Private insurance policies will pay roughly $46,000 per year. We can charge up to about $65,000 for private patients, but this type of care is so expensive that many of these patients exhaust their funds and go on Medicaid. The nice aspect of Medicaid is that we can be virtually assured that we will operate at capacity."
Sabrina : "Can we cross that bridge when we come to it?"
Peter : " No, not really. Once the patient is a resident of our facility, it is hard to evict him or her. Also, while it is legal to force patients out before they go on Medicaid and to refuse to accept Medicaid patients, once we do accept Medicaid patients, we are prevented by law from evicting them-no matter how high our costs go."
Sabrina : "OK, it looks as if we have some hard work ahead of us to decide whether or not to get into this line of business."
Required
Categorize each of the expenses for the Basic Care and Lifestyle Care options as flexible or committed. Further categorize the committed expenses as committed fixed or committed step costs.
Unlock Deck
Unlock for access to all 33 flashcards in this deck.
Unlock Deck
k this deck
7
Beauville Furniture Corporation produces sofas, recliners, and lounge chairs. Beauville is located in a medium-sized community in the southeastern part of the United States. It is a major employer in the community. In fact, the economic well-being of the community is tied very strongly to Beauville. Beauville operates a sawmill, a fabric plant, and a furniture plant in the same community.
The sawmill buys logs from independent producers. The sawmill then processes the logs into four grades of lumber: firsts and seconds, No. 1 common, No. 2 common, and No. 3 common. All costs incurred in the mill are common to the four grades of lumber. All four grades of lumber are used by the furniture plant. The mill transfers everything it produces to the furniture plant, and the grades are transferred at cost. Trucks are used to move the lumber from the mill to the furniture plant. Although no outside sales exist, the mill could sell to external customers, and the selling prices of the four grades are known.
The fabric plant is responsible for producing the fabric that is used by the furniture plant. To produce three totally different fabrics (identified by fabric ID codes FB60, FB70, and FB80, respectively), the plant has three separate production operations-one for each fabric. Thus, production of all three fabrics occurs at the same time in different locations in the plant. Each fabric's production operation has two processes: the weaving and pattern process and the coloring and bolting process. In the weaving and pattern process, yarn is used to create yards of fabric with different designs. In the next process, the fabric is dyed, cut into 25-yard sections, and wrapped around cardboard rods to form 25-yard bolts. The bolts are transported by forklift to the furniture plant's Receiving Department. All of the output of the fabric plant is used by the furniture plant (to produce the sofas and chairs). For accounting purposes, the fabric is transferred at cost to the furniture plant.
The furniture plant produces orders for customers on a special-order basis. The customers specify the quantity, style, fabric, lumber grade, and pattern. Typically, jobs are large (involving at least 500 units). The plant has two production departments: Cutting and Assembly. In the Cutting Department, the fabric and wooden frame components are sized and cut. Other components are purchased from external suppliers and are removed from stores as needed for assembly. After the fabric and wooden components are finished for the entire job, they are moved to the Assembly Department. The Assembly Department takes the individual components and assembles the sofas (or chairs).
Beauville Furniture has been in business for over two decades and has a good reputation. However, during the past five years, Beauville experienced eroding profits and declining sales. Bids were increasingly lost (even aggressive bids) on the more popular models. Yet, the company was winning bids on some of the more-difficult-to-produce items. Lance Hays, the owner and manager, was frustrated. He simply couldn't understand how some of his competitors could sell for such low prices. On a common sofa job involving 500 units, Beauville's bids were running $25 per unit, or $12,500 per job more than the winning bids (on average). Yet, on the more difficult items, Beauville's bids were running about $60 per unit less than the next closest bid. Gisela Berling, vice president of finance, was assigned the task of preparing a cost analysis of the company's product lines. Lance wanted to know if the company's costs were excessive. Perhaps the company was being wasteful, and it was simply costing more to produce furniture than it was costing its competitors.
Gisela prepared herself by reading recent literature on cost management and product costing and attending several conferences that explored the same issues. She then reviewed the costing procedures of the company's mill and two plants and did a preliminary assessment of their soundness. The production costs of the mill were common to all lumber grades and were assigned using the physical units method. Since the output and production costs were fairly uniform throughout the year, the mill used an actual costing system. Although Gisela had no difficulty with actual costing, she decided to explore the effects of using the sales-value-at-split-off method. Thus, cost and production data for the mill were gathered so that an analysis could be conducted. The two plants used normal costing systems. The fabric plant used process costing, and the furniture plant used job-order costing. Both plants used plantwide overhead rates based on direct labor hours. Based on her initial reviews, she concluded that the costing procedures for the fabric plant were satisfactory. Essentially, there was no evidence of product diversity. A statistical analysis revealed that about 90 percent of the variability in the plant's overhead cost could be explained by direct labor hours. Thus, the use of a plantwide overhead rate based on direct labor hours seemed justified. What did concern her, though, was the material waste that she observed in the plant. Maybe a standard cost system would be useful for increasing the overall cost efficiency of the plant. Consequently, as part of her report to Lance, she decided to include a description of the fabric plant's costing procedures-at least for one of the fabric types. She also decided to develop a standard cost sheet for the chosen fabric. The furniture plant, however, was a more difficult matter. Product diversity was present and could be causing some distortions in product costs. Furthermore, statistical analysis revealed that only about 40 percent of the variability in overhead cost was explained by the direct labor hours. She decided that additional analysis was needed so that a sound product costing method could be recommended. One possibility would be to increase the number of overhead rates. Thus, she decided to include departmental data so that the effect of moving to departmental rates could be assessed. Finally, she also wanted to explore the possibility of converting the sawmill and fabric plant into profit centers and changing the existing transfer pricing policy.
With the cooperation of the cost accounting manager for the mill and each plant's controller, she gathered the following data for last year:
Sawmill:
Joint manufacturing costs: $900,000
Fabric Plant:
Budgeted overhead: $1,200,000 (50% fixed)
Practical volume (direct labor hours): 120,000 hours
Actual overhead: $1,150,000 (50% fixed)
Actual hours worked:
Departmental data on Fabric FB70 (actual costs and actual outcomes):
*Unitsare measured in yards for the Weaving and Pattern Department and in bolts forthe Coloring and Bolting Department. Note: With the exception of the cardboard bolt rods, materials are added at the beginning of each process. The cost of the rods is relatively insignificant and is included in overhead.
Proposed standard cost sheet for Fabric FB70 (for the Coloring and Bolting Department only):
Furniture Plant:
Departmental data (budgeted):
After some discussion with the furniture plant controller, Gisela decided to use machine hours to calculate the overhead rate for the Cutting Department and direct labor hours for the Assembly Department rate (the Cutting Department was more automated than the Assembly Department). As part of her report, she wanted to compare the effects of plantwide rates and departmental rates on the cost of jobs. She wanted to know if overhead costing could be the source of the pricing problems the company was experiencing.
To assess the effect of the different overhead assignment procedures, Gisela decided to examine two prospective jobs. One job, Job A500, could produce 500 sofas, using a frequently requested style and Fabric FB70. Bids on this type of job were being lost more frequently to competitors. The second job, Job B75, would produce 75 specially designed recliners. This job involved a new design and was more difficult for the workers to build. It involved some special cutting requirements and an unfamiliar assembly. Recently, the company seemed to be winning more bids on jobs of this type. To compute the costs of the two jobs, Gisela assembled the following information on the two jobs:
Job A500:
Job B75:
Required
Using the weighted average method, calculate the cost per bolt for Fabric FB70.
Unlock Deck
Unlock for access to all 33 flashcards in this deck.
Unlock Deck
k this deck
8
Sabrina Hoffman is founder and CEO of Golden Care, Inc., which owns and operates several assisted- living facilities. The facilities are apartment-style buildings with 25 to 30 one- or two-bedroom apartments. While each apartment has its own complete kitchen, in every building Golden Care offers communal dining options and an on-site nurse who is available 24 hours a day. Residents can choose monthly meal options that include one or two meals per day in the dining room. Residents who require nursing services (e.g., blood pressure monitoring and injections) can receive those services from the nurse. However, Golden Care facilities are not nursing homes, all residents are ambulatory, and custodial care is not an option. In the five years it has been in operation, the company has expanded from one facility to five, located in southwestern cities. The income statement for last year follows.
Sabrina originally got into the business because she had trouble finding adequate facilities for her mother. The concept worked well, and income over the past five years had grown nicely at 20 percent per year. However, Sabrina sensed clouds on the horizon. She knew that the population was aging and that her current clients would be moving to more traditional forms of nursing care. As a result, Sabrina wanted to consider adding one or more nursing homes to Golden Care. These nursing homes would be staffed around the clock with RNs and LPNs. The residents would likely have more severe medical problems and would be confined to beds or wheelchairs. Sabrina knew that quality care of this type was needed. So, she contacted Peter Verdon, her marketing manager, and Bernadette Masters, her accountant, for a brainstorming session.
Peter : "Sabrina, I really like the concept. As you know, several of our facilities have faced seeing their long-term residents move out to local nursing homes. Not only are these homes of lower quality than what we could provide, but losing a resident is heartrending for the staff, as well as for the remaining residents. I like the idea of providing a transition from less care to more."
Bernadette : "I agree with you, Peter. But let's not forget the differences between assisted-living and full-time, nursing-home-type care. Our expenses will really increase."
Sabrina : "That's why I wanted to talk with both of you. As you know, Golden Care's mission statement emphasizes the need to make a profit. We can't continue to serve our residents and provide high- quality care if we don't make enough money to pay our staff a living wage and earn enough of a profit to smooth over the rough patches and continue to improve our business. Could the two of you look into this idea, and get back to me in a week or so?"
Throughout the following week, the three communicated by e-mail. By the end of the week, a number of possibilities had surfaced, and these were summarized in a message from Bernadette to the others.
TO: [email protected], [email protected]
FROM: [email protected]
MESSAGE:
I've compiled the ideas from all of our e-mails into the following list. This may be a good starting point for our meeting tomorrow.
1. Buy an existing nursing home in one of Golden Care's current locations.
2. Buy an existing nursing home in another city.
3. Build a new nursing home facility in one of Golden Care's current locations.
4. Build a new nursing home facility in another city.
5. Build a wing on to an existing Golden Care facility. The Apache Junction facility has sufficient open land for an addition.
The next day, Sabrina, Peter, and Bernadette met again in Sabrina's office.
Sabrina : "I didn't realize there were so many possibilities. Are we going to have to work up numbers on each of them?"
Bernadette : "No, I think we can eliminate a few of them pretty quickly. For example, building a new facility would cost more than the other options, and it would involve the most risk."
Peter : "I agree, and I also think we might eliminate the purchase of an existing nursing home for the same reasons. Also, existing homes would not give us the option of building a facility that is state of the art and meets our needs, and it would lock us into a preexisting patient mix."
Sabrina : "I like that thinking. Let's restrict our attention to Option 5."
Bernadette : "I thought you might like that option, so Peter and I sketched out two alternatives for an extension of the Apache Junction building. We call the alternatives Basic Care and Lifestyle Care."
Peter : "There are different markets for each type of care. If we want to concentrate on Medicare and Medicaid patients, the reimbursement is lower, and we would want to offer the Basic Care option. Private insurance and private-pay patients could afford more services; if we are marketing to these patients, we could offer the Lifestyle Care option. Both alternatives provide high-quality nursing care. Basic Care concentrates on the quality nursing and maintenance activities. For example, the addition would have 25 double rooms, two nursing stations, two recreation rooms, a treatment room, and an office. The Lifestyle Care option adds physical and recreational therapy with a specially equipped gym and pool. That addition would have 30 single rooms, two nursing stations, a recreation room, a swimming pool, a hydrotherapy spa and gym, a treatment room, and an office. In each case, there would be cable TV and telephone hookups in each room and a buffer area between the nursing home and the apartments."
Sabrina : "Why the buffer area? Won't that add unnecessary cost?"
Peter : "It adds cost, but it will be well worth it. Sabrina, you must remember that the nursing home patients are different from the apartment residents. Some of the patients will have advanced dementia. We'll lose apartment residents in a hurry if they have to be reminded every day of what might be in store for them later on."
Sabrina : "I see your point. Bernadette, what will these two plans cost? I'll tell you right now that I like the Lifestyle Care option better. It fits with our history of doing whatever we can to make life better for our residents."
Bernadette : "I've checked into the costs of putting on a new wing and operating both alternatives. Here's a listing."
"In both cases, total administrative costs for Golden Care would increase by $30,000 per year. This seems high, but the increased legal and insurance requirements will add significantly more paperwork and accounting."
Sabrina : "All this sounds reasonable, but why is reimbursement such an important factor?"
Peter : "Well, if you admit Medicaid patients, the state will reimburse at most $30,000 per year. Private insurance policies will pay roughly $46,000 per year. We can charge up to about $65,000 for private patients, but this type of care is so expensive that many of these patients exhaust their funds and go on Medicaid. The nice aspect of Medicaid is that we can be virtually assured that we will operate at capacity."
Sabrina : "Can we cross that bridge when we come to it?"
Peter : " No, not really. Once the patient is a resident of our facility, it is hard to evict him or her. Also, while it is legal to force patients out before they go on Medicaid and to refuse to accept Medicaid patients, once we do accept Medicaid patients, we are prevented by law from evicting them-no matter how high our costs go."
Sabrina : "OK, it looks as if we have some hard work ahead of us to decide whether or not to get into this line of business."
Required
Calculate the break-even number of patients (in total and for each type of reimbursement) for each of the following scenarios:
a. Basic Care option, 20 percent private insurance, and 80 percent Medicaid
b. Basic Care option, no Medicaid
c. Lifestyle Care option, no Medicaid, 75 percent private insurance, and 25 percent private pay
d. Lifestyle Care option, all insurance reimbursement
Unlock Deck
Unlock for access to all 33 flashcards in this deck.
Unlock Deck
k this deck
9
Beauville Furniture Corporation produces sofas, recliners, and lounge chairs. Beauville is located in a medium-sized community in the southeastern part of the United States. It is a major employer in the community. In fact, the economic well-being of the community is tied very strongly to Beauville. Beauville operates a sawmill, a fabric plant, and a furniture plant in the same community.
The sawmill buys logs from independent producers. The sawmill then processes the logs into four grades of lumber: firsts and seconds, No. 1 common, No. 2 common, and No. 3 common. All costs incurred in the mill are common to the four grades of lumber. All four grades of lumber are used by the furniture plant. The mill transfers everything it produces to the furniture plant, and the grades are transferred at cost. Trucks are used to move the lumber from the mill to the furniture plant. Although no outside sales exist, the mill could sell to external customers, and the selling prices of the four grades are known.
The fabric plant is responsible for producing the fabric that is used by the furniture plant. To produce three totally different fabrics (identified by fabric ID codes FB60, FB70, and FB80, respectively), the plant has three separate production operations-one for each fabric. Thus, production of all three fabrics occurs at the same time in different locations in the plant. Each fabric's production operation has two processes: the weaving and pattern process and the coloring and bolting process. In the weaving and pattern process, yarn is used to create yards of fabric with different designs. In the next process, the fabric is dyed, cut into 25-yard sections, and wrapped around cardboard rods to form 25-yard bolts. The bolts are transported by forklift to the furniture plant's Receiving Department. All of the output of the fabric plant is used by the furniture plant (to produce the sofas and chairs). For accounting purposes, the fabric is transferred at cost to the furniture plant.
The furniture plant produces orders for customers on a special-order basis. The customers specify the quantity, style, fabric, lumber grade, and pattern. Typically, jobs are large (involving at least 500 units). The plant has two production departments: Cutting and Assembly. In the Cutting Department, the fabric and wooden frame components are sized and cut. Other components are purchased from external suppliers and are removed from stores as needed for assembly. After the fabric and wooden components are finished for the entire job, they are moved to the Assembly Department. The Assembly Department takes the individual components and assembles the sofas (or chairs).
Beauville Furniture has been in business for over two decades and has a good reputation. However, during the past five years, Beauville experienced eroding profits and declining sales. Bids were increasingly lost (even aggressive bids) on the more popular models. Yet, the company was winning bids on some of the more-difficult-to-produce items. Lance Hays, the owner and manager, was frustrated. He simply couldn't understand how some of his competitors could sell for such low prices. On a common sofa job involving 500 units, Beauville's bids were running $25 per unit, or $12,500 per job more than the winning bids (on average). Yet, on the more difficult items, Beauville's bids were running about $60 per unit less than the next closest bid. Gisela Berling, vice president of finance, was assigned the task of preparing a cost analysis of the company's product lines. Lance wanted to know if the company's costs were excessive. Perhaps the company was being wasteful, and it was simply costing more to produce furniture than it was costing its competitors.
Gisela prepared herself by reading recent literature on cost management and product costing and attending several conferences that explored the same issues. She then reviewed the costing procedures of the company's mill and two plants and did a preliminary assessment of their soundness. The production costs of the mill were common to all lumber grades and were assigned using the physical units method. Since the output and production costs were fairly uniform throughout the year, the mill used an actual costing system. Although Gisela had no difficulty with actual costing, she decided to explore the effects of using the sales-value-at-split-off method. Thus, cost and production data for the mill were gathered so that an analysis could be conducted. The two plants used normal costing systems. The fabric plant used process costing, and the furniture plant used job-order costing. Both plants used plantwide overhead rates based on direct labor hours. Based on her initial reviews, she concluded that the costing procedures for the fabric plant were satisfactory. Essentially, there was no evidence of product diversity. A statistical analysis revealed that about 90 percent of the variability in the plant's overhead cost could be explained by direct labor hours. Thus, the use of a plantwide overhead rate based on direct labor hours seemed justified. What did concern her, though, was the material waste that she observed in the plant. Maybe a standard cost system would be useful for increasing the overall cost efficiency of the plant. Consequently, as part of her report to Lance, she decided to include a description of the fabric plant's costing procedures-at least for one of the fabric types. She also decided to develop a standard cost sheet for the chosen fabric. The furniture plant, however, was a more difficult matter. Product diversity was present and could be causing some distortions in product costs. Furthermore, statistical analysis revealed that only about 40 percent of the variability in overhead cost was explained by the direct labor hours. She decided that additional analysis was needed so that a sound product costing method could be recommended. One possibility would be to increase the number of overhead rates. Thus, she decided to include departmental data so that the effect of moving to departmental rates could be assessed. Finally, she also wanted to explore the possibility of converting the sawmill and fabric plant into profit centers and changing the existing transfer pricing policy.
With the cooperation of the cost accounting manager for the mill and each plant's controller, she gathered the following data for last year:
Sawmill:
Joint manufacturing costs: $900,000
Fabric Plant:
Budgeted overhead: $1,200,000 (50% fixed)
Practical volume (direct labor hours): 120,000 hours
Actual overhead: $1,150,000 (50% fixed)
Actual hours worked:
Departmental data on Fabric FB70 (actual costs and actual outcomes):
*Unitsare measured in yards for the Weaving and Pattern Department and in bolts forthe Coloring and Bolting Department. Note: With the exception of the cardboard bolt rods, materials are added at the beginning of each process. The cost of the rods is relatively insignificant and is included in overhead.
Proposed standard cost sheet for Fabric FB70 (for the Coloring and Bolting Department only):
Furniture Plant:
Departmental data (budgeted):
After some discussion with the furniture plant controller, Gisela decided to use machine hours to calculate the overhead rate for the Cutting Department and direct labor hours for the Assembly Department rate (the Cutting Department was more automated than the Assembly Department). As part of her report, she wanted to compare the effects of plantwide rates and departmental rates on the cost of jobs. She wanted to know if overhead costing could be the source of the pricing problems the company was experiencing.
To assess the effect of the different overhead assignment procedures, Gisela decided to examine two prospective jobs. One job, Job A500, could produce 500 sofas, using a frequently requested style and Fabric FB70. Bids on this type of job were being lost more frequently to competitors. The second job, Job B75, would produce 75 specially designed recliners. This job involved a new design and was more difficult for the workers to build. It involved some special cutting requirements and an unfamiliar assembly. Recently, the company seemed to be winning more bids on jobs of this type. To compute the costs of the two jobs, Gisela assembled the following information on the two jobs:
Job A500:
Job B75:
Required
Assume that the weaving and pattern process is not a separate process for each fabric. Also, assume that the yarn used for each fabric differs significantly in cost. In this case, would process costing be appropriate for the weaving and pattern process? What costing approach would you recommend? Describe your approach in detail.
Unlock Deck
Unlock for access to all 33 flashcards in this deck.
Unlock Deck
k this deck
10
Sabrina Hoffman is founder and CEO of Golden Care, Inc., which owns and operates several assisted- living facilities. The facilities are apartment-style buildings with 25 to 30 one- or two-bedroom apartments. While each apartment has its own complete kitchen, in every building Golden Care offers communal dining options and an on-site nurse who is available 24 hours a day. Residents can choose monthly meal options that include one or two meals per day in the dining room. Residents who require nursing services (e.g., blood pressure monitoring and injections) can receive those services from the nurse. However, Golden Care facilities are not nursing homes, all residents are ambulatory, and custodial care is not an option. In the five years it has been in operation, the company has expanded from one facility to five, located in southwestern cities. The income statement for last year follows.
Sabrina originally got into the business because she had trouble finding adequate facilities for her mother. The concept worked well, and income over the past five years had grown nicely at 20 percent per year. However, Sabrina sensed clouds on the horizon. She knew that the population was aging and that her current clients would be moving to more traditional forms of nursing care. As a result, Sabrina wanted to consider adding one or more nursing homes to Golden Care. These nursing homes would be staffed around the clock with RNs and LPNs. The residents would likely have more severe medical problems and would be confined to beds or wheelchairs. Sabrina knew that quality care of this type was needed. So, she contacted Peter Verdon, her marketing manager, and Bernadette Masters, her accountant, for a brainstorming session.
Peter : "Sabrina, I really like the concept. As you know, several of our facilities have faced seeing their long-term residents move out to local nursing homes. Not only are these homes of lower quality than what we could provide, but losing a resident is heartrending for the staff, as well as for the remaining residents. I like the idea of providing a transition from less care to more."
Bernadette : "I agree with you, Peter. But let's not forget the differences between assisted-living and full-time, nursing-home-type care. Our expenses will really increase."
Sabrina : "That's why I wanted to talk with both of you. As you know, Golden Care's mission statement emphasizes the need to make a profit. We can't continue to serve our residents and provide high- quality care if we don't make enough money to pay our staff a living wage and earn enough of a profit to smooth over the rough patches and continue to improve our business. Could the two of you look into this idea, and get back to me in a week or so?"
Throughout the following week, the three communicated by e-mail. By the end of the week, a number of possibilities had surfaced, and these were summarized in a message from Bernadette to the others.
TO: [email protected], [email protected]
FROM: [email protected]
MESSAGE:
I've compiled the ideas from all of our e-mails into the following list. This may be a good starting point for our meeting tomorrow.
1. Buy an existing nursing home in one of Golden Care's current locations.
2. Buy an existing nursing home in another city.
3. Build a new nursing home facility in one of Golden Care's current locations.
4. Build a new nursing home facility in another city.
5. Build a wing on to an existing Golden Care facility. The Apache Junction facility has sufficient open land for an addition.
The next day, Sabrina, Peter, and Bernadette met again in Sabrina's office.
Sabrina : "I didn't realize there were so many possibilities. Are we going to have to work up numbers on each of them?"
Bernadette : "No, I think we can eliminate a few of them pretty quickly. For example, building a new facility would cost more than the other options, and it would involve the most risk."
Peter : "I agree, and I also think we might eliminate the purchase of an existing nursing home for the same reasons. Also, existing homes would not give us the option of building a facility that is state of the art and meets our needs, and it would lock us into a preexisting patient mix."
Sabrina : "I like that thinking. Let's restrict our attention to Option 5."
Bernadette : "I thought you might like that option, so Peter and I sketched out two alternatives for an extension of the Apache Junction building. We call the alternatives Basic Care and Lifestyle Care."
Peter : "There are different markets for each type of care. If we want to concentrate on Medicare and Medicaid patients, the reimbursement is lower, and we would want to offer the Basic Care option. Private insurance and private-pay patients could afford more services; if we are marketing to these patients, we could offer the Lifestyle Care option. Both alternatives provide high-quality nursing care. Basic Care concentrates on the quality nursing and maintenance activities. For example, the addition would have 25 double rooms, two nursing stations, two recreation rooms, a treatment room, and an office. The Lifestyle Care option adds physical and recreational therapy with a specially equipped gym and pool. That addition would have 30 single rooms, two nursing stations, a recreation room, a swimming pool, a hydrotherapy spa and gym, a treatment room, and an office. In each case, there would be cable TV and telephone hookups in each room and a buffer area between the nursing home and the apartments."
Sabrina : "Why the buffer area? Won't that add unnecessary cost?"
Peter : "It adds cost, but it will be well worth it. Sabrina, you must remember that the nursing home patients are different from the apartment residents. Some of the patients will have advanced dementia. We'll lose apartment residents in a hurry if they have to be reminded every day of what might be in store for them later on."
Sabrina : "I see your point. Bernadette, what will these two plans cost? I'll tell you right now that I like the Lifestyle Care option better. It fits with our history of doing whatever we can to make life better for our residents."
Bernadette : "I've checked into the costs of putting on a new wing and operating both alternatives. Here's a listing."
"In both cases, total administrative costs for Golden Care would increase by $30,000 per year. This seems high, but the increased legal and insurance requirements will add significantly more paperwork and accounting."
Sabrina : "All this sounds reasonable, but why is reimbursement such an important factor?"
Peter : "Well, if you admit Medicaid patients, the state will reimburse at most $30,000 per year. Private insurance policies will pay roughly $46,000 per year. We can charge up to about $65,000 for private patients, but this type of care is so expensive that many of these patients exhaust their funds and go on Medicaid. The nice aspect of Medicaid is that we can be virtually assured that we will operate at capacity."
Sabrina : "Can we cross that bridge when we come to it?"
Peter : " No, not really. Once the patient is a resident of our facility, it is hard to evict him or her. Also, while it is legal to force patients out before they go on Medicaid and to refuse to accept Medicaid patients, once we do accept Medicaid patients, we are prevented by law from evicting them-no matter how high our costs go."
Sabrina : "OK, it looks as if we have some hard work ahead of us to decide whether or not to get into this line of business."
Required
What is the markup percent of cost of services charged on the assisted-living expenses? What would the price per month for a Basic Care patient be if the same markup were used? For a Lifestyle Care patient? (Assume in both cases that occupancy is at 80 percent of capacity.)
Unlock Deck
Unlock for access to all 33 flashcards in this deck.
Unlock Deck
k this deck
11
CableTech Bell Corporation (CTB) operates in the telecommunications industry. CTB has two divisions: the Phone Division and the Cable Service Division. The Phone Division manufactures telephones in several plants located in the Midwest. The product lines run from relatively inexpensive touch-tone wall and desk phones to expensive, high-quality cellular phones. CTB also operates a cable TV service in Ohio. The Cable Service Division offers three products: a basic package with 25 channels; an enhanced package, which is the basic package plus 15 additional channels and two movie channels; and a premium package, which is the basic package plus 25 additional channels and three movie channels.
The Cable Service Division reported the following activity for the month of March:
The unit costs are divided as follows: 70 percent production and 30 percent marketing and customer service. Direct labor cost is the only driver used for tracing. Typically, the division uses only production costs to define unit costs. The preceding unit product cost information was provided at the request of the marketing manager and was the result of a special study.
Bryce Youngers, the president of CTB, is reasonably satisfied with the performance of the Cable Service Division. March's performance is fairly typical of what has been happening over the past two years. The Phone Division, however, is another matter. Its overall profit performance has been declining. Two years ago, income before income taxes had been about 25 percent of sales. March's dismal performance was also typical for what has been happening this year and is expected to continue-unless some action by management is taken to reverse the trend. During March, the Phone Division reported the following results:
During March, the Phone Division purchased materials totaling $312,000. There are no significant inventories of supplies (beginning or ending). Supplies are accounted for separately from materials. CTB's Phone Division had sales totaling $1,170,000 for March.
Based on March's results, Bryce decided to meet with three of the Phone Division's managers: Kim Breashears, divisional manager; Jacob Carder, divisional controller; and Larry Hartley, sales manager. A transcript of their recorded conversation is given next:
Bryce: "March's profit performance is down once again, and I think we need to see if we can identify the problem and correct it-before it's too late. Kim, what's your assessment of the situation?"
Kim: "Foreign competition is eating us alive. They are coming in with lower-priced phones of comparable or higher quality than our own. I've talked with several of the retailers that carry our lines, and they say the same. They are convinced that we can sell more if we lower our prices."
Larry: "They're right. If we could lower our prices by 10 to 15 percent, I think that we'd regain most ofour lost market share. But we also need to make sure that the quality of our products meets that of our competitors. As you know, we are spending a lot of money each month on rework and warranties. That worries me. I'd like to see that warranty cost cut by 70 to 80 percent. If we could do that, then customers would be more satisfied with our products, and I bet that we would not only regain our market share but increase it."
Jacob: "Lowering prices without lowering per-unit costs will not help us increase our profitability.
I think we need to improve our cost accounting system. I am not confident that we really know how much each of our product lines is costing us. It may be that we are overpricing some of our units because we are overcosting them. We may be underpricing other units."
Larry: "This sounds promising-especially if the overcosting is for some of our high-volume lines. A price decrease for these products would make the biggest difference-and if we knew they were overcosted, then we could offer immediate price reductions."
Bryce: "Jacob, I need more explanation. We have been using the same cost accounting system for the last 10 years. Why would it be a problem?"
Jacob: "I think that our manufacturing environment has changed. Over the years, we have added a lot of different product lines. Some of these products make very different demands on our manufacturing overhead resources. We trace-or attempt to trace-overhead costs to the different products using direct labor cost, a unit-based cost driver. We may be doing more allocation than tracing. If so, then we probably don't have a very good idea of our actual product costs. Also, as you know, with the way computer technology has changed over time, it is easier and cheaper to collect and use detailed information-information that will allow us to assign costs more accurately."
Bryce: "This may be something we should explore. Jacob, what do you suggest?"
Jacob: "If we want more accurate product costs and if we really want to get in the cost reduction business, then we need to understand how costs behave. In particular, we need to understand activity cost behavior. Knowing what activities we perform, why we perform them, and how well we perform them will help us identify areas for improvement. We also need to know how the different products consume activity resources. What this boils down to is the need to use an activity-based management system. But before we jump into this, we need some idea of whether non-unit-based drivers add anything. Activity-based management is not an inexpensive undertaking. So I suggest that we do a preliminary study to see if direct labor cost is adequate for tracing. If not, then maybe some non-unit-drivers might be needed. In fact, if you would like,
I can gather some data that will provide some evidence on the usefulness of the activity-based approach."
Bryce: "What do you think, Kim? It's your division."
Kim: "What Jacob has said sounds promising. I think he should pursue it and do so quickly. I also think that we need to look at improving our quality. It sounds like we have a problem there. If quality could be improved, then our costs will drop. I'll talk to our quality people. Jacob, in the meantime, find out for us if moving to an activity-based system is the way to go. How much time do you need?"
Jacob: "I have already been gathering data. I could probably have a report within two weeks."
Based on my initial analysis, I am confident that an ABC system will offer significant improvement. For one of our conventional phone plants, I regressed total monthly overhead cost on monthly direct labor cost using the following 15 months of data:
The results were revealing. Although direct labor cost appears to be a driver of overhead cost, it really doesn't explain a lot of the variation. I then searched for other drivers-particularly non-unit drivers-that might offer more insight into overhead cost behavior. Every time a batch is produced, material movement occurs, regardless of the size of the batch. The number of moves seemed like a more logical driver. I was able to gather only 10 months of data for this. (Our information system doesn't provide the number of moves, so I had to build the data set by interviewing production personnel.) This information is provided next:
The regression results were impressive. There is no question in my mind that the number of moves is a good driver of materials-handling costs. Using the number of moves to assign materials-handling costs to products would likely be better than the cost assignment using direct labor cost. Furthermore, since small batches use the same number of moves as large batches, we have some evidence that we may be overcosting our high-volume products.
I looked at one more overhead activity: inspecting products. We have 15 inspectors who are paid an average of $4,000 per month. Each inspector offers about 160 hours of inspection capacity per month. However, it appears that they actually work only about 80 percent of those hours. The drop in demand we have experienced explains this idle time. I see no evidence of variable cost behavior here. I'm not exactly sure how to treat inspection cost, but I think that it is more related to inspection hours than direct labor cost. Some of the other overhead activities seem to be non-unit-level, as well-enough, in fact, to be concerned about how we assign costs.
After receiving the memo, Kim was intrigued. She then asked Jacob to use the same phone plant as a pilot for a preliminary ABC analysis. She instructed him to assign all overhead costs to the plant's two products (Regular and Deluxe models), using only four activities. The four activities were rework, moving materials, inspecting products, and a general catch-all activity labeled "other manufacturing activities." From the special study already performed, she knew that materials handling and inspecting involved significant cost; from production reports, she also knew that the rework activity involved significant cost. If the ABC and unit-based cost assignments did not differ by breaking out these three major activities, then ABC may not matter.
Pursuant to the request, Jacob produced the following cost and driver information:
Expected activity demands:
Required
Compute two different unit costs for each of the Cable Service Division's products. What managerial objectives are being served by these unit cost computations?
Unlock Deck
Unlock for access to all 33 flashcards in this deck.
Unlock Deck
k this deck
12
Beauville Furniture Corporation produces sofas, recliners, and lounge chairs. Beauville is located in a medium-sized community in the southeastern part of the United States. It is a major employer in the community. In fact, the economic well-being of the community is tied very strongly to Beauville. Beauville operates a sawmill, a fabric plant, and a furniture plant in the same community.
The sawmill buys logs from independent producers. The sawmill then processes the logs into four grades of lumber: firsts and seconds, No. 1 common, No. 2 common, and No. 3 common. All costs incurred in the mill are common to the four grades of lumber. All four grades of lumber are used by the furniture plant. The mill transfers everything it produces to the furniture plant, and the grades are transferred at cost. Trucks are used to move the lumber from the mill to the furniture plant. Although no outside sales exist, the mill could sell to external customers, and the selling prices of the four grades are known.
The fabric plant is responsible for producing the fabric that is used by the furniture plant. To produce three totally different fabrics (identified by fabric ID codes FB60, FB70, and FB80, respectively), the plant has three separate production operations-one for each fabric. Thus, production of all three fabrics occurs at the same time in different locations in the plant. Each fabric's production operation has two processes: the weaving and pattern process and the coloring and bolting process. In the weaving and pattern process, yarn is used to create yards of fabric with different designs. In the next process, the fabric is dyed, cut into 25-yard sections, and wrapped around cardboard rods to form 25-yard bolts. The bolts are transported by forklift to the furniture plant's Receiving Department. All of the output of the fabric plant is used by the furniture plant (to produce the sofas and chairs). For accounting purposes, the fabric is transferred at cost to the furniture plant.
The furniture plant produces orders for customers on a special-order basis. The customers specify the quantity, style, fabric, lumber grade, and pattern. Typically, jobs are large (involving at least 500 units). The plant has two production departments: Cutting and Assembly. In the Cutting Department, the fabric and wooden frame components are sized and cut. Other components are purchased from external suppliers and are removed from stores as needed for assembly. After the fabric and wooden components are finished for the entire job, they are moved to the Assembly Department. The Assembly Department takes the individual components and assembles the sofas (or chairs).
Beauville Furniture has been in business for over two decades and has a good reputation. However, during the past five years, Beauville experienced eroding profits and declining sales. Bids were increasingly lost (even aggressive bids) on the more popular models. Yet, the company was winning bids on some of the more-difficult-to-produce items. Lance Hays, the owner and manager, was frustrated. He simply couldn't understand how some of his competitors could sell for such low prices. On a common sofa job involving 500 units, Beauville's bids were running $25 per unit, or $12,500 per job more than the winning bids (on average). Yet, on the more difficult items, Beauville's bids were running about $60 per unit less than the next closest bid. Gisela Berling, vice president of finance, was assigned the task of preparing a cost analysis of the company's product lines. Lance wanted to know if the company's costs were excessive. Perhaps the company was being wasteful, and it was simply costing more to produce furniture than it was costing its competitors.
Gisela prepared herself by reading recent literature on cost management and product costing and attending several conferences that explored the same issues. She then reviewed the costing procedures of the company's mill and two plants and did a preliminary assessment of their soundness. The production costs of the mill were common to all lumber grades and were assigned using the physical units method. Since the output and production costs were fairly uniform throughout the year, the mill used an actual costing system. Although Gisela had no difficulty with actual costing, she decided to explore the effects of using the sales-value-at-split-off method. Thus, cost and production data for the mill were gathered so that an analysis could be conducted. The two plants used normal costing systems. The fabric plant used process costing, and the furniture plant used job-order costing. Both plants used plantwide overhead rates based on direct labor hours. Based on her initial reviews, she concluded that the costing procedures for the fabric plant were satisfactory. Essentially, there was no evidence of product diversity. A statistical analysis revealed that about 90 percent of the variability in the plant's overhead cost could be explained by direct labor hours. Thus, the use of a plantwide overhead rate based on direct labor hours seemed justified. What did concern her, though, was the material waste that she observed in the plant. Maybe a standard cost system would be useful for increasing the overall cost efficiency of the plant. Consequently, as part of her report to Lance, she decided to include a description of the fabric plant's costing procedures-at least for one of the fabric types. She also decided to develop a standard cost sheet for the chosen fabric. The furniture plant, however, was a more difficult matter. Product diversity was present and could be causing some distortions in product costs. Furthermore, statistical analysis revealed that only about 40 percent of the variability in overhead cost was explained by the direct labor hours. She decided that additional analysis was needed so that a sound product costing method could be recommended. One possibility would be to increase the number of overhead rates. Thus, she decided to include departmental data so that the effect of moving to departmental rates could be assessed. Finally, she also wanted to explore the possibility of converting the sawmill and fabric plant into profit centers and changing the existing transfer pricing policy.
With the cooperation of the cost accounting manager for the mill and each plant's controller, she gathered the following data for last year:
Sawmill:
Joint manufacturing costs: $900,000
Fabric Plant:
Budgeted overhead: $1,200,000 (50% fixed)
Practical volume (direct labor hours): 120,000 hours
Actual overhead: $1,150,000 (50% fixed)
Actual hours worked:
Departmental data on Fabric FB70 (actual costs and actual outcomes):
*Unitsare measured in yards for the Weaving and Pattern Department and in bolts forthe Coloring and Bolting Department. Note: With the exception of the cardboard bolt rods, materials are added at the beginning of each process. The cost of the rods is relatively insignificant and is included in overhead.
Proposed standard cost sheet for Fabric FB70 (for the Coloring and Bolting Department only):
Furniture Plant:
Departmental data (budgeted):
After some discussion with the furniture plant controller, Gisela decided to use machine hours to calculate the overhead rate for the Cutting Department and direct labor hours for the Assembly Department rate (the Cutting Department was more automated than the Assembly Department). As part of her report, she wanted to compare the effects of plantwide rates and departmental rates on the cost of jobs. She wanted to know if overhead costing could be the source of the pricing problems the company was experiencing.
To assess the effect of the different overhead assignment procedures, Gisela decided to examine two prospective jobs. One job, Job A500, could produce 500 sofas, using a frequently requested style and Fabric FB70. Bids on this type of job were being lost more frequently to competitors. The second job, Job B75, would produce 75 specially designed recliners. This job involved a new design and was more difficult for the workers to build. It involved some special cutting requirements and an unfamiliar assembly. Recently, the company seemed to be winning more bids on jobs of this type. To compute the costs of the two jobs, Gisela assembled the following information on the two jobs:
Job A500:
Job B75:
Required
In the Coloring and Bolting Department, 400,000 ounces of other materials were used to produce the output of the period. Using the proposed standard cost sheet, calculate the following variances for the Coloring and Bolting Department:
a. Materials price variance (for other materials only)
b. Materials usage variance (for other materials only)
c. Labor rate variance
d. Labor efficiency variance
In calculating the variances, which method did you use to compute the actual output of the period-FIFO or weighted average? Explain.
Unlock Deck
Unlock for access to all 33 flashcards in this deck.
Unlock Deck
k this deck
13
Sabrina Hoffman is founder and CEO of Golden Care, Inc., which owns and operates several assisted- living facilities. The facilities are apartment-style buildings with 25 to 30 one- or two-bedroom apartments. While each apartment has its own complete kitchen, in every building Golden Care offers communal dining options and an on-site nurse who is available 24 hours a day. Residents can choose monthly meal options that include one or two meals per day in the dining room. Residents who require nursing services (e.g., blood pressure monitoring and injections) can receive those services from the nurse. However, Golden Care facilities are not nursing homes, all residents are ambulatory, and custodial care is not an option. In the five years it has been in operation, the company has expanded from one facility to five, located in southwestern cities. The income statement for last year follows.
Sabrina originally got into the business because she had trouble finding adequate facilities for her mother. The concept worked well, and income over the past five years had grown nicely at 20 percent per year. However, Sabrina sensed clouds on the horizon. She knew that the population was aging and that her current clients would be moving to more traditional forms of nursing care. As a result, Sabrina wanted to consider adding one or more nursing homes to Golden Care. These nursing homes would be staffed around the clock with RNs and LPNs. The residents would likely have more severe medical problems and would be confined to beds or wheelchairs. Sabrina knew that quality care of this type was needed. So, she contacted Peter Verdon, her marketing manager, and Bernadette Masters, her accountant, for a brainstorming session.
Peter : "Sabrina, I really like the concept. As you know, several of our facilities have faced seeing their long-term residents move out to local nursing homes. Not only are these homes of lower quality than what we could provide, but losing a resident is heartrending for the staff, as well as for the remaining residents. I like the idea of providing a transition from less care to more."
Bernadette : "I agree with you, Peter. But let's not forget the differences between assisted-living and full-time, nursing-home-type care. Our expenses will really increase."
Sabrina : "That's why I wanted to talk with both of you. As you know, Golden Care's mission statement emphasizes the need to make a profit. We can't continue to serve our residents and provide high- quality care if we don't make enough money to pay our staff a living wage and earn enough of a profit to smooth over the rough patches and continue to improve our business. Could the two of you look into this idea, and get back to me in a week or so?"
Throughout the following week, the three communicated by e-mail. By the end of the week, a number of possibilities had surfaced, and these were summarized in a message from Bernadette to the others.
TO: [email protected], [email protected]
FROM: [email protected]
MESSAGE:
I've compiled the ideas from all of our e-mails into the following list. This may be a good starting point for our meeting tomorrow.
1. Buy an existing nursing home in one of Golden Care's current locations.
2. Buy an existing nursing home in another city.
3. Build a new nursing home facility in one of Golden Care's current locations.
4. Build a new nursing home facility in another city.
5. Build a wing on to an existing Golden Care facility. The Apache Junction facility has sufficient open land for an addition.
The next day, Sabrina, Peter, and Bernadette met again in Sabrina's office.
Sabrina : "I didn't realize there were so many possibilities. Are we going to have to work up numbers on each of them?"
Bernadette : "No, I think we can eliminate a few of them pretty quickly. For example, building a new facility would cost more than the other options, and it would involve the most risk."
Peter : "I agree, and I also think we might eliminate the purchase of an existing nursing home for the same reasons. Also, existing homes would not give us the option of building a facility that is state of the art and meets our needs, and it would lock us into a preexisting patient mix."
Sabrina : "I like that thinking. Let's restrict our attention to Option 5."
Bernadette : "I thought you might like that option, so Peter and I sketched out two alternatives for an extension of the Apache Junction building. We call the alternatives Basic Care and Lifestyle Care."
Peter : "There are different markets for each type of care. If we want to concentrate on Medicare and Medicaid patients, the reimbursement is lower, and we would want to offer the Basic Care option. Private insurance and private-pay patients could afford more services; if we are marketing to these patients, we could offer the Lifestyle Care option. Both alternatives provide high-quality nursing care. Basic Care concentrates on the quality nursing and maintenance activities. For example, the addition would have 25 double rooms, two nursing stations, two recreation rooms, a treatment room, and an office. The Lifestyle Care option adds physical and recreational therapy with a specially equipped gym and pool. That addition would have 30 single rooms, two nursing stations, a recreation room, a swimming pool, a hydrotherapy spa and gym, a treatment room, and an office. In each case, there would be cable TV and telephone hookups in each room and a buffer area between the nursing home and the apartments."
Sabrina : "Why the buffer area? Won't that add unnecessary cost?"
Peter : "It adds cost, but it will be well worth it. Sabrina, you must remember that the nursing home patients are different from the apartment residents. Some of the patients will have advanced dementia. We'll lose apartment residents in a hurry if they have to be reminded every day of what might be in store for them later on."
Sabrina : "I see your point. Bernadette, what will these two plans cost? I'll tell you right now that I like the Lifestyle Care option better. It fits with our history of doing whatever we can to make life better for our residents."
Bernadette : "I've checked into the costs of putting on a new wing and operating both alternatives. Here's a listing."
"In both cases, total administrative costs for Golden Care would increase by $30,000 per year. This seems high, but the increased legal and insurance requirements will add significantly more paperwork and accounting."
Sabrina : "All this sounds reasonable, but why is reimbursement such an important factor?"
Peter : "Well, if you admit Medicaid patients, the state will reimburse at most $30,000 per year. Private insurance policies will pay roughly $46,000 per year. We can charge up to about $65,000 for private patients, but this type of care is so expensive that many of these patients exhaust their funds and go on Medicaid. The nice aspect of Medicaid is that we can be virtually assured that we will operate at capacity."
Sabrina : "Can we cross that bridge when we come to it?"
Peter : " No, not really. Once the patient is a resident of our facility, it is hard to evict him or her. Also, while it is legal to force patients out before they go on Medicaid and to refuse to accept Medicaid patients, once we do accept Medicaid patients, we are prevented by law from evicting them-no matter how high our costs go."
Sabrina : "OK, it looks as if we have some hard work ahead of us to decide whether or not to get into this line of business."
Required
What is the payback period for the new addition?
Unlock Deck
Unlock for access to all 33 flashcards in this deck.
Unlock Deck
k this deck
14
CableTech Bell Corporation (CTB) operates in the telecommunications industry. CTB has two divisions: the Phone Division and the Cable Service Division. The Phone Division manufactures telephones in several plants located in the Midwest. The product lines run from relatively inexpensive touch-tone wall and desk phones to expensive, high-quality cellular phones. CTB also operates a cable TV service in Ohio. The Cable Service Division offers three products: a basic package with 25 channels; an enhanced package, which is the basic package plus 15 additional channels and two movie channels; and a premium package, which is the basic package plus 25 additional channels and three movie channels.
The Cable Service Division reported the following activity for the month of March:
The unit costs are divided as follows: 70 percent production and 30 percent marketing and customer service. Direct labor cost is the only driver used for tracing. Typically, the division uses only production costs to define unit costs. The preceding unit product cost information was provided at the request of the marketing manager and was the result of a special study.
Bryce Youngers, the president of CTB, is reasonably satisfied with the performance of the Cable Service Division. March's performance is fairly typical of what has been happening over the past two years. The Phone Division, however, is another matter. Its overall profit performance has been declining. Two years ago, income before income taxes had been about 25 percent of sales. March's dismal performance was also typical for what has been happening this year and is expected to continue-unless some action by management is taken to reverse the trend. During March, the Phone Division reported the following results:
During March, the Phone Division purchased materials totaling $312,000. There are no significant inventories of supplies (beginning or ending). Supplies are accounted for separately from materials. CTB's Phone Division had sales totaling $1,170,000 for March.
Based on March's results, Bryce decided to meet with three of the Phone Division's managers: Kim Breashears, divisional manager; Jacob Carder, divisional controller; and Larry Hartley, sales manager. A transcript of their recorded conversation is given next:
Bryce: "March's profit performance is down once again, and I think we need to see if we can identify the problem and correct it-before it's too late. Kim, what's your assessment of the situation?"
Kim: "Foreign competition is eating us alive. They are coming in with lower-priced phones of comparable or higher quality than our own. I've talked with several of the retailers that carry our lines, and they say the same. They are convinced that we can sell more if we lower our prices."
Larry: "They're right. If we could lower our prices by 10 to 15 percent, I think that we'd regain most ofour lost market share. But we also need to make sure that the quality of our products meets that of our competitors. As you know, we are spending a lot of money each month on rework and warranties. That worries me. I'd like to see that warranty cost cut by 70 to 80 percent. If we could do that, then customers would be more satisfied with our products, and I bet that we would not only regain our market share but increase it."
Jacob: "Lowering prices without lowering per-unit costs will not help us increase our profitability.
I think we need to improve our cost accounting system. I am not confident that we really know how much each of our product lines is costing us. It may be that we are overpricing some of our units because we are overcosting them. We may be underpricing other units."
Larry: "This sounds promising-especially if the overcosting is for some of our high-volume lines. A price decrease for these products would make the biggest difference-and if we knew they were overcosted, then we could offer immediate price reductions."
Bryce: "Jacob, I need more explanation. We have been using the same cost accounting system for the last 10 years. Why would it be a problem?"
Jacob: "I think that our manufacturing environment has changed. Over the years, we have added a lot of different product lines. Some of these products make very different demands on our manufacturing overhead resources. We trace-or attempt to trace-overhead costs to the different products using direct labor cost, a unit-based cost driver. We may be doing more allocation than tracing. If so, then we probably don't have a very good idea of our actual product costs. Also, as you know, with the way computer technology has changed over time, it is easier and cheaper to collect and use detailed information-information that will allow us to assign costs more accurately."
Bryce: "This may be something we should explore. Jacob, what do you suggest?"
Jacob: "If we want more accurate product costs and if we really want to get in the cost reduction business, then we need to understand how costs behave. In particular, we need to understand activity cost behavior. Knowing what activities we perform, why we perform them, and how well we perform them will help us identify areas for improvement. We also need to know how the different products consume activity resources. What this boils down to is the need to use an activity-based management system. But before we jump into this, we need some idea of whether non-unit-based drivers add anything. Activity-based management is not an inexpensive undertaking. So I suggest that we do a preliminary study to see if direct labor cost is adequate for tracing. If not, then maybe some non-unit-drivers might be needed. In fact, if you would like,
I can gather some data that will provide some evidence on the usefulness of the activity-based approach."
Bryce: "What do you think, Kim? It's your division."
Kim: "What Jacob has said sounds promising. I think he should pursue it and do so quickly. I also think that we need to look at improving our quality. It sounds like we have a problem there. If quality could be improved, then our costs will drop. I'll talk to our quality people. Jacob, in the meantime, find out for us if moving to an activity-based system is the way to go. How much time do you need?"
Jacob: "I have already been gathering data. I could probably have a report within two weeks."
Based on my initial analysis, I am confident that an ABC system will offer significant improvement. For one of our conventional phone plants, I regressed total monthly overhead cost on monthly direct labor cost using the following 15 months of data:
The results were revealing. Although direct labor cost appears to be a driver of overhead cost, it really doesn't explain a lot of the variation. I then searched for other drivers-particularly non-unit drivers-that might offer more insight into overhead cost behavior. Every time a batch is produced, material movement occurs, regardless of the size of the batch. The number of moves seemed like a more logical driver. I was able to gather only 10 months of data for this. (Our information system doesn't provide the number of moves, so I had to build the data set by interviewing production personnel.) This information is provided next:
The regression results were impressive. There is no question in my mind that the number of moves is a good driver of materials-handling costs. Using the number of moves to assign materials-handling costs to products would likely be better than the cost assignment using direct labor cost. Furthermore, since small batches use the same number of moves as large batches, we have some evidence that we may be overcosting our high-volume products.
I looked at one more overhead activity: inspecting products. We have 15 inspectors who are paid an average of $4,000 per month. Each inspector offers about 160 hours of inspection capacity per month. However, it appears that they actually work only about 80 percent of those hours. The drop in demand we have experienced explains this idle time. I see no evidence of variable cost behavior here. I'm not exactly sure how to treat inspection cost, but I think that it is more related to inspection hours than direct labor cost. Some of the other overhead activities seem to be non-unit-level, as well-enough, in fact, to be concerned about how we assign costs.
After receiving the memo, Kim was intrigued. She then asked Jacob to use the same phone plant as a pilot for a preliminary ABC analysis. She instructed him to assign all overhead costs to the plant's two products (Regular and Deluxe models), using only four activities. The four activities were rework, moving materials, inspecting products, and a general catch-all activity labeled "other manufacturing activities." From the special study already performed, she knew that materials handling and inspecting involved significant cost; from production reports, she also knew that the rework activity involved significant cost. If the ABC and unit-based cost assignments did not differ by breaking out these three major activities, then ABC may not matter.
Pursuant to the request, Jacob produced the following cost and driver information:
Expected activity demands:
Required
Three different cost categories are provided by the Cable Service Division: direct tracing, driver tracing, and allocation. Discuss the meaning of each. Based on how costs are assigned, do you think that the Cable Service Division is using a functional-based or an activity-based cost accounting system? What other differences exist between functional-based and activity-based cost accounting systems?
Unlock Deck
Unlock for access to all 33 flashcards in this deck.
Unlock Deck
k this deck
15
Beauville Furniture Corporation produces sofas, recliners, and lounge chairs. Beauville is located in a medium-sized community in the southeastern part of the United States. It is a major employer in the community. In fact, the economic well-being of the community is tied very strongly to Beauville. Beauville operates a sawmill, a fabric plant, and a furniture plant in the same community.
The sawmill buys logs from independent producers. The sawmill then processes the logs into four grades of lumber: firsts and seconds, No. 1 common, No. 2 common, and No. 3 common. All costs incurred in the mill are common to the four grades of lumber. All four grades of lumber are used by the furniture plant. The mill transfers everything it produces to the furniture plant, and the grades are transferred at cost. Trucks are used to move the lumber from the mill to the furniture plant. Although no outside sales exist, the mill could sell to external customers, and the selling prices of the four grades are known.
The fabric plant is responsible for producing the fabric that is used by the furniture plant. To produce three totally different fabrics (identified by fabric ID codes FB60, FB70, and FB80, respectively), the plant has three separate production operations-one for each fabric. Thus, production of all three fabrics occurs at the same time in different locations in the plant. Each fabric's production operation has two processes: the weaving and pattern process and the coloring and bolting process. In the weaving and pattern process, yarn is used to create yards of fabric with different designs. In the next process, the fabric is dyed, cut into 25-yard sections, and wrapped around cardboard rods to form 25-yard bolts. The bolts are transported by forklift to the furniture plant's Receiving Department. All of the output of the fabric plant is used by the furniture plant (to produce the sofas and chairs). For accounting purposes, the fabric is transferred at cost to the furniture plant.
The furniture plant produces orders for customers on a special-order basis. The customers specify the quantity, style, fabric, lumber grade, and pattern. Typically, jobs are large (involving at least 500 units). The plant has two production departments: Cutting and Assembly. In the Cutting Department, the fabric and wooden frame components are sized and cut. Other components are purchased from external suppliers and are removed from stores as needed for assembly. After the fabric and wooden components are finished for the entire job, they are moved to the Assembly Department. The Assembly Department takes the individual components and assembles the sofas (or chairs).
Beauville Furniture has been in business for over two decades and has a good reputation. However, during the past five years, Beauville experienced eroding profits and declining sales. Bids were increasingly lost (even aggressive bids) on the more popular models. Yet, the company was winning bids on some of the more-difficult-to-produce items. Lance Hays, the owner and manager, was frustrated. He simply couldn't understand how some of his competitors could sell for such low prices. On a common sofa job involving 500 units, Beauville's bids were running $25 per unit, or $12,500 per job more than the winning bids (on average). Yet, on the more difficult items, Beauville's bids were running about $60 per unit less than the next closest bid. Gisela Berling, vice president of finance, was assigned the task of preparing a cost analysis of the company's product lines. Lance wanted to know if the company's costs were excessive. Perhaps the company was being wasteful, and it was simply costing more to produce furniture than it was costing its competitors.
Gisela prepared herself by reading recent literature on cost management and product costing and attending several conferences that explored the same issues. She then reviewed the costing procedures of the company's mill and two plants and did a preliminary assessment of their soundness. The production costs of the mill were common to all lumber grades and were assigned using the physical units method. Since the output and production costs were fairly uniform throughout the year, the mill used an actual costing system. Although Gisela had no difficulty with actual costing, she decided to explore the effects of using the sales-value-at-split-off method. Thus, cost and production data for the mill were gathered so that an analysis could be conducted. The two plants used normal costing systems. The fabric plant used process costing, and the furniture plant used job-order costing. Both plants used plantwide overhead rates based on direct labor hours. Based on her initial reviews, she concluded that the costing procedures for the fabric plant were satisfactory. Essentially, there was no evidence of product diversity. A statistical analysis revealed that about 90 percent of the variability in the plant's overhead cost could be explained by direct labor hours. Thus, the use of a plantwide overhead rate based on direct labor hours seemed justified. What did concern her, though, was the material waste that she observed in the plant. Maybe a standard cost system would be useful for increasing the overall cost efficiency of the plant. Consequently, as part of her report to Lance, she decided to include a description of the fabric plant's costing procedures-at least for one of the fabric types. She also decided to develop a standard cost sheet for the chosen fabric. The furniture plant, however, was a more difficult matter. Product diversity was present and could be causing some distortions in product costs. Furthermore, statistical analysis revealed that only about 40 percent of the variability in overhead cost was explained by the direct labor hours. She decided that additional analysis was needed so that a sound product costing method could be recommended. One possibility would be to increase the number of overhead rates. Thus, she decided to include departmental data so that the effect of moving to departmental rates could be assessed. Finally, she also wanted to explore the possibility of converting the sawmill and fabric plant into profit centers and changing the existing transfer pricing policy.
With the cooperation of the cost accounting manager for the mill and each plant's controller, she gathered the following data for last year:
Sawmill:
Joint manufacturing costs: $900,000
Fabric Plant:
Budgeted overhead: $1,200,000 (50% fixed)
Practical volume (direct labor hours): 120,000 hours
Actual overhead: $1,150,000 (50% fixed)
Actual hours worked:
Departmental data on Fabric FB70 (actual costs and actual outcomes):
*Unitsare measured in yards for the Weaving and Pattern Department and in bolts forthe Coloring and Bolting Department. Note: With the exception of the cardboard bolt rods, materials are added at the beginning of each process. The cost of the rods is relatively insignificant and is included in overhead.
Proposed standard cost sheet for Fabric FB70 (for the Coloring and Bolting Department only):
Furniture Plant:
Departmental data (budgeted):
After some discussion with the furniture plant controller, Gisela decided to use machine hours to calculate the overhead rate for the Cutting Department and direct labor hours for the Assembly Department rate (the Cutting Department was more automated than the Assembly Department). As part of her report, she wanted to compare the effects of plantwide rates and departmental rates on the cost of jobs. She wanted to know if overhead costing could be the source of the pricing problems the company was experiencing.
To assess the effect of the different overhead assignment procedures, Gisela decided to examine two prospective jobs. One job, Job A500, could produce 500 sofas, using a frequently requested style and Fabric FB70. Bids on this type of job were being lost more frequently to competitors. The second job, Job B75, would produce 75 specially designed recliners. This job involved a new design and was more difficult for the workers to build. It involved some special cutting requirements and an unfamiliar assembly. Recently, the company seemed to be winning more bids on jobs of this type. To compute the costs of the two jobs, Gisela assembled the following information on the two jobs:
Job A500:
Job B75:
Required
Assume that the standard hours allowed for the actual total output of the fabric plant are 115,000. Calculate the following variances:
a. Fixed overhead spending variance
b. Fixed overhead volume variance
c. Variable overhead spending variance
d. Variable overhead efficiency variance
Unlock Deck
Unlock for access to all 33 flashcards in this deck.
Unlock Deck
k this deck
16
CableTech Bell Corporation (CTB) operates in the telecommunications industry. CTB has two divisions: the Phone Division and the Cable Service Division. The Phone Division manufactures telephones in several plants located in the Midwest. The product lines run from relatively inexpensive touch-tone wall and desk phones to expensive, high-quality cellular phones. CTB also operates a cable TV service in Ohio. The Cable Service Division offers three products: a basic package with 25 channels; an enhanced package, which is the basic package plus 15 additional channels and two movie channels; and a premium package, which is the basic package plus 25 additional channels and three movie channels.
The Cable Service Division reported the following activity for the month of March:
The unit costs are divided as follows: 70 percent production and 30 percent marketing and customer service. Direct labor cost is the only driver used for tracing. Typically, the division uses only production costs to define unit costs. The preceding unit product cost information was provided at the request of the marketing manager and was the result of a special study.
Bryce Youngers, the president of CTB, is reasonably satisfied with the performance of the Cable Service Division. March's performance is fairly typical of what has been happening over the past two years. The Phone Division, however, is another matter. Its overall profit performance has been declining. Two years ago, income before income taxes had been about 25 percent of sales. March's dismal performance was also typical for what has been happening this year and is expected to continue-unless some action by management is taken to reverse the trend. During March, the Phone Division reported the following results:
During March, the Phone Division purchased materials totaling $312,000. There are no significant inventories of supplies (beginning or ending). Supplies are accounted for separately from materials. CTB's Phone Division had sales totaling $1,170,000 for March.
Based on March's results, Bryce decided to meet with three of the Phone Division's managers: Kim Breashears, divisional manager; Jacob Carder, divisional controller; and Larry Hartley, sales manager. A transcript of their recorded conversation is given next:
Bryce: "March's profit performance is down once again, and I think we need to see if we can identify the problem and correct it-before it's too late. Kim, what's your assessment of the situation?"
Kim: "Foreign competition is eating us alive. They are coming in with lower-priced phones of comparable or higher quality than our own. I've talked with several of the retailers that carry our lines, and they say the same. They are convinced that we can sell more if we lower our prices."
Larry: "They're right. If we could lower our prices by 10 to 15 percent, I think that we'd regain most ofour lost market share. But we also need to make sure that the quality of our products meets that of our competitors. As you know, we are spending a lot of money each month on rework and warranties. That worries me. I'd like to see that warranty cost cut by 70 to 80 percent. If we could do that, then customers would be more satisfied with our products, and I bet that we would not only regain our market share but increase it."
Jacob: "Lowering prices without lowering per-unit costs will not help us increase our profitability.
I think we need to improve our cost accounting system. I am not confident that we really know how much each of our product lines is costing us. It may be that we are overpricing some of our units because we are overcosting them. We may be underpricing other units."
Larry: "This sounds promising-especially if the overcosting is for some of our high-volume lines. A price decrease for these products would make the biggest difference-and if we knew they were overcosted, then we could offer immediate price reductions."
Bryce: "Jacob, I need more explanation. We have been using the same cost accounting system for the last 10 years. Why would it be a problem?"
Jacob: "I think that our manufacturing environment has changed. Over the years, we have added a lot of different product lines. Some of these products make very different demands on our manufacturing overhead resources. We trace-or attempt to trace-overhead costs to the different products using direct labor cost, a unit-based cost driver. We may be doing more allocation than tracing. If so, then we probably don't have a very good idea of our actual product costs. Also, as you know, with the way computer technology has changed over time, it is easier and cheaper to collect and use detailed information-information that will allow us to assign costs more accurately."
Bryce: "This may be something we should explore. Jacob, what do you suggest?"
Jacob: "If we want more accurate product costs and if we really want to get in the cost reduction business, then we need to understand how costs behave. In particular, we need to understand activity cost behavior. Knowing what activities we perform, why we perform them, and how well we perform them will help us identify areas for improvement. We also need to know how the different products consume activity resources. What this boils down to is the need to use an activity-based management system. But before we jump into this, we need some idea of whether non-unit-based drivers add anything. Activity-based management is not an inexpensive undertaking. So I suggest that we do a preliminary study to see if direct labor cost is adequate for tracing. If not, then maybe some non-unit-drivers might be needed. In fact, if you would like,
I can gather some data that will provide some evidence on the usefulness of the activity-based approach."
Bryce: "What do you think, Kim? It's your division."
Kim: "What Jacob has said sounds promising. I think he should pursue it and do so quickly. I also think that we need to look at improving our quality. It sounds like we have a problem there. If quality could be improved, then our costs will drop. I'll talk to our quality people. Jacob, in the meantime, find out for us if moving to an activity-based system is the way to go. How much time do you need?"
Jacob: "I have already been gathering data. I could probably have a report within two weeks."
Based on my initial analysis, I am confident that an ABC system will offer significant improvement. For one of our conventional phone plants, I regressed total monthly overhead cost on monthly direct labor cost using the following 15 months of data:
The results were revealing. Although direct labor cost appears to be a driver of overhead cost, it really doesn't explain a lot of the variation. I then searched for other drivers-particularly non-unit drivers-that might offer more insight into overhead cost behavior. Every time a batch is produced, material movement occurs, regardless of the size of the batch. The number of moves seemed like a more logical driver. I was able to gather only 10 months of data for this. (Our information system doesn't provide the number of moves, so I had to build the data set by interviewing production personnel.) This information is provided next:
The regression results were impressive. There is no question in my mind that the number of moves is a good driver of materials-handling costs. Using the number of moves to assign materials-handling costs to products would likely be better than the cost assignment using direct labor cost. Furthermore, since small batches use the same number of moves as large batches, we have some evidence that we may be overcosting our high-volume products.
I looked at one more overhead activity: inspecting products. We have 15 inspectors who are paid an average of $4,000 per month. Each inspector offers about 160 hours of inspection capacity per month. However, it appears that they actually work only about 80 percent of those hours. The drop in demand we have experienced explains this idle time. I see no evidence of variable cost behavior here. I'm not exactly sure how to treat inspection cost, but I think that it is more related to inspection hours than direct labor cost. Some of the other overhead activities seem to be non-unit-level, as well-enough, in fact, to be concerned about how we assign costs.
After receiving the memo, Kim was intrigued. She then asked Jacob to use the same phone plant as a pilot for a preliminary ABC analysis. She instructed him to assign all overhead costs to the plant's two products (Regular and Deluxe models), using only four activities. The four activities were rework, moving materials, inspecting products, and a general catch-all activity labeled "other manufacturing activities." From the special study already performed, she knew that materials handling and inspecting involved significant cost; from production reports, she also knew that the rework activity involved significant cost. If the ABC and unit-based cost assignments did not differ by breaking out these three major activities, then ABC may not matter.
Pursuant to the request, Jacob produced the following cost and driver information:
Expected activity demands:
Required
Discuss the differences between the Cable Service Division's products and the Phone Division's products.
Unlock Deck
Unlock for access to all 33 flashcards in this deck.
Unlock Deck
k this deck
17
Beauville Furniture Corporation produces sofas, recliners, and lounge chairs. Beauville is located in a medium-sized community in the southeastern part of the United States. It is a major employer in the community. In fact, the economic well-being of the community is tied very strongly to Beauville. Beauville operates a sawmill, a fabric plant, and a furniture plant in the same community.
The sawmill buys logs from independent producers. The sawmill then processes the logs into four grades of lumber: firsts and seconds, No. 1 common, No. 2 common, and No. 3 common. All costs incurred in the mill are common to the four grades of lumber. All four grades of lumber are used by the furniture plant. The mill transfers everything it produces to the furniture plant, and the grades are transferred at cost. Trucks are used to move the lumber from the mill to the furniture plant. Although no outside sales exist, the mill could sell to external customers, and the selling prices of the four grades are known.
The fabric plant is responsible for producing the fabric that is used by the furniture plant. To produce three totally different fabrics (identified by fabric ID codes FB60, FB70, and FB80, respectively), the plant has three separate production operations-one for each fabric. Thus, production of all three fabrics occurs at the same time in different locations in the plant. Each fabric's production operation has two processes: the weaving and pattern process and the coloring and bolting process. In the weaving and pattern process, yarn is used to create yards of fabric with different designs. In the next process, the fabric is dyed, cut into 25-yard sections, and wrapped around cardboard rods to form 25-yard bolts. The bolts are transported by forklift to the furniture plant's Receiving Department. All of the output of the fabric plant is used by the furniture plant (to produce the sofas and chairs). For accounting purposes, the fabric is transferred at cost to the furniture plant.
The furniture plant produces orders for customers on a special-order basis. The customers specify the quantity, style, fabric, lumber grade, and pattern. Typically, jobs are large (involving at least 500 units). The plant has two production departments: Cutting and Assembly. In the Cutting Department, the fabric and wooden frame components are sized and cut. Other components are purchased from external suppliers and are removed from stores as needed for assembly. After the fabric and wooden components are finished for the entire job, they are moved to the Assembly Department. The Assembly Department takes the individual components and assembles the sofas (or chairs).
Beauville Furniture has been in business for over two decades and has a good reputation. However, during the past five years, Beauville experienced eroding profits and declining sales. Bids were increasingly lost (even aggressive bids) on the more popular models. Yet, the company was winning bids on some of the more-difficult-to-produce items. Lance Hays, the owner and manager, was frustrated. He simply couldn't understand how some of his competitors could sell for such low prices. On a common sofa job involving 500 units, Beauville's bids were running $25 per unit, or $12,500 per job more than the winning bids (on average). Yet, on the more difficult items, Beauville's bids were running about $60 per unit less than the next closest bid. Gisela Berling, vice president of finance, was assigned the task of preparing a cost analysis of the company's product lines. Lance wanted to know if the company's costs were excessive. Perhaps the company was being wasteful, and it was simply costing more to produce furniture than it was costing its competitors.
Gisela prepared herself by reading recent literature on cost management and product costing and attending several conferences that explored the same issues. She then reviewed the costing procedures of the company's mill and two plants and did a preliminary assessment of their soundness. The production costs of the mill were common to all lumber grades and were assigned using the physical units method. Since the output and production costs were fairly uniform throughout the year, the mill used an actual costing system. Although Gisela had no difficulty with actual costing, she decided to explore the effects of using the sales-value-at-split-off method. Thus, cost and production data for the mill were gathered so that an analysis could be conducted. The two plants used normal costing systems. The fabric plant used process costing, and the furniture plant used job-order costing. Both plants used plantwide overhead rates based on direct labor hours. Based on her initial reviews, she concluded that the costing procedures for the fabric plant were satisfactory. Essentially, there was no evidence of product diversity. A statistical analysis revealed that about 90 percent of the variability in the plant's overhead cost could be explained by direct labor hours. Thus, the use of a plantwide overhead rate based on direct labor hours seemed justified. What did concern her, though, was the material waste that she observed in the plant. Maybe a standard cost system would be useful for increasing the overall cost efficiency of the plant. Consequently, as part of her report to Lance, she decided to include a description of the fabric plant's costing procedures-at least for one of the fabric types. She also decided to develop a standard cost sheet for the chosen fabric. The furniture plant, however, was a more difficult matter. Product diversity was present and could be causing some distortions in product costs. Furthermore, statistical analysis revealed that only about 40 percent of the variability in overhead cost was explained by the direct labor hours. She decided that additional analysis was needed so that a sound product costing method could be recommended. One possibility would be to increase the number of overhead rates. Thus, she decided to include departmental data so that the effect of moving to departmental rates could be assessed. Finally, she also wanted to explore the possibility of converting the sawmill and fabric plant into profit centers and changing the existing transfer pricing policy.
With the cooperation of the cost accounting manager for the mill and each plant's controller, she gathered the following data for last year:
Sawmill:
Joint manufacturing costs: $900,000
Fabric Plant:
Budgeted overhead: $1,200,000 (50% fixed)
Practical volume (direct labor hours): 120,000 hours
Actual overhead: $1,150,000 (50% fixed)
Actual hours worked:
Departmental data on Fabric FB70 (actual costs and actual outcomes):
*Unitsare measured in yards for the Weaving and Pattern Department and in bolts forthe Coloring and Bolting Department. Note: With the exception of the cardboard bolt rods, materials are added at the beginning of each process. The cost of the rods is relatively insignificant and is included in overhead.
Proposed standard cost sheet for Fabric FB70 (for the Coloring and Bolting Department only):
Furniture Plant:
Departmental data (budgeted):
After some discussion with the furniture plant controller, Gisela decided to use machine hours to calculate the overhead rate for the Cutting Department and direct labor hours for the Assembly Department rate (the Cutting Department was more automated than the Assembly Department). As part of her report, she wanted to compare the effects of plantwide rates and departmental rates on the cost of jobs. She wanted to know if overhead costing could be the source of the pricing problems the company was experiencing.
To assess the effect of the different overhead assignment procedures, Gisela decided to examine two prospective jobs. One job, Job A500, could produce 500 sofas, using a frequently requested style and Fabric FB70. Bids on this type of job were being lost more frequently to competitors. The second job, Job B75, would produce 75 specially designed recliners. This job involved a new design and was more difficult for the workers to build. It involved some special cutting requirements and an unfamiliar assembly. Recently, the company seemed to be winning more bids on jobs of this type. To compute the costs of the two jobs, Gisela assembled the following information on the two jobs:
Job A500:
Job B75:
Required
Suppose that the fabric plant has 500 bolts of FB70 in beginning finished goods inventory. The current-year plan is to have 1,000 bolts of FB70 in finished goods inventory at the end of the year. This fabric has an external market price of $400 per bolt. If the fabric plant is set up as a profit center, it could sell 3,000 bolts per year to outside customers and supply 2,000 bolts per year internally to Beauville's furniture plant. If the fabric plant were designated as a profit center, the plant would transfer all goods internally at market price. Using the proposed standard cost sheet (as needed) and any other relevant data, prepare the following for Fabric FB70:
a. Sales budget
b. Production budget
c. Direct labor budget
d. Cost of goods sold budget
Unlock Deck
Unlock for access to all 33 flashcards in this deck.
Unlock Deck
k this deck
18
CableTech Bell Corporation (CTB) operates in the telecommunications industry. CTB has two divisions: the Phone Division and the Cable Service Division. The Phone Division manufactures telephones in several plants located in the Midwest. The product lines run from relatively inexpensive touch-tone wall and desk phones to expensive, high-quality cellular phones. CTB also operates a cable TV service in Ohio. The Cable Service Division offers three products: a basic package with 25 channels; an enhanced package, which is the basic package plus 15 additional channels and two movie channels; and a premium package, which is the basic package plus 25 additional channels and three movie channels.
The Cable Service Division reported the following activity for the month of March:
The unit costs are divided as follows: 70 percent production and 30 percent marketing and customer service. Direct labor cost is the only driver used for tracing. Typically, the division uses only production costs to define unit costs. The preceding unit product cost information was provided at the request of the marketing manager and was the result of a special study.
Bryce Youngers, the president of CTB, is reasonably satisfied with the performance of the Cable Service Division. March's performance is fairly typical of what has been happening over the past two years. The Phone Division, however, is another matter. Its overall profit performance has been declining. Two years ago, income before income taxes had been about 25 percent of sales. March's dismal performance was also typical for what has been happening this year and is expected to continue-unless some action by management is taken to reverse the trend. During March, the Phone Division reported the following results:
During March, the Phone Division purchased materials totaling $312,000. There are no significant inventories of supplies (beginning or ending). Supplies are accounted for separately from materials. CTB's Phone Division had sales totaling $1,170,000 for March.
Based on March's results, Bryce decided to meet with three of the Phone Division's managers: Kim Breashears, divisional manager; Jacob Carder, divisional controller; and Larry Hartley, sales manager. A transcript of their recorded conversation is given next:
Bryce: "March's profit performance is down once again, and I think we need to see if we can identify the problem and correct it-before it's too late. Kim, what's your assessment of the situation?"
Kim: "Foreign competition is eating us alive. They are coming in with lower-priced phones of comparable or higher quality than our own. I've talked with several of the retailers that carry our lines, and they say the same. They are convinced that we can sell more if we lower our prices."
Larry: "They're right. If we could lower our prices by 10 to 15 percent, I think that we'd regain most ofour lost market share. But we also need to make sure that the quality of our products meets that of our competitors. As you know, we are spending a lot of money each month on rework and warranties. That worries me. I'd like to see that warranty cost cut by 70 to 80 percent. If we could do that, then customers would be more satisfied with our products, and I bet that we would not only regain our market share but increase it."
Jacob: "Lowering prices without lowering per-unit costs will not help us increase our profitability.
I think we need to improve our cost accounting system. I am not confident that we really know how much each of our product lines is costing us. It may be that we are overpricing some of our units because we are overcosting them. We may be underpricing other units."
Larry: "This sounds promising-especially if the overcosting is for some of our high-volume lines. A price decrease for these products would make the biggest difference-and if we knew they were overcosted, then we could offer immediate price reductions."
Bryce: "Jacob, I need more explanation. We have been using the same cost accounting system for the last 10 years. Why would it be a problem?"
Jacob: "I think that our manufacturing environment has changed. Over the years, we have added a lot of different product lines. Some of these products make very different demands on our manufacturing overhead resources. We trace-or attempt to trace-overhead costs to the different products using direct labor cost, a unit-based cost driver. We may be doing more allocation than tracing. If so, then we probably don't have a very good idea of our actual product costs. Also, as you know, with the way computer technology has changed over time, it is easier and cheaper to collect and use detailed information-information that will allow us to assign costs more accurately."
Bryce: "This may be something we should explore. Jacob, what do you suggest?"
Jacob: "If we want more accurate product costs and if we really want to get in the cost reduction business, then we need to understand how costs behave. In particular, we need to understand activity cost behavior. Knowing what activities we perform, why we perform them, and how well we perform them will help us identify areas for improvement. We also need to know how the different products consume activity resources. What this boils down to is the need to use an activity-based management system. But before we jump into this, we need some idea of whether non-unit-based drivers add anything. Activity-based management is not an inexpensive undertaking. So I suggest that we do a preliminary study to see if direct labor cost is adequate for tracing. If not, then maybe some non-unit-drivers might be needed. In fact, if you would like,
I can gather some data that will provide some evidence on the usefulness of the activity-based approach."
Bryce: "What do you think, Kim? It's your division."
Kim: "What Jacob has said sounds promising. I think he should pursue it and do so quickly. I also think that we need to look at improving our quality. It sounds like we have a problem there. If quality could be improved, then our costs will drop. I'll talk to our quality people. Jacob, in the meantime, find out for us if moving to an activity-based system is the way to go. How much time do you need?"
Jacob: "I have already been gathering data. I could probably have a report within two weeks."
Based on my initial analysis, I am confident that an ABC system will offer significant improvement. For one of our conventional phone plants, I regressed total monthly overhead cost on monthly direct labor cost using the following 15 months of data:
The results were revealing. Although direct labor cost appears to be a driver of overhead cost, it really doesn't explain a lot of the variation. I then searched for other drivers-particularly non-unit drivers-that might offer more insight into overhead cost behavior. Every time a batch is produced, material movement occurs, regardless of the size of the batch. The number of moves seemed like a more logical driver. I was able to gather only 10 months of data for this. (Our information system doesn't provide the number of moves, so I had to build the data set by interviewing production personnel.) This information is provided next:
The regression results were impressive. There is no question in my mind that the number of moves is a good driver of materials-handling costs. Using the number of moves to assign materials-handling costs to products would likely be better than the cost assignment using direct labor cost. Furthermore, since small batches use the same number of moves as large batches, we have some evidence that we may be overcosting our high-volume products.
I looked at one more overhead activity: inspecting products. We have 15 inspectors who are paid an average of $4,000 per month. Each inspector offers about 160 hours of inspection capacity per month. However, it appears that they actually work only about 80 percent of those hours. The drop in demand we have experienced explains this idle time. I see no evidence of variable cost behavior here. I'm not exactly sure how to treat inspection cost, but I think that it is more related to inspection hours than direct labor cost. Some of the other overhead activities seem to be non-unit-level, as well-enough, in fact, to be concerned about how we assign costs.
After receiving the memo, Kim was intrigued. She then asked Jacob to use the same phone plant as a pilot for a preliminary ABC analysis. She instructed him to assign all overhead costs to the plant's two products (Regular and Deluxe models), using only four activities. The four activities were rework, moving materials, inspecting products, and a general catch-all activity labeled "other manufacturing activities." From the special study already performed, she knew that materials handling and inspecting involved significant cost; from production reports, she also knew that the rework activity involved significant cost. If the ABC and unit-based cost assignments did not differ by breaking out these three major activities, then ABC may not matter.
Pursuant to the request, Jacob produced the following cost and driver information:
Expected activity demands:
Required
Prepare an income statement for the Cable Service Division for March.
Unlock Deck
Unlock for access to all 33 flashcards in this deck.
Unlock Deck
k this deck
19
Beauville Furniture Corporation produces sofas, recliners, and lounge chairs. Beauville is located in a medium-sized community in the southeastern part of the United States. It is a major employer in the community. In fact, the economic well-being of the community is tied very strongly to Beauville. Beauville operates a sawmill, a fabric plant, and a furniture plant in the same community.
The sawmill buys logs from independent producers. The sawmill then processes the logs into four grades of lumber: firsts and seconds, No. 1 common, No. 2 common, and No. 3 common. All costs incurred in the mill are common to the four grades of lumber. All four grades of lumber are used by the furniture plant. The mill transfers everything it produces to the furniture plant, and the grades are transferred at cost. Trucks are used to move the lumber from the mill to the furniture plant. Although no outside sales exist, the mill could sell to external customers, and the selling prices of the four grades are known.
The fabric plant is responsible for producing the fabric that is used by the furniture plant. To produce three totally different fabrics (identified by fabric ID codes FB60, FB70, and FB80, respectively), the plant has three separate production operations-one for each fabric. Thus, production of all three fabrics occurs at the same time in different locations in the plant. Each fabric's production operation has two processes: the weaving and pattern process and the coloring and bolting process. In the weaving and pattern process, yarn is used to create yards of fabric with different designs. In the next process, the fabric is dyed, cut into 25-yard sections, and wrapped around cardboard rods to form 25-yard bolts. The bolts are transported by forklift to the furniture plant's Receiving Department. All of the output of the fabric plant is used by the furniture plant (to produce the sofas and chairs). For accounting purposes, the fabric is transferred at cost to the furniture plant.
The furniture plant produces orders for customers on a special-order basis. The customers specify the quantity, style, fabric, lumber grade, and pattern. Typically, jobs are large (involving at least 500 units). The plant has two production departments: Cutting and Assembly. In the Cutting Department, the fabric and wooden frame components are sized and cut. Other components are purchased from external suppliers and are removed from stores as needed for assembly. After the fabric and wooden components are finished for the entire job, they are moved to the Assembly Department. The Assembly Department takes the individual components and assembles the sofas (or chairs).
Beauville Furniture has been in business for over two decades and has a good reputation. However, during the past five years, Beauville experienced eroding profits and declining sales. Bids were increasingly lost (even aggressive bids) on the more popular models. Yet, the company was winning bids on some of the more-difficult-to-produce items. Lance Hays, the owner and manager, was frustrated. He simply couldn't understand how some of his competitors could sell for such low prices. On a common sofa job involving 500 units, Beauville's bids were running $25 per unit, or $12,500 per job more than the winning bids (on average). Yet, on the more difficult items, Beauville's bids were running about $60 per unit less than the next closest bid. Gisela Berling, vice president of finance, was assigned the task of preparing a cost analysis of the company's product lines. Lance wanted to know if the company's costs were excessive. Perhaps the company was being wasteful, and it was simply costing more to produce furniture than it was costing its competitors.
Gisela prepared herself by reading recent literature on cost management and product costing and attending several conferences that explored the same issues. She then reviewed the costing procedures of the company's mill and two plants and did a preliminary assessment of their soundness. The production costs of the mill were common to all lumber grades and were assigned using the physical units method. Since the output and production costs were fairly uniform throughout the year, the mill used an actual costing system. Although Gisela had no difficulty with actual costing, she decided to explore the effects of using the sales-value-at-split-off method. Thus, cost and production data for the mill were gathered so that an analysis could be conducted. The two plants used normal costing systems. The fabric plant used process costing, and the furniture plant used job-order costing. Both plants used plantwide overhead rates based on direct labor hours. Based on her initial reviews, she concluded that the costing procedures for the fabric plant were satisfactory. Essentially, there was no evidence of product diversity. A statistical analysis revealed that about 90 percent of the variability in the plant's overhead cost could be explained by direct labor hours. Thus, the use of a plantwide overhead rate based on direct labor hours seemed justified. What did concern her, though, was the material waste that she observed in the plant. Maybe a standard cost system would be useful for increasing the overall cost efficiency of the plant. Consequently, as part of her report to Lance, she decided to include a description of the fabric plant's costing procedures-at least for one of the fabric types. She also decided to develop a standard cost sheet for the chosen fabric. The furniture plant, however, was a more difficult matter. Product diversity was present and could be causing some distortions in product costs. Furthermore, statistical analysis revealed that only about 40 percent of the variability in overhead cost was explained by the direct labor hours. She decided that additional analysis was needed so that a sound product costing method could be recommended. One possibility would be to increase the number of overhead rates. Thus, she decided to include departmental data so that the effect of moving to departmental rates could be assessed. Finally, she also wanted to explore the possibility of converting the sawmill and fabric plant into profit centers and changing the existing transfer pricing policy.
With the cooperation of the cost accounting manager for the mill and each plant's controller, she gathered the following data for last year:
Sawmill:
Joint manufacturing costs: $900,000
Fabric Plant:
Budgeted overhead: $1,200,000 (50% fixed)
Practical volume (direct labor hours): 120,000 hours
Actual overhead: $1,150,000 (50% fixed)
Actual hours worked:
Departmental data on Fabric FB70 (actual costs and actual outcomes):
*Unitsare measured in yards for the Weaving and Pattern Department and in bolts forthe Coloring and Bolting Department. Note: With the exception of the cardboard bolt rods, materials are added at the beginning of each process. The cost of the rods is relatively insignificant and is included in overhead.
Proposed standard cost sheet for Fabric FB70 (for the Coloring and Bolting Department only):
Furniture Plant:
Departmental data (budgeted):
After some discussion with the furniture plant controller, Gisela decided to use machine hours to calculate the overhead rate for the Cutting Department and direct labor hours for the Assembly Department rate (the Cutting Department was more automated than the Assembly Department). As part of her report, she wanted to compare the effects of plantwide rates and departmental rates on the cost of jobs. She wanted to know if overhead costing could be the source of the pricing problems the company was experiencing.
To assess the effect of the different overhead assignment procedures, Gisela decided to examine two prospective jobs. One job, Job A500, could produce 500 sofas, using a frequently requested style and Fabric FB70. Bids on this type of job were being lost more frequently to competitors. The second job, Job B75, would produce 75 specially designed recliners. This job involved a new design and was more difficult for the workers to build. It involved some special cutting requirements and an unfamiliar assembly. Recently, the company seemed to be winning more bids on jobs of this type. To compute the costs of the two jobs, Gisela assembled the following information on the two jobs:
Job A500:
Job B75:
Required
Calculate the following overhead rates for the furniture plant: (1) plantwide rate and (2) departmental rates. Use the direct method for assigning service costs to producing departments.
Unlock Deck
Unlock for access to all 33 flashcards in this deck.
Unlock Deck
k this deck
20
CableTech Bell Corporation (CTB) operates in the telecommunications industry. CTB has two divisions: the Phone Division and the Cable Service Division. The Phone Division manufactures telephones in several plants located in the Midwest. The product lines run from relatively inexpensive touch-tone wall and desk phones to expensive, high-quality cellular phones. CTB also operates a cable TV service in Ohio. The Cable Service Division offers three products: a basic package with 25 channels; an enhanced package, which is the basic package plus 15 additional channels and two movie channels; and a premium package, which is the basic package plus 25 additional channels and three movie channels.
The Cable Service Division reported the following activity for the month of March:
The unit costs are divided as follows: 70 percent production and 30 percent marketing and customer service. Direct labor cost is the only driver used for tracing. Typically, the division uses only production costs to define unit costs. The preceding unit product cost information was provided at the request of the marketing manager and was the result of a special study.
Bryce Youngers, the president of CTB, is reasonably satisfied with the performance of the Cable Service Division. March's performance is fairly typical of what has been happening over the past two years. The Phone Division, however, is another matter. Its overall profit performance has been declining. Two years ago, income before income taxes had been about 25 percent of sales. March's dismal performance was also typical for what has been happening this year and is expected to continue-unless some action by management is taken to reverse the trend. During March, the Phone Division reported the following results:
During March, the Phone Division purchased materials totaling $312,000. There are no significant inventories of supplies (beginning or ending). Supplies are accounted for separately from materials. CTB's Phone Division had sales totaling $1,170,000 for March.
Based on March's results, Bryce decided to meet with three of the Phone Division's managers: Kim Breashears, divisional manager; Jacob Carder, divisional controller; and Larry Hartley, sales manager. A transcript of their recorded conversation is given next:
Bryce: "March's profit performance is down once again, and I think we need to see if we can identify the problem and correct it-before it's too late. Kim, what's your assessment of the situation?"
Kim: "Foreign competition is eating us alive. They are coming in with lower-priced phones of comparable or higher quality than our own. I've talked with several of the retailers that carry our lines, and they say the same. They are convinced that we can sell more if we lower our prices."
Larry: "They're right. If we could lower our prices by 10 to 15 percent, I think that we'd regain most ofour lost market share. But we also need to make sure that the quality of our products meets that of our competitors. As you know, we are spending a lot of money each month on rework and warranties. That worries me. I'd like to see that warranty cost cut by 70 to 80 percent. If we could do that, then customers would be more satisfied with our products, and I bet that we would not only regain our market share but increase it."
Jacob: "Lowering prices without lowering per-unit costs will not help us increase our profitability.
I think we need to improve our cost accounting system. I am not confident that we really know how much each of our product lines is costing us. It may be that we are overpricing some of our units because we are overcosting them. We may be underpricing other units."
Larry: "This sounds promising-especially if the overcosting is for some of our high-volume lines. A price decrease for these products would make the biggest difference-and if we knew they were overcosted, then we could offer immediate price reductions."
Bryce: "Jacob, I need more explanation. We have been using the same cost accounting system for the last 10 years. Why would it be a problem?"
Jacob: "I think that our manufacturing environment has changed. Over the years, we have added a lot of different product lines. Some of these products make very different demands on our manufacturing overhead resources. We trace-or attempt to trace-overhead costs to the different products using direct labor cost, a unit-based cost driver. We may be doing more allocation than tracing. If so, then we probably don't have a very good idea of our actual product costs. Also, as you know, with the way computer technology has changed over time, it is easier and cheaper to collect and use detailed information-information that will allow us to assign costs more accurately."
Bryce: "This may be something we should explore. Jacob, what do you suggest?"
Jacob: "If we want more accurate product costs and if we really want to get in the cost reduction business, then we need to understand how costs behave. In particular, we need to understand activity cost behavior. Knowing what activities we perform, why we perform them, and how well we perform them will help us identify areas for improvement. We also need to know how the different products consume activity resources. What this boils down to is the need to use an activity-based management system. But before we jump into this, we need some idea of whether non-unit-based drivers add anything. Activity-based management is not an inexpensive undertaking. So I suggest that we do a preliminary study to see if direct labor cost is adequate for tracing. If not, then maybe some non-unit-drivers might be needed. In fact, if you would like,
I can gather some data that will provide some evidence on the usefulness of the activity-based approach."
Bryce: "What do you think, Kim? It's your division."
Kim: "What Jacob has said sounds promising. I think he should pursue it and do so quickly. I also think that we need to look at improving our quality. It sounds like we have a problem there. If quality could be improved, then our costs will drop. I'll talk to our quality people. Jacob, in the meantime, find out for us if moving to an activity-based system is the way to go. How much time do you need?"
Jacob: "I have already been gathering data. I could probably have a report within two weeks."
Based on my initial analysis, I am confident that an ABC system will offer significant improvement. For one of our conventional phone plants, I regressed total monthly overhead cost on monthly direct labor cost using the following 15 months of data:
The results were revealing. Although direct labor cost appears to be a driver of overhead cost, it really doesn't explain a lot of the variation. I then searched for other drivers-particularly non-unit drivers-that might offer more insight into overhead cost behavior. Every time a batch is produced, material movement occurs, regardless of the size of the batch. The number of moves seemed like a more logical driver. I was able to gather only 10 months of data for this. (Our information system doesn't provide the number of moves, so I had to build the data set by interviewing production personnel.) This information is provided next:
The regression results were impressive. There is no question in my mind that the number of moves is a good driver of materials-handling costs. Using the number of moves to assign materials-handling costs to products would likely be better than the cost assignment using direct labor cost. Furthermore, since small batches use the same number of moves as large batches, we have some evidence that we may be overcosting our high-volume products.
I looked at one more overhead activity: inspecting products. We have 15 inspectors who are paid an average of $4,000 per month. Each inspector offers about 160 hours of inspection capacity per month. However, it appears that they actually work only about 80 percent of those hours. The drop in demand we have experienced explains this idle time. I see no evidence of variable cost behavior here. I'm not exactly sure how to treat inspection cost, but I think that it is more related to inspection hours than direct labor cost. Some of the other overhead activities seem to be non-unit-level, as well-enough, in fact, to be concerned about how we assign costs.
After receiving the memo, Kim was intrigued. She then asked Jacob to use the same phone plant as a pilot for a preliminary ABC analysis. She instructed him to assign all overhead costs to the plant's two products (Regular and Deluxe models), using only four activities. The four activities were rework, moving materials, inspecting products, and a general catch-all activity labeled "other manufacturing activities." From the special study already performed, she knew that materials handling and inspecting involved significant cost; from production reports, she also knew that the rework activity involved significant cost. If the ABC and unit-based cost assignments did not differ by breaking out these three major activities, then ABC may not matter.
Pursuant to the request, Jacob produced the following cost and driver information:
Expected activity demands:
Required
Prepare an income statement for the Phone Division for March. Include a supporting cost of goods manufactured statement.
Unlock Deck
Unlock for access to all 33 flashcards in this deck.
Unlock Deck
k this deck
21
Beauville Furniture Corporation produces sofas, recliners, and lounge chairs. Beauville is located in a medium-sized community in the southeastern part of the United States. It is a major employer in the community. In fact, the economic well-being of the community is tied very strongly to Beauville. Beauville operates a sawmill, a fabric plant, and a furniture plant in the same community.
The sawmill buys logs from independent producers. The sawmill then processes the logs into four grades of lumber: firsts and seconds, No. 1 common, No. 2 common, and No. 3 common. All costs incurred in the mill are common to the four grades of lumber. All four grades of lumber are used by the furniture plant. The mill transfers everything it produces to the furniture plant, and the grades are transferred at cost. Trucks are used to move the lumber from the mill to the furniture plant. Although no outside sales exist, the mill could sell to external customers, and the selling prices of the four grades are known.
The fabric plant is responsible for producing the fabric that is used by the furniture plant. To produce three totally different fabrics (identified by fabric ID codes FB60, FB70, and FB80, respectively), the plant has three separate production operations-one for each fabric. Thus, production of all three fabrics occurs at the same time in different locations in the plant. Each fabric's production operation has two processes: the weaving and pattern process and the coloring and bolting process. In the weaving and pattern process, yarn is used to create yards of fabric with different designs. In the next process, the fabric is dyed, cut into 25-yard sections, and wrapped around cardboard rods to form 25-yard bolts. The bolts are transported by forklift to the furniture plant's Receiving Department. All of the output of the fabric plant is used by the furniture plant (to produce the sofas and chairs). For accounting purposes, the fabric is transferred at cost to the furniture plant.
The furniture plant produces orders for customers on a special-order basis. The customers specify the quantity, style, fabric, lumber grade, and pattern. Typically, jobs are large (involving at least 500 units). The plant has two production departments: Cutting and Assembly. In the Cutting Department, the fabric and wooden frame components are sized and cut. Other components are purchased from external suppliers and are removed from stores as needed for assembly. After the fabric and wooden components are finished for the entire job, they are moved to the Assembly Department. The Assembly Department takes the individual components and assembles the sofas (or chairs).
Beauville Furniture has been in business for over two decades and has a good reputation. However, during the past five years, Beauville experienced eroding profits and declining sales. Bids were increasingly lost (even aggressive bids) on the more popular models. Yet, the company was winning bids on some of the more-difficult-to-produce items. Lance Hays, the owner and manager, was frustrated. He simply couldn't understand how some of his competitors could sell for such low prices. On a common sofa job involving 500 units, Beauville's bids were running $25 per unit, or $12,500 per job more than the winning bids (on average). Yet, on the more difficult items, Beauville's bids were running about $60 per unit less than the next closest bid. Gisela Berling, vice president of finance, was assigned the task of preparing a cost analysis of the company's product lines. Lance wanted to know if the company's costs were excessive. Perhaps the company was being wasteful, and it was simply costing more to produce furniture than it was costing its competitors.
Gisela prepared herself by reading recent literature on cost management and product costing and attending several conferences that explored the same issues. She then reviewed the costing procedures of the company's mill and two plants and did a preliminary assessment of their soundness. The production costs of the mill were common to all lumber grades and were assigned using the physical units method. Since the output and production costs were fairly uniform throughout the year, the mill used an actual costing system. Although Gisela had no difficulty with actual costing, she decided to explore the effects of using the sales-value-at-split-off method. Thus, cost and production data for the mill were gathered so that an analysis could be conducted. The two plants used normal costing systems. The fabric plant used process costing, and the furniture plant used job-order costing. Both plants used plantwide overhead rates based on direct labor hours. Based on her initial reviews, she concluded that the costing procedures for the fabric plant were satisfactory. Essentially, there was no evidence of product diversity. A statistical analysis revealed that about 90 percent of the variability in the plant's overhead cost could be explained by direct labor hours. Thus, the use of a plantwide overhead rate based on direct labor hours seemed justified. What did concern her, though, was the material waste that she observed in the plant. Maybe a standard cost system would be useful for increasing the overall cost efficiency of the plant. Consequently, as part of her report to Lance, she decided to include a description of the fabric plant's costing procedures-at least for one of the fabric types. She also decided to develop a standard cost sheet for the chosen fabric. The furniture plant, however, was a more difficult matter. Product diversity was present and could be causing some distortions in product costs. Furthermore, statistical analysis revealed that only about 40 percent of the variability in overhead cost was explained by the direct labor hours. She decided that additional analysis was needed so that a sound product costing method could be recommended. One possibility would be to increase the number of overhead rates. Thus, she decided to include departmental data so that the effect of moving to departmental rates could be assessed. Finally, she also wanted to explore the possibility of converting the sawmill and fabric plant into profit centers and changing the existing transfer pricing policy.
With the cooperation of the cost accounting manager for the mill and each plant's controller, she gathered the following data for last year:
Sawmill:
Joint manufacturing costs: $900,000
Fabric Plant:
Budgeted overhead: $1,200,000 (50% fixed)
Practical volume (direct labor hours): 120,000 hours
Actual overhead: $1,150,000 (50% fixed)
Actual hours worked:
Departmental data on Fabric FB70 (actual costs and actual outcomes):
*Unitsare measured in yards for the Weaving and Pattern Department and in bolts forthe Coloring and Bolting Department. Note: With the exception of the cardboard bolt rods, materials are added at the beginning of each process. The cost of the rods is relatively insignificant and is included in overhead.
Proposed standard cost sheet for Fabric FB70 (for the Coloring and Bolting Department only):
Furniture Plant:
Departmental data (budgeted):
After some discussion with the furniture plant controller, Gisela decided to use machine hours to calculate the overhead rate for the Cutting Department and direct labor hours for the Assembly Department rate (the Cutting Department was more automated than the Assembly Department). As part of her report, she wanted to compare the effects of plantwide rates and departmental rates on the cost of jobs. She wanted to know if overhead costing could be the source of the pricing problems the company was experiencing.
To assess the effect of the different overhead assignment procedures, Gisela decided to examine two prospective jobs. One job, Job A500, could produce 500 sofas, using a frequently requested style and Fabric FB70. Bids on this type of job were being lost more frequently to competitors. The second job, Job B75, would produce 75 specially designed recliners. This job involved a new design and was more difficult for the workers to build. It involved some special cutting requirements and an unfamiliar assembly. Recently, the company seemed to be winning more bids on jobs of this type. To compute the costs of the two jobs, Gisela assembled the following information on the two jobs:
Job A500:
Job B75:
Required
For each of the overhead rates computed in Requirement 9, calculate unit bid prices for Jobs A500 and B75. Assume that the company's aggressive bidding policy is unit cost plus 50 percent. Did departmental overhead rates have any effect on Beauville's winning or losing bids? What recommendation would you make? Explain. Now, adjust the costs and bids for departmental rate bids using the proposed standard costs for the Coloring and Bolting Department. Did this make a difference? What does this tell you?
Unlock Deck
Unlock for access to all 33 flashcards in this deck.
Unlock Deck
k this deck
22
CableTech Bell Corporation (CTB) operates in the telecommunications industry. CTB has two divisions: the Phone Division and the Cable Service Division. The Phone Division manufactures telephones in several plants located in the Midwest. The product lines run from relatively inexpensive touch-tone wall and desk phones to expensive, high-quality cellular phones. CTB also operates a cable TV service in Ohio. The Cable Service Division offers three products: a basic package with 25 channels; an enhanced package, which is the basic package plus 15 additional channels and two movie channels; and a premium package, which is the basic package plus 25 additional channels and three movie channels.
The Cable Service Division reported the following activity for the month of March:
The unit costs are divided as follows: 70 percent production and 30 percent marketing and customer service. Direct labor cost is the only driver used for tracing. Typically, the division uses only production costs to define unit costs. The preceding unit product cost information was provided at the request of the marketing manager and was the result of a special study.
Bryce Youngers, the president of CTB, is reasonably satisfied with the performance of the Cable Service Division. March's performance is fairly typical of what has been happening over the past two years. The Phone Division, however, is another matter. Its overall profit performance has been declining. Two years ago, income before income taxes had been about 25 percent of sales. March's dismal performance was also typical for what has been happening this year and is expected to continue-unless some action by management is taken to reverse the trend. During March, the Phone Division reported the following results:
During March, the Phone Division purchased materials totaling $312,000. There are no significant inventories of supplies (beginning or ending). Supplies are accounted for separately from materials. CTB's Phone Division had sales totaling $1,170,000 for March.
Based on March's results, Bryce decided to meet with three of the Phone Division's managers: Kim Breashears, divisional manager; Jacob Carder, divisional controller; and Larry Hartley, sales manager. A transcript of their recorded conversation is given next:
Bryce: "March's profit performance is down once again, and I think we need to see if we can identify the problem and correct it-before it's too late. Kim, what's your assessment of the situation?"
Kim: "Foreign competition is eating us alive. They are coming in with lower-priced phones of comparable or higher quality than our own. I've talked with several of the retailers that carry our lines, and they say the same. They are convinced that we can sell more if we lower our prices."
Larry: "They're right. If we could lower our prices by 10 to 15 percent, I think that we'd regain most ofour lost market share. But we also need to make sure that the quality of our products meets that of our competitors. As you know, we are spending a lot of money each month on rework and warranties. That worries me. I'd like to see that warranty cost cut by 70 to 80 percent. If we could do that, then customers would be more satisfied with our products, and I bet that we would not only regain our market share but increase it."
Jacob: "Lowering prices without lowering per-unit costs will not help us increase our profitability.
I think we need to improve our cost accounting system. I am not confident that we really know how much each of our product lines is costing us. It may be that we are overpricing some of our units because we are overcosting them. We may be underpricing other units."
Larry: "This sounds promising-especially if the overcosting is for some of our high-volume lines. A price decrease for these products would make the biggest difference-and if we knew they were overcosted, then we could offer immediate price reductions."
Bryce: "Jacob, I need more explanation. We have been using the same cost accounting system for the last 10 years. Why would it be a problem?"
Jacob: "I think that our manufacturing environment has changed. Over the years, we have added a lot of different product lines. Some of these products make very different demands on our manufacturing overhead resources. We trace-or attempt to trace-overhead costs to the different products using direct labor cost, a unit-based cost driver. We may be doing more allocation than tracing. If so, then we probably don't have a very good idea of our actual product costs. Also, as you know, with the way computer technology has changed over time, it is easier and cheaper to collect and use detailed information-information that will allow us to assign costs more accurately."
Bryce: "This may be something we should explore. Jacob, what do you suggest?"
Jacob: "If we want more accurate product costs and if we really want to get in the cost reduction business, then we need to understand how costs behave. In particular, we need to understand activity cost behavior. Knowing what activities we perform, why we perform them, and how well we perform them will help us identify areas for improvement. We also need to know how the different products consume activity resources. What this boils down to is the need to use an activity-based management system. But before we jump into this, we need some idea of whether non-unit-based drivers add anything. Activity-based management is not an inexpensive undertaking. So I suggest that we do a preliminary study to see if direct labor cost is adequate for tracing. If not, then maybe some non-unit-drivers might be needed. In fact, if you would like,
I can gather some data that will provide some evidence on the usefulness of the activity-based approach."
Bryce: "What do you think, Kim? It's your division."
Kim: "What Jacob has said sounds promising. I think he should pursue it and do so quickly. I also think that we need to look at improving our quality. It sounds like we have a problem there. If quality could be improved, then our costs will drop. I'll talk to our quality people. Jacob, in the meantime, find out for us if moving to an activity-based system is the way to go. How much time do you need?"
Jacob: "I have already been gathering data. I could probably have a report within two weeks."
Based on my initial analysis, I am confident that an ABC system will offer significant improvement. For one of our conventional phone plants, I regressed total monthly overhead cost on monthly direct labor cost using the following 15 months of data:
The results were revealing. Although direct labor cost appears to be a driver of overhead cost, it really doesn't explain a lot of the variation. I then searched for other drivers-particularly non-unit drivers-that might offer more insight into overhead cost behavior. Every time a batch is produced, material movement occurs, regardless of the size of the batch. The number of moves seemed like a more logical driver. I was able to gather only 10 months of data for this. (Our information system doesn't provide the number of moves, so I had to build the data set by interviewing production personnel.) This information is provided next:
The regression results were impressive. There is no question in my mind that the number of moves is a good driver of materials-handling costs. Using the number of moves to assign materials-handling costs to products would likely be better than the cost assignment using direct labor cost. Furthermore, since small batches use the same number of moves as large batches, we have some evidence that we may be overcosting our high-volume products.
I looked at one more overhead activity: inspecting products. We have 15 inspectors who are paid an average of $4,000 per month. Each inspector offers about 160 hours of inspection capacity per month. However, it appears that they actually work only about 80 percent of those hours. The drop in demand we have experienced explains this idle time. I see no evidence of variable cost behavior here. I'm not exactly sure how to treat inspection cost, but I think that it is more related to inspection hours than direct labor cost. Some of the other overhead activities seem to be non-unit-level, as well-enough, in fact, to be concerned about how we assign costs.
After receiving the memo, Kim was intrigued. She then asked Jacob to use the same phone plant as a pilot for a preliminary ABC analysis. She instructed him to assign all overhead costs to the plant's two products (Regular and Deluxe models), using only four activities. The four activities were rework, moving materials, inspecting products, and a general catch-all activity labeled "other manufacturing activities." From the special study already performed, she knew that materials handling and inspecting involved significant cost; from production reports, she also knew that the rework activity involved significant cost. If the ABC and unit-based cost assignments did not differ by breaking out these three major activities, then ABC may not matter.
Pursuant to the request, Jacob produced the following cost and driver information:
Expected activity demands:
Required
The Phone Division has been using the same cost accounting system for over 10 years. Explain why its cost accounting system may be outmoded. What factors determine when a new cost accounting system is warranted?
Unlock Deck
Unlock for access to all 33 flashcards in this deck.
Unlock Deck
k this deck
23
Beauville Furniture Corporation produces sofas, recliners, and lounge chairs. Beauville is located in a medium-sized community in the southeastern part of the United States. It is a major employer in the community. In fact, the economic well-being of the community is tied very strongly to Beauville. Beauville operates a sawmill, a fabric plant, and a furniture plant in the same community.
The sawmill buys logs from independent producers. The sawmill then processes the logs into four grades of lumber: firsts and seconds, No. 1 common, No. 2 common, and No. 3 common. All costs incurred in the mill are common to the four grades of lumber. All four grades of lumber are used by the furniture plant. The mill transfers everything it produces to the furniture plant, and the grades are transferred at cost. Trucks are used to move the lumber from the mill to the furniture plant. Although no outside sales exist, the mill could sell to external customers, and the selling prices of the four grades are known.
The fabric plant is responsible for producing the fabric that is used by the furniture plant. To produce three totally different fabrics (identified by fabric ID codes FB60, FB70, and FB80, respectively), the plant has three separate production operations-one for each fabric. Thus, production of all three fabrics occurs at the same time in different locations in the plant. Each fabric's production operation has two processes: the weaving and pattern process and the coloring and bolting process. In the weaving and pattern process, yarn is used to create yards of fabric with different designs. In the next process, the fabric is dyed, cut into 25-yard sections, and wrapped around cardboard rods to form 25-yard bolts. The bolts are transported by forklift to the furniture plant's Receiving Department. All of the output of the fabric plant is used by the furniture plant (to produce the sofas and chairs). For accounting purposes, the fabric is transferred at cost to the furniture plant.
The furniture plant produces orders for customers on a special-order basis. The customers specify the quantity, style, fabric, lumber grade, and pattern. Typically, jobs are large (involving at least 500 units). The plant has two production departments: Cutting and Assembly. In the Cutting Department, the fabric and wooden frame components are sized and cut. Other components are purchased from external suppliers and are removed from stores as needed for assembly. After the fabric and wooden components are finished for the entire job, they are moved to the Assembly Department. The Assembly Department takes the individual components and assembles the sofas (or chairs).
Beauville Furniture has been in business for over two decades and has a good reputation. However, during the past five years, Beauville experienced eroding profits and declining sales. Bids were increasingly lost (even aggressive bids) on the more popular models. Yet, the company was winning bids on some of the more-difficult-to-produce items. Lance Hays, the owner and manager, was frustrated. He simply couldn't understand how some of his competitors could sell for such low prices. On a common sofa job involving 500 units, Beauville's bids were running $25 per unit, or $12,500 per job more than the winning bids (on average). Yet, on the more difficult items, Beauville's bids were running about $60 per unit less than the next closest bid. Gisela Berling, vice president of finance, was assigned the task of preparing a cost analysis of the company's product lines. Lance wanted to know if the company's costs were excessive. Perhaps the company was being wasteful, and it was simply costing more to produce furniture than it was costing its competitors.
Gisela prepared herself by reading recent literature on cost management and product costing and attending several conferences that explored the same issues. She then reviewed the costing procedures of the company's mill and two plants and did a preliminary assessment of their soundness. The production costs of the mill were common to all lumber grades and were assigned using the physical units method. Since the output and production costs were fairly uniform throughout the year, the mill used an actual costing system. Although Gisela had no difficulty with actual costing, she decided to explore the effects of using the sales-value-at-split-off method. Thus, cost and production data for the mill were gathered so that an analysis could be conducted. The two plants used normal costing systems. The fabric plant used process costing, and the furniture plant used job-order costing. Both plants used plantwide overhead rates based on direct labor hours. Based on her initial reviews, she concluded that the costing procedures for the fabric plant were satisfactory. Essentially, there was no evidence of product diversity. A statistical analysis revealed that about 90 percent of the variability in the plant's overhead cost could be explained by direct labor hours. Thus, the use of a plantwide overhead rate based on direct labor hours seemed justified. What did concern her, though, was the material waste that she observed in the plant. Maybe a standard cost system would be useful for increasing the overall cost efficiency of the plant. Consequently, as part of her report to Lance, she decided to include a description of the fabric plant's costing procedures-at least for one of the fabric types. She also decided to develop a standard cost sheet for the chosen fabric. The furniture plant, however, was a more difficult matter. Product diversity was present and could be causing some distortions in product costs. Furthermore, statistical analysis revealed that only about 40 percent of the variability in overhead cost was explained by the direct labor hours. She decided that additional analysis was needed so that a sound product costing method could be recommended. One possibility would be to increase the number of overhead rates. Thus, she decided to include departmental data so that the effect of moving to departmental rates could be assessed. Finally, she also wanted to explore the possibility of converting the sawmill and fabric plant into profit centers and changing the existing transfer pricing policy.
With the cooperation of the cost accounting manager for the mill and each plant's controller, she gathered the following data for last year:
Sawmill:
Joint manufacturing costs: $900,000
Fabric Plant:
Budgeted overhead: $1,200,000 (50% fixed)
Practical volume (direct labor hours): 120,000 hours
Actual overhead: $1,150,000 (50% fixed)
Actual hours worked:
Departmental data on Fabric FB70 (actual costs and actual outcomes):
*Unitsare measured in yards for the Weaving and Pattern Department and in bolts forthe Coloring and Bolting Department. Note: With the exception of the cardboard bolt rods, materials are added at the beginning of each process. The cost of the rods is relatively insignificant and is included in overhead.
Proposed standard cost sheet for Fabric FB70 (for the Coloring and Bolting Department only):
Furniture Plant:
Departmental data (budgeted):
After some discussion with the furniture plant controller, Gisela decided to use machine hours to calculate the overhead rate for the Cutting Department and direct labor hours for the Assembly Department rate (the Cutting Department was more automated than the Assembly Department). As part of her report, she wanted to compare the effects of plantwide rates and departmental rates on the cost of jobs. She wanted to know if overhead costing could be the source of the pricing problems the company was experiencing.
To assess the effect of the different overhead assignment procedures, Gisela decided to examine two prospective jobs. One job, Job A500, could produce 500 sofas, using a frequently requested style and Fabric FB70. Bids on this type of job were being lost more frequently to competitors. The second job, Job B75, would produce 75 specially designed recliners. This job involved a new design and was more difficult for the workers to build. It involved some special cutting requirements and an unfamiliar assembly. Recently, the company seemed to be winning more bids on jobs of this type. To compute the costs of the two jobs, Gisela assembled the following information on the two jobs:
Job A500:
Job B75:
Required
Suppose that the fabric plant is set up as a profit center. Bolts of Fabric FB70 sell for $400 (or can be bought for $400 from outside suppliers). The fabric plant and the furniture plant both have excess capacity. Assume that Job A500 is a special order. The fabric and furniture plants have sufficient excess capacity to satisfy the demands of Job A500. What is the minimum transfer price for a bolt of FB70? If the maximum transfer price is $400, by how much do the fabric plant's profits increase if the two profit centers negotiate a transfer price that splits the joint benefit?
Unlock Deck
Unlock for access to all 33 flashcards in this deck.
Unlock Deck
k this deck
24
CableTech Bell Corporation (CTB) operates in the telecommunications industry. CTB has two divisions: the Phone Division and the Cable Service Division. The Phone Division manufactures telephones in several plants located in the Midwest. The product lines run from relatively inexpensive touch-tone wall and desk phones to expensive, high-quality cellular phones. CTB also operates a cable TV service in Ohio. The Cable Service Division offers three products: a basic package with 25 channels; an enhanced package, which is the basic package plus 15 additional channels and two movie channels; and a premium package, which is the basic package plus 25 additional channels and three movie channels.
The Cable Service Division reported the following activity for the month of March:
The unit costs are divided as follows: 70 percent production and 30 percent marketing and customer service. Direct labor cost is the only driver used for tracing. Typically, the division uses only production costs to define unit costs. The preceding unit product cost information was provided at the request of the marketing manager and was the result of a special study.
Bryce Youngers, the president of CTB, is reasonably satisfied with the performance of the Cable Service Division. March's performance is fairly typical of what has been happening over the past two years. The Phone Division, however, is another matter. Its overall profit performance has been declining. Two years ago, income before income taxes had been about 25 percent of sales. March's dismal performance was also typical for what has been happening this year and is expected to continue-unless some action by management is taken to reverse the trend. During March, the Phone Division reported the following results:
During March, the Phone Division purchased materials totaling $312,000. There are no significant inventories of supplies (beginning or ending). Supplies are accounted for separately from materials. CTB's Phone Division had sales totaling $1,170,000 for March.
Based on March's results, Bryce decided to meet with three of the Phone Division's managers: Kim Breashears, divisional manager; Jacob Carder, divisional controller; and Larry Hartley, sales manager. A transcript of their recorded conversation is given next:
Bryce: "March's profit performance is down once again, and I think we need to see if we can identify the problem and correct it-before it's too late. Kim, what's your assessment of the situation?"
Kim: "Foreign competition is eating us alive. They are coming in with lower-priced phones of comparable or higher quality than our own. I've talked with several of the retailers that carry our lines, and they say the same. They are convinced that we can sell more if we lower our prices."
Larry: "They're right. If we could lower our prices by 10 to 15 percent, I think that we'd regain most ofour lost market share. But we also need to make sure that the quality of our products meets that of our competitors. As you know, we are spending a lot of money each month on rework and warranties. That worries me. I'd like to see that warranty cost cut by 70 to 80 percent. If we could do that, then customers would be more satisfied with our products, and I bet that we would not only regain our market share but increase it."
Jacob: "Lowering prices without lowering per-unit costs will not help us increase our profitability.
I think we need to improve our cost accounting system. I am not confident that we really know how much each of our product lines is costing us. It may be that we are overpricing some of our units because we are overcosting them. We may be underpricing other units."
Larry: "This sounds promising-especially if the overcosting is for some of our high-volume lines. A price decrease for these products would make the biggest difference-and if we knew they were overcosted, then we could offer immediate price reductions."
Bryce: "Jacob, I need more explanation. We have been using the same cost accounting system for the last 10 years. Why would it be a problem?"
Jacob: "I think that our manufacturing environment has changed. Over the years, we have added a lot of different product lines. Some of these products make very different demands on our manufacturing overhead resources. We trace-or attempt to trace-overhead costs to the different products using direct labor cost, a unit-based cost driver. We may be doing more allocation than tracing. If so, then we probably don't have a very good idea of our actual product costs. Also, as you know, with the way computer technology has changed over time, it is easier and cheaper to collect and use detailed information-information that will allow us to assign costs more accurately."
Bryce: "This may be something we should explore. Jacob, what do you suggest?"
Jacob: "If we want more accurate product costs and if we really want to get in the cost reduction business, then we need to understand how costs behave. In particular, we need to understand activity cost behavior. Knowing what activities we perform, why we perform them, and how well we perform them will help us identify areas for improvement. We also need to know how the different products consume activity resources. What this boils down to is the need to use an activity-based management system. But before we jump into this, we need some idea of whether non-unit-based drivers add anything. Activity-based management is not an inexpensive undertaking. So I suggest that we do a preliminary study to see if direct labor cost is adequate for tracing. If not, then maybe some non-unit-drivers might be needed. In fact, if you would like,
I can gather some data that will provide some evidence on the usefulness of the activity-based approach."
Bryce: "What do you think, Kim? It's your division."
Kim: "What Jacob has said sounds promising. I think he should pursue it and do so quickly. I also think that we need to look at improving our quality. It sounds like we have a problem there. If quality could be improved, then our costs will drop. I'll talk to our quality people. Jacob, in the meantime, find out for us if moving to an activity-based system is the way to go. How much time do you need?"
Jacob: "I have already been gathering data. I could probably have a report within two weeks."
Based on my initial analysis, I am confident that an ABC system will offer significant improvement. For one of our conventional phone plants, I regressed total monthly overhead cost on monthly direct labor cost using the following 15 months of data:
The results were revealing. Although direct labor cost appears to be a driver of overhead cost, it really doesn't explain a lot of the variation. I then searched for other drivers-particularly non-unit drivers-that might offer more insight into overhead cost behavior. Every time a batch is produced, material movement occurs, regardless of the size of the batch. The number of moves seemed like a more logical driver. I was able to gather only 10 months of data for this. (Our information system doesn't provide the number of moves, so I had to build the data set by interviewing production personnel.) This information is provided next:
The regression results were impressive. There is no question in my mind that the number of moves is a good driver of materials-handling costs. Using the number of moves to assign materials-handling costs to products would likely be better than the cost assignment using direct labor cost. Furthermore, since small batches use the same number of moves as large batches, we have some evidence that we may be overcosting our high-volume products.
I looked at one more overhead activity: inspecting products. We have 15 inspectors who are paid an average of $4,000 per month. Each inspector offers about 160 hours of inspection capacity per month. However, it appears that they actually work only about 80 percent of those hours. The drop in demand we have experienced explains this idle time. I see no evidence of variable cost behavior here. I'm not exactly sure how to treat inspection cost, but I think that it is more related to inspection hours than direct labor cost. Some of the other overhead activities seem to be non-unit-level, as well-enough, in fact, to be concerned about how we assign costs.
After receiving the memo, Kim was intrigued. She then asked Jacob to use the same phone plant as a pilot for a preliminary ABC analysis. She instructed him to assign all overhead costs to the plant's two products (Regular and Deluxe models), using only four activities. The four activities were rework, moving materials, inspecting products, and a general catch-all activity labeled "other manufacturing activities." From the special study already performed, she knew that materials handling and inspecting involved significant cost; from production reports, she also knew that the rework activity involved significant cost. If the ABC and unit-based cost assignments did not differ by breaking out these three major activities, then ABC may not matter.
Pursuant to the request, Jacob produced the following cost and driver information:
Expected activity demands:
Required
Using the method of least squares, calculate two cost formulas: one for overhead using direct labor cost as the driver, and one for materials handling cost using number of moves as the driver. Comment on Jacob Carder's observations concerning the outcomes.
Unlock Deck
Unlock for access to all 33 flashcards in this deck.
Unlock Deck
k this deck
25
Zando Pharmaceuticals is an affiliate of the German-based Heisenberg Corporation, which employs 40,000 worldwide. Zando's St. Louis facility houses the U.S. corporate headquarters and Research and Development (R D). It produces 30 products, using 28 different batch processes. The facility has 2,000 employees on-site. In recent years, Zando's profitability has suffered, which can be attributed to increased competition, customer dissatisfaction, and regulatory pressures. Luis Alvarado, president of Zando, called a meeting to consider ways to improve profitability. He labeled the meeting a strategic planning session and invited the following officers: Kathy Shorts, environmental manager; Troy Lewis, head of R D; Johnny Mizukawa, vice president of production and quality; Larry Sower, vice president of finance; and Doreen Savara, marketing vice president.
Luis : "You all have received the quarterly financial reports for the last two years. The trends are negative. We are losing market share, profits are decreasing, and our costs seem to be increasing. We need to take actions to increase sales and reduce costs, and we need to do so as quickly as possible. Given our research strengths, it seems to me that our best bet is to grow revenues by introducing new products with proprietary rights. As far as costs are concerned, we need to improve our performance on that dimension as well. Lower per-unit costs for new and existing products are needed. Any suggestions?"
Troy : "For our products, our ability to control costs resides in development-my area-rather than manufacturing. We probably need to pay more attention to product and process design issues to ensure a reasonably level per-unit cost. Revenues are also affected in this stage. Once we patent a drug, the clock begins to tick, and we need to reduce time to market. Significantly, reducing time to market will allow us to generate revenues for a longer period of time than we are currently experiencing. It would also be helpful if we could reduce the cycle time for product development. Both actions would increase revenues. Finally, we can increase revenues by increasing the volume of new products."
Johnny : "There is a lot of merit to the observation that cost reduction opportunities reside mostly in product development. Once a drug is approved, its approval includes the manufacturing process. Any future changes in the manufacturing process require approval from the U.S. Food and Drug Administration. Because of this, we have been reluctant, historically, to engage in process improvement or reengineering. However, I wonder if we shouldn't reconsider this longstanding policy. Some of the quality problems we have could be corrected by changing some of our existing processes, and the costs saved may easily exceed any cost incurred from seeking FDA approval. I think our quality costs are at least 15 percent of sales. That's a lot of opportunity for improvement."
Kathy : "I agree that cost reduction-both in the product development stage and the manufacturing stage-should be a key strategic theme. The environmental area also offers some very good opportunities. A recent pollution prevention act passed by the legislature requires that we calculate the costs of generating hazardous substances for each process. This act was the incentive we needed to begin developing an environmental cost management system. The results so far indicate that environmental costs are much more than we realized. They are estimated to be in the range of 20 to 30 percent of total operating costs. Environmental costs can be reduced by such things as computerizing chemical inventory, eliminating the use of chlorinated solvents and other hazardous materials, reducing our use of virgin feedstocks, and redesigning processes and products so that we can reduce toxic residue release. We can really have a positive environmental impact while simultaneously reducing costs if more attention is paid to environmental issues during product development."
Doreen : "I like what I am hearing because I think that it also affects our ability to increase market share and revenues. For example, environmental impact is one of our major concerns. Some retail pharmacy chains pay particular attention to green products, and right now we are not competing well. Our environmental image is negative and needs to be improved. I am convinced that doing so will allow us to increase market share. Quality is another important matter. We have had to recall two batches of products during the past two years due to poor quality, and this has hurt our image more than the environmental issue. Improving the processes to avoid these kinds of problems will save us a lot of grief. Product image and reputation are essential to increasing customer satisfaction and market share."
Luis : "We started with the need to improve financial performance by increasing revenues and reducing costs. So far, we have some very good suggestions to help achieve these two objectives, but I have some concerns. First, do we have the talent and capabilities to improve quality and environmental performance? Troy, do your professionals really understand what they need to do to improve process and product designs so that we can see the desired quality and environmental improvements? Also, how can we reduce the cycle time for products and the time to market once patented?"
Troy : "Let me answer those questions in order. First, we probably are lacking the understanding on the design issues. We will need to do some training to help our research scientists and chemical engineers understand the consequences. We may need to hire a couple of professionals who have experience in dealing with these issues. Second, we may need to make cycle time and time to market significant performance measures and reward our people for actions that reduce those measures. Our employees need to align their interests with those of the company. If we can achieve this, we should see more revenue produced per employee."
Luis : "Good. Now, Johnny, tell us about production and quality. Do our manufacturing engineers and production workers need help with environmental and quality issues?"
Johnny : "Without question, training will be needed. Moreover, I really need to hire a couple of quality engineers."
Kathy : "I also think that we need an environmental engineer with experience in pharmaceutical manufacturing processes."
Luis : "Good. We certainly shouldn't ignore the necessary infrastructure to bring about the needed changes. Larry, you have been relatively quiet, what do you think about all this? Do you have any suggestions?"
Larry : "Infrastructure is important. If this is all going to work, timely and accurate information will be needed. It is hard to design products and processes with cost being a significant issue without providing the right kind of cost information. We are in the process of revamping the cost management information system so that it is activity based and so that we can provide quality and environmental cost information. After listening to the comments made here, I might also suggest that we need a strategic measurement system that can be used to align the interests of our employees with our improvement strategy. People need to know what is important, that the important factors are being measured, and that they are going to be evaluated and rewarded based on these factors. Finally, I would encourage the use of target costing to help manage costs during product development. To help you all understand the importance of good information, I have assembled some activity data relating to two new products currently under development. These two products will use the same process, using different setups. The data are organized into resource, activity, and cost object modules with an accompanying list of activity drivers to facilitate the use of an ABC software package recently acquired by Zando."
Resource Module (Projected General Ledger Costs of Manufacturing Process Associated with the Two Products)
Activity Module
Cost Object Module (Products and Projected Activity Usage)
List of Activity Drivers
Required
Use the comments from the executive meeting to identify strategic objectives and possible performance measures for each of five perspectives: financial, customer, environmental, process, and learning and growth. Would you recommend the Balanced Scorecard for Zando? Why?
Unlock Deck
Unlock for access to all 33 flashcards in this deck.
Unlock Deck
k this deck
26
CableTech Bell Corporation (CTB) operates in the telecommunications industry. CTB has two divisions: the Phone Division and the Cable Service Division. The Phone Division manufactures telephones in several plants located in the Midwest. The product lines run from relatively inexpensive touch-tone wall and desk phones to expensive, high-quality cellular phones. CTB also operates a cable TV service in Ohio. The Cable Service Division offers three products: a basic package with 25 channels; an enhanced package, which is the basic package plus 15 additional channels and two movie channels; and a premium package, which is the basic package plus 25 additional channels and three movie channels.
The Cable Service Division reported the following activity for the month of March:
The unit costs are divided as follows: 70 percent production and 30 percent marketing and customer service. Direct labor cost is the only driver used for tracing. Typically, the division uses only production costs to define unit costs. The preceding unit product cost information was provided at the request of the marketing manager and was the result of a special study.
Bryce Youngers, the president of CTB, is reasonably satisfied with the performance of the Cable Service Division. March's performance is fairly typical of what has been happening over the past two years. The Phone Division, however, is another matter. Its overall profit performance has been declining. Two years ago, income before income taxes had been about 25 percent of sales. March's dismal performance was also typical for what has been happening this year and is expected to continue-unless some action by management is taken to reverse the trend. During March, the Phone Division reported the following results:
During March, the Phone Division purchased materials totaling $312,000. There are no significant inventories of supplies (beginning or ending). Supplies are accounted for separately from materials. CTB's Phone Division had sales totaling $1,170,000 for March.
Based on March's results, Bryce decided to meet with three of the Phone Division's managers: Kim Breashears, divisional manager; Jacob Carder, divisional controller; and Larry Hartley, sales manager. A transcript of their recorded conversation is given next:
Bryce: "March's profit performance is down once again, and I think we need to see if we can identify the problem and correct it-before it's too late. Kim, what's your assessment of the situation?"
Kim: "Foreign competition is eating us alive. They are coming in with lower-priced phones of comparable or higher quality than our own. I've talked with several of the retailers that carry our lines, and they say the same. They are convinced that we can sell more if we lower our prices."
Larry: "They're right. If we could lower our prices by 10 to 15 percent, I think that we'd regain most ofour lost market share. But we also need to make sure that the quality of our products meets that of our competitors. As you know, we are spending a lot of money each month on rework and warranties. That worries me. I'd like to see that warranty cost cut by 70 to 80 percent. If we could do that, then customers would be more satisfied with our products, and I bet that we would not only regain our market share but increase it."
Jacob: "Lowering prices without lowering per-unit costs will not help us increase our profitability.
I think we need to improve our cost accounting system. I am not confident that we really know how much each of our product lines is costing us. It may be that we are overpricing some of our units because we are overcosting them. We may be underpricing other units."
Larry: "This sounds promising-especially if the overcosting is for some of our high-volume lines. A price decrease for these products would make the biggest difference-and if we knew they were overcosted, then we could offer immediate price reductions."
Bryce: "Jacob, I need more explanation. We have been using the same cost accounting system for the last 10 years. Why would it be a problem?"
Jacob: "I think that our manufacturing environment has changed. Over the years, we have added a lot of different product lines. Some of these products make very different demands on our manufacturing overhead resources. We trace-or attempt to trace-overhead costs to the different products using direct labor cost, a unit-based cost driver. We may be doing more allocation than tracing. If so, then we probably don't have a very good idea of our actual product costs. Also, as you know, with the way computer technology has changed over time, it is easier and cheaper to collect and use detailed information-information that will allow us to assign costs more accurately."
Bryce: "This may be something we should explore. Jacob, what do you suggest?"
Jacob: "If we want more accurate product costs and if we really want to get in the cost reduction business, then we need to understand how costs behave. In particular, we need to understand activity cost behavior. Knowing what activities we perform, why we perform them, and how well we perform them will help us identify areas for improvement. We also need to know how the different products consume activity resources. What this boils down to is the need to use an activity-based management system. But before we jump into this, we need some idea of whether non-unit-based drivers add anything. Activity-based management is not an inexpensive undertaking. So I suggest that we do a preliminary study to see if direct labor cost is adequate for tracing. If not, then maybe some non-unit-drivers might be needed. In fact, if you would like,
I can gather some data that will provide some evidence on the usefulness of the activity-based approach."
Bryce: "What do you think, Kim? It's your division."
Kim: "What Jacob has said sounds promising. I think he should pursue it and do so quickly. I also think that we need to look at improving our quality. It sounds like we have a problem there. If quality could be improved, then our costs will drop. I'll talk to our quality people. Jacob, in the meantime, find out for us if moving to an activity-based system is the way to go. How much time do you need?"
Jacob: "I have already been gathering data. I could probably have a report within two weeks."
Based on my initial analysis, I am confident that an ABC system will offer significant improvement. For one of our conventional phone plants, I regressed total monthly overhead cost on monthly direct labor cost using the following 15 months of data:
The results were revealing. Although direct labor cost appears to be a driver of overhead cost, it really doesn't explain a lot of the variation. I then searched for other drivers-particularly non-unit drivers-that might offer more insight into overhead cost behavior. Every time a batch is produced, material movement occurs, regardless of the size of the batch. The number of moves seemed like a more logical driver. I was able to gather only 10 months of data for this. (Our information system doesn't provide the number of moves, so I had to build the data set by interviewing production personnel.) This information is provided next:
The regression results were impressive. There is no question in my mind that the number of moves is a good driver of materials-handling costs. Using the number of moves to assign materials-handling costs to products would likely be better than the cost assignment using direct labor cost. Furthermore, since small batches use the same number of moves as large batches, we have some evidence that we may be overcosting our high-volume products.
I looked at one more overhead activity: inspecting products. We have 15 inspectors who are paid an average of $4,000 per month. Each inspector offers about 160 hours of inspection capacity per month. However, it appears that they actually work only about 80 percent of those hours. The drop in demand we have experienced explains this idle time. I see no evidence of variable cost behavior here. I'm not exactly sure how to treat inspection cost, but I think that it is more related to inspection hours than direct labor cost. Some of the other overhead activities seem to be non-unit-level, as well-enough, in fact, to be concerned about how we assign costs.
After receiving the memo, Kim was intrigued. She then asked Jacob to use the same phone plant as a pilot for a preliminary ABC analysis. She instructed him to assign all overhead costs to the plant's two products (Regular and Deluxe models), using only four activities. The four activities were rework, moving materials, inspecting products, and a general catch-all activity labeled "other manufacturing activities." From the special study already performed, she knew that materials handling and inspecting involved significant cost; from production reports, she also knew that the rework activity involved significant cost. If the ABC and unit-based cost assignments did not differ by breaking out these three major activities, then ABC may not matter.
Pursuant to the request, Jacob produced the following cost and driver information:
Expected activity demands:
Required
How would you describe the cost behavior of the inspection activity? Assume that the quality control manager implements a program that reduces the number of defective units by 50 percent. Because of the improved quality, the demand for inspection hours will also drop by 50 percent. What is the potential monthly reduction in inspection costs? How did knowledge of inspection's cost behavior help?
Unlock Deck
Unlock for access to all 33 flashcards in this deck.
Unlock Deck
k this deck
27
Zando Pharmaceuticals is an affiliate of the German-based Heisenberg Corporation, which employs 40,000 worldwide. Zando's St. Louis facility houses the U.S. corporate headquarters and Research and Development (R D). It produces 30 products, using 28 different batch processes. The facility has 2,000 employees on-site. In recent years, Zando's profitability has suffered, which can be attributed to increased competition, customer dissatisfaction, and regulatory pressures. Luis Alvarado, president of Zando, called a meeting to consider ways to improve profitability. He labeled the meeting a strategic planning session and invited the following officers: Kathy Shorts, environmental manager; Troy Lewis, head of R D; Johnny Mizukawa, vice president of production and quality; Larry Sower, vice president of finance; and Doreen Savara, marketing vice president.
Luis : "You all have received the quarterly financial reports for the last two years. The trends are negative. We are losing market share, profits are decreasing, and our costs seem to be increasing. We need to take actions to increase sales and reduce costs, and we need to do so as quickly as possible. Given our research strengths, it seems to me that our best bet is to grow revenues by introducing new products with proprietary rights. As far as costs are concerned, we need to improve our performance on that dimension as well. Lower per-unit costs for new and existing products are needed. Any suggestions?"
Troy : "For our products, our ability to control costs resides in development-my area-rather than manufacturing. We probably need to pay more attention to product and process design issues to ensure a reasonably level per-unit cost. Revenues are also affected in this stage. Once we patent a drug, the clock begins to tick, and we need to reduce time to market. Significantly, reducing time to market will allow us to generate revenues for a longer period of time than we are currently experiencing. It would also be helpful if we could reduce the cycle time for product development. Both actions would increase revenues. Finally, we can increase revenues by increasing the volume of new products."
Johnny : "There is a lot of merit to the observation that cost reduction opportunities reside mostly in product development. Once a drug is approved, its approval includes the manufacturing process. Any future changes in the manufacturing process require approval from the U.S. Food and Drug Administration. Because of this, we have been reluctant, historically, to engage in process improvement or reengineering. However, I wonder if we shouldn't reconsider this longstanding policy. Some of the quality problems we have could be corrected by changing some of our existing processes, and the costs saved may easily exceed any cost incurred from seeking FDA approval. I think our quality costs are at least 15 percent of sales. That's a lot of opportunity for improvement."
Kathy : "I agree that cost reduction-both in the product development stage and the manufacturing stage-should be a key strategic theme. The environmental area also offers some very good opportunities. A recent pollution prevention act passed by the legislature requires that we calculate the costs of generating hazardous substances for each process. This act was the incentive we needed to begin developing an environmental cost management system. The results so far indicate that environmental costs are much more than we realized. They are estimated to be in the range of 20 to 30 percent of total operating costs. Environmental costs can be reduced by such things as computerizing chemical inventory, eliminating the use of chlorinated solvents and other hazardous materials, reducing our use of virgin feedstocks, and redesigning processes and products so that we can reduce toxic residue release. We can really have a positive environmental impact while simultaneously reducing costs if more attention is paid to environmental issues during product development."
Doreen : "I like what I am hearing because I think that it also affects our ability to increase market share and revenues. For example, environmental impact is one of our major concerns. Some retail pharmacy chains pay particular attention to green products, and right now we are not competing well. Our environmental image is negative and needs to be improved. I am convinced that doing so will allow us to increase market share. Quality is another important matter. We have had to recall two batches of products during the past two years due to poor quality, and this has hurt our image more than the environmental issue. Improving the processes to avoid these kinds of problems will save us a lot of grief. Product image and reputation are essential to increasing customer satisfaction and market share."
Luis : "We started with the need to improve financial performance by increasing revenues and reducing costs. So far, we have some very good suggestions to help achieve these two objectives, but I have some concerns. First, do we have the talent and capabilities to improve quality and environmental performance? Troy, do your professionals really understand what they need to do to improve process and product designs so that we can see the desired quality and environmental improvements? Also, how can we reduce the cycle time for products and the time to market once patented?"
Troy : "Let me answer those questions in order. First, we probably are lacking the understanding on the design issues. We will need to do some training to help our research scientists and chemical engineers understand the consequences. We may need to hire a couple of professionals who have experience in dealing with these issues. Second, we may need to make cycle time and time to market significant performance measures and reward our people for actions that reduce those measures. Our employees need to align their interests with those of the company. If we can achieve this, we should see more revenue produced per employee."
Luis : "Good. Now, Johnny, tell us about production and quality. Do our manufacturing engineers and production workers need help with environmental and quality issues?"
Johnny : "Without question, training will be needed. Moreover, I really need to hire a couple of quality engineers."
Kathy : "I also think that we need an environmental engineer with experience in pharmaceutical manufacturing processes."
Luis : "Good. We certainly shouldn't ignore the necessary infrastructure to bring about the needed changes. Larry, you have been relatively quiet, what do you think about all this? Do you have any suggestions?"
Larry : "Infrastructure is important. If this is all going to work, timely and accurate information will be needed. It is hard to design products and processes with cost being a significant issue without providing the right kind of cost information. We are in the process of revamping the cost management information system so that it is activity based and so that we can provide quality and environmental cost information. After listening to the comments made here, I might also suggest that we need a strategic measurement system that can be used to align the interests of our employees with our improvement strategy. People need to know what is important, that the important factors are being measured, and that they are going to be evaluated and rewarded based on these factors. Finally, I would encourage the use of target costing to help manage costs during product development. To help you all understand the importance of good information, I have assembled some activity data relating to two new products currently under development. These two products will use the same process, using different setups. The data are organized into resource, activity, and cost object modules with an accompanying list of activity drivers to facilitate the use of an ABC software package recently acquired by Zando."
Resource Module (Projected General Ledger Costs of Manufacturing Process Associated with the Two Products)
Activity Module
Cost Object Module (Products and Projected Activity Usage)
List of Activity Drivers
Required
Suppose that Doreen suggested gainsharing in response to Troy's suggestion to reward product development employees for improving cycle time and time to market. What is gainsharing? How could it be used in the product development setting?
Unlock Deck
Unlock for access to all 33 flashcards in this deck.
Unlock Deck
k this deck
28
CableTech Bell Corporation (CTB) operates in the telecommunications industry. CTB has two divisions: the Phone Division and the Cable Service Division. The Phone Division manufactures telephones in several plants located in the Midwest. The product lines run from relatively inexpensive touch-tone wall and desk phones to expensive, high-quality cellular phones. CTB also operates a cable TV service in Ohio. The Cable Service Division offers three products: a basic package with 25 channels; an enhanced package, which is the basic package plus 15 additional channels and two movie channels; and a premium package, which is the basic package plus 25 additional channels and three movie channels.
The Cable Service Division reported the following activity for the month of March:
The unit costs are divided as follows: 70 percent production and 30 percent marketing and customer service. Direct labor cost is the only driver used for tracing. Typically, the division uses only production costs to define unit costs. The preceding unit product cost information was provided at the request of the marketing manager and was the result of a special study.
Bryce Youngers, the president of CTB, is reasonably satisfied with the performance of the Cable Service Division. March's performance is fairly typical of what has been happening over the past two years. The Phone Division, however, is another matter. Its overall profit performance has been declining. Two years ago, income before income taxes had been about 25 percent of sales. March's dismal performance was also typical for what has been happening this year and is expected to continue-unless some action by management is taken to reverse the trend. During March, the Phone Division reported the following results:
During March, the Phone Division purchased materials totaling $312,000. There are no significant inventories of supplies (beginning or ending). Supplies are accounted for separately from materials. CTB's Phone Division had sales totaling $1,170,000 for March.
Based on March's results, Bryce decided to meet with three of the Phone Division's managers: Kim Breashears, divisional manager; Jacob Carder, divisional controller; and Larry Hartley, sales manager. A transcript of their recorded conversation is given next:
Bryce: "March's profit performance is down once again, and I think we need to see if we can identify the problem and correct it-before it's too late. Kim, what's your assessment of the situation?"
Kim: "Foreign competition is eating us alive. They are coming in with lower-priced phones of comparable or higher quality than our own. I've talked with several of the retailers that carry our lines, and they say the same. They are convinced that we can sell more if we lower our prices."
Larry: "They're right. If we could lower our prices by 10 to 15 percent, I think that we'd regain most ofour lost market share. But we also need to make sure that the quality of our products meets that of our competitors. As you know, we are spending a lot of money each month on rework and warranties. That worries me. I'd like to see that warranty cost cut by 70 to 80 percent. If we could do that, then customers would be more satisfied with our products, and I bet that we would not only regain our market share but increase it."
Jacob: "Lowering prices without lowering per-unit costs will not help us increase our profitability.
I think we need to improve our cost accounting system. I am not confident that we really know how much each of our product lines is costing us. It may be that we are overpricing some of our units because we are overcosting them. We may be underpricing other units."
Larry: "This sounds promising-especially if the overcosting is for some of our high-volume lines. A price decrease for these products would make the biggest difference-and if we knew they were overcosted, then we could offer immediate price reductions."
Bryce: "Jacob, I need more explanation. We have been using the same cost accounting system for the last 10 years. Why would it be a problem?"
Jacob: "I think that our manufacturing environment has changed. Over the years, we have added a lot of different product lines. Some of these products make very different demands on our manufacturing overhead resources. We trace-or attempt to trace-overhead costs to the different products using direct labor cost, a unit-based cost driver. We may be doing more allocation than tracing. If so, then we probably don't have a very good idea of our actual product costs. Also, as you know, with the way computer technology has changed over time, it is easier and cheaper to collect and use detailed information-information that will allow us to assign costs more accurately."
Bryce: "This may be something we should explore. Jacob, what do you suggest?"
Jacob: "If we want more accurate product costs and if we really want to get in the cost reduction business, then we need to understand how costs behave. In particular, we need to understand activity cost behavior. Knowing what activities we perform, why we perform them, and how well we perform them will help us identify areas for improvement. We also need to know how the different products consume activity resources. What this boils down to is the need to use an activity-based management system. But before we jump into this, we need some idea of whether non-unit-based drivers add anything. Activity-based management is not an inexpensive undertaking. So I suggest that we do a preliminary study to see if direct labor cost is adequate for tracing. If not, then maybe some non-unit-drivers might be needed. In fact, if you would like,
I can gather some data that will provide some evidence on the usefulness of the activity-based approach."
Bryce: "What do you think, Kim? It's your division."
Kim: "What Jacob has said sounds promising. I think he should pursue it and do so quickly. I also think that we need to look at improving our quality. It sounds like we have a problem there. If quality could be improved, then our costs will drop. I'll talk to our quality people. Jacob, in the meantime, find out for us if moving to an activity-based system is the way to go. How much time do you need?"
Jacob: "I have already been gathering data. I could probably have a report within two weeks."
Based on my initial analysis, I am confident that an ABC system will offer significant improvement. For one of our conventional phone plants, I regressed total monthly overhead cost on monthly direct labor cost using the following 15 months of data:
The results were revealing. Although direct labor cost appears to be a driver of overhead cost, it really doesn't explain a lot of the variation. I then searched for other drivers-particularly non-unit drivers-that might offer more insight into overhead cost behavior. Every time a batch is produced, material movement occurs, regardless of the size of the batch. The number of moves seemed like a more logical driver. I was able to gather only 10 months of data for this. (Our information system doesn't provide the number of moves, so I had to build the data set by interviewing production personnel.) This information is provided next:
The regression results were impressive. There is no question in my mind that the number of moves is a good driver of materials-handling costs. Using the number of moves to assign materials-handling costs to products would likely be better than the cost assignment using direct labor cost. Furthermore, since small batches use the same number of moves as large batches, we have some evidence that we may be overcosting our high-volume products.
I looked at one more overhead activity: inspecting products. We have 15 inspectors who are paid an average of $4,000 per month. Each inspector offers about 160 hours of inspection capacity per month. However, it appears that they actually work only about 80 percent of those hours. The drop in demand we have experienced explains this idle time. I see no evidence of variable cost behavior here. I'm not exactly sure how to treat inspection cost, but I think that it is more related to inspection hours than direct labor cost. Some of the other overhead activities seem to be non-unit-level, as well-enough, in fact, to be concerned about how we assign costs.
After receiving the memo, Kim was intrigued. She then asked Jacob to use the same phone plant as a pilot for a preliminary ABC analysis. She instructed him to assign all overhead costs to the plant's two products (Regular and Deluxe models), using only four activities. The four activities were rework, moving materials, inspecting products, and a general catch-all activity labeled "other manufacturing activities." From the special study already performed, she knew that materials handling and inspecting involved significant cost; from production reports, she also knew that the rework activity involved significant cost. If the ABC and unit-based cost assignments did not differ by breaking out these three major activities, then ABC may not matter.
Pursuant to the request, Jacob produced the following cost and driver information:
Expected activity demands:
Required
Calulate the overhead cost per unit for each phone model using direct labor cost to assign all overhead costs to products.
Unlock Deck
Unlock for access to all 33 flashcards in this deck.
Unlock Deck
k this deck
29
Zando Pharmaceuticals is an affiliate of the German-based Heisenberg Corporation, which employs 40,000 worldwide. Zando's St. Louis facility houses the U.S. corporate headquarters and Research and Development (R D). It produces 30 products, using 28 different batch processes. The facility has 2,000 employees on-site. In recent years, Zando's profitability has suffered, which can be attributed to increased competition, customer dissatisfaction, and regulatory pressures. Luis Alvarado, president of Zando, called a meeting to consider ways to improve profitability. He labeled the meeting a strategic planning session and invited the following officers: Kathy Shorts, environmental manager; Troy Lewis, head of R D; Johnny Mizukawa, vice president of production and quality; Larry Sower, vice president of finance; and Doreen Savara, marketing vice president.
Luis : "You all have received the quarterly financial reports for the last two years. The trends are negative. We are losing market share, profits are decreasing, and our costs seem to be increasing. We need to take actions to increase sales and reduce costs, and we need to do so as quickly as possible. Given our research strengths, it seems to me that our best bet is to grow revenues by introducing new products with proprietary rights. As far as costs are concerned, we need to improve our performance on that dimension as well. Lower per-unit costs for new and existing products are needed. Any suggestions?"
Troy : "For our products, our ability to control costs resides in development-my area-rather than manufacturing. We probably need to pay more attention to product and process design issues to ensure a reasonably level per-unit cost. Revenues are also affected in this stage. Once we patent a drug, the clock begins to tick, and we need to reduce time to market. Significantly, reducing time to market will allow us to generate revenues for a longer period of time than we are currently experiencing. It would also be helpful if we could reduce the cycle time for product development. Both actions would increase revenues. Finally, we can increase revenues by increasing the volume of new products."
Johnny : "There is a lot of merit to the observation that cost reduction opportunities reside mostly in product development. Once a drug is approved, its approval includes the manufacturing process. Any future changes in the manufacturing process require approval from the U.S. Food and Drug Administration. Because of this, we have been reluctant, historically, to engage in process improvement or reengineering. However, I wonder if we shouldn't reconsider this longstanding policy. Some of the quality problems we have could be corrected by changing some of our existing processes, and the costs saved may easily exceed any cost incurred from seeking FDA approval. I think our quality costs are at least 15 percent of sales. That's a lot of opportunity for improvement."
Kathy : "I agree that cost reduction-both in the product development stage and the manufacturing stage-should be a key strategic theme. The environmental area also offers some very good opportunities. A recent pollution prevention act passed by the legislature requires that we calculate the costs of generating hazardous substances for each process. This act was the incentive we needed to begin developing an environmental cost management system. The results so far indicate that environmental costs are much more than we realized. They are estimated to be in the range of 20 to 30 percent of total operating costs. Environmental costs can be reduced by such things as computerizing chemical inventory, eliminating the use of chlorinated solvents and other hazardous materials, reducing our use of virgin feedstocks, and redesigning processes and products so that we can reduce toxic residue release. We can really have a positive environmental impact while simultaneously reducing costs if more attention is paid to environmental issues during product development."
Doreen : "I like what I am hearing because I think that it also affects our ability to increase market share and revenues. For example, environmental impact is one of our major concerns. Some retail pharmacy chains pay particular attention to green products, and right now we are not competing well. Our environmental image is negative and needs to be improved. I am convinced that doing so will allow us to increase market share. Quality is another important matter. We have had to recall two batches of products during the past two years due to poor quality, and this has hurt our image more than the environmental issue. Improving the processes to avoid these kinds of problems will save us a lot of grief. Product image and reputation are essential to increasing customer satisfaction and market share."
Luis : "We started with the need to improve financial performance by increasing revenues and reducing costs. So far, we have some very good suggestions to help achieve these two objectives, but I have some concerns. First, do we have the talent and capabilities to improve quality and environmental performance? Troy, do your professionals really understand what they need to do to improve process and product designs so that we can see the desired quality and environmental improvements? Also, how can we reduce the cycle time for products and the time to market once patented?"
Troy : "Let me answer those questions in order. First, we probably are lacking the understanding on the design issues. We will need to do some training to help our research scientists and chemical engineers understand the consequences. We may need to hire a couple of professionals who have experience in dealing with these issues. Second, we may need to make cycle time and time to market significant performance measures and reward our people for actions that reduce those measures. Our employees need to align their interests with those of the company. If we can achieve this, we should see more revenue produced per employee."
Luis : "Good. Now, Johnny, tell us about production and quality. Do our manufacturing engineers and production workers need help with environmental and quality issues?"
Johnny : "Without question, training will be needed. Moreover, I really need to hire a couple of quality engineers."
Kathy : "I also think that we need an environmental engineer with experience in pharmaceutical manufacturing processes."
Luis : "Good. We certainly shouldn't ignore the necessary infrastructure to bring about the needed changes. Larry, you have been relatively quiet, what do you think about all this? Do you have any suggestions?"
Larry : "Infrastructure is important. If this is all going to work, timely and accurate information will be needed. It is hard to design products and processes with cost being a significant issue without providing the right kind of cost information. We are in the process of revamping the cost management information system so that it is activity based and so that we can provide quality and environmental cost information. After listening to the comments made here, I might also suggest that we need a strategic measurement system that can be used to align the interests of our employees with our improvement strategy. People need to know what is important, that the important factors are being measured, and that they are going to be evaluated and rewarded based on these factors. Finally, I would encourage the use of target costing to help manage costs during product development. To help you all understand the importance of good information, I have assembled some activity data relating to two new products currently under development. These two products will use the same process, using different setups. The data are organized into resource, activity, and cost object modules with an accompanying list of activity drivers to facilitate the use of an ABC software package recently acquired by Zando."
Resource Module (Projected General Ledger Costs of Manufacturing Process Associated with the Two Products)
Activity Module
Cost Object Module (Products and Projected Activity Usage)
List of Activity Drivers
Required
Determine the cost of all activities for the proposed new process. Now, assign the cost of the secondary activity to the primary activities.
Unlock Deck
Unlock for access to all 33 flashcards in this deck.
Unlock Deck
k this deck
30
CableTech Bell Corporation (CTB) operates in the telecommunications industry. CTB has two divisions: the Phone Division and the Cable Service Division. The Phone Division manufactures telephones in several plants located in the Midwest. The product lines run from relatively inexpensive touch-tone wall and desk phones to expensive, high-quality cellular phones. CTB also operates a cable TV service in Ohio. The Cable Service Division offers three products: a basic package with 25 channels; an enhanced package, which is the basic package plus 15 additional channels and two movie channels; and a premium package, which is the basic package plus 25 additional channels and three movie channels.
The Cable Service Division reported the following activity for the month of March:
The unit costs are divided as follows: 70 percent production and 30 percent marketing and customer service. Direct labor cost is the only driver used for tracing. Typically, the division uses only production costs to define unit costs. The preceding unit product cost information was provided at the request of the marketing manager and was the result of a special study.
Bryce Youngers, the president of CTB, is reasonably satisfied with the performance of the Cable Service Division. March's performance is fairly typical of what has been happening over the past two years. The Phone Division, however, is another matter. Its overall profit performance has been declining. Two years ago, income before income taxes had been about 25 percent of sales. March's dismal performance was also typical for what has been happening this year and is expected to continue-unless some action by management is taken to reverse the trend. During March, the Phone Division reported the following results:
During March, the Phone Division purchased materials totaling $312,000. There are no significant inventories of supplies (beginning or ending). Supplies are accounted for separately from materials. CTB's Phone Division had sales totaling $1,170,000 for March.
Based on March's results, Bryce decided to meet with three of the Phone Division's managers: Kim Breashears, divisional manager; Jacob Carder, divisional controller; and Larry Hartley, sales manager. A transcript of their recorded conversation is given next:
Bryce: "March's profit performance is down once again, and I think we need to see if we can identify the problem and correct it-before it's too late. Kim, what's your assessment of the situation?"
Kim: "Foreign competition is eating us alive. They are coming in with lower-priced phones of comparable or higher quality than our own. I've talked with several of the retailers that carry our lines, and they say the same. They are convinced that we can sell more if we lower our prices."
Larry: "They're right. If we could lower our prices by 10 to 15 percent, I think that we'd regain most ofour lost market share. But we also need to make sure that the quality of our products meets that of our competitors. As you know, we are spending a lot of money each month on rework and warranties. That worries me. I'd like to see that warranty cost cut by 70 to 80 percent. If we could do that, then customers would be more satisfied with our products, and I bet that we would not only regain our market share but increase it."
Jacob: "Lowering prices without lowering per-unit costs will not help us increase our profitability.
I think we need to improve our cost accounting system. I am not confident that we really know how much each of our product lines is costing us. It may be that we are overpricing some of our units because we are overcosting them. We may be underpricing other units."
Larry: "This sounds promising-especially if the overcosting is for some of our high-volume lines. A price decrease for these products would make the biggest difference-and if we knew they were overcosted, then we could offer immediate price reductions."
Bryce: "Jacob, I need more explanation. We have been using the same cost accounting system for the last 10 years. Why would it be a problem?"
Jacob: "I think that our manufacturing environment has changed. Over the years, we have added a lot of different product lines. Some of these products make very different demands on our manufacturing overhead resources. We trace-or attempt to trace-overhead costs to the different products using direct labor cost, a unit-based cost driver. We may be doing more allocation than tracing. If so, then we probably don't have a very good idea of our actual product costs. Also, as you know, with the way computer technology has changed over time, it is easier and cheaper to collect and use detailed information-information that will allow us to assign costs more accurately."
Bryce: "This may be something we should explore. Jacob, what do you suggest?"
Jacob: "If we want more accurate product costs and if we really want to get in the cost reduction business, then we need to understand how costs behave. In particular, we need to understand activity cost behavior. Knowing what activities we perform, why we perform them, and how well we perform them will help us identify areas for improvement. We also need to know how the different products consume activity resources. What this boils down to is the need to use an activity-based management system. But before we jump into this, we need some idea of whether non-unit-based drivers add anything. Activity-based management is not an inexpensive undertaking. So I suggest that we do a preliminary study to see if direct labor cost is adequate for tracing. If not, then maybe some non-unit-drivers might be needed. In fact, if you would like,
I can gather some data that will provide some evidence on the usefulness of the activity-based approach."
Bryce: "What do you think, Kim? It's your division."
Kim: "What Jacob has said sounds promising. I think he should pursue it and do so quickly. I also think that we need to look at improving our quality. It sounds like we have a problem there. If quality could be improved, then our costs will drop. I'll talk to our quality people. Jacob, in the meantime, find out for us if moving to an activity-based system is the way to go. How much time do you need?"
Jacob: "I have already been gathering data. I could probably have a report within two weeks."
Based on my initial analysis, I am confident that an ABC system will offer significant improvement. For one of our conventional phone plants, I regressed total monthly overhead cost on monthly direct labor cost using the following 15 months of data:
The results were revealing. Although direct labor cost appears to be a driver of overhead cost, it really doesn't explain a lot of the variation. I then searched for other drivers-particularly non-unit drivers-that might offer more insight into overhead cost behavior. Every time a batch is produced, material movement occurs, regardless of the size of the batch. The number of moves seemed like a more logical driver. I was able to gather only 10 months of data for this. (Our information system doesn't provide the number of moves, so I had to build the data set by interviewing production personnel.) This information is provided next:
The regression results were impressive. There is no question in my mind that the number of moves is a good driver of materials-handling costs. Using the number of moves to assign materials-handling costs to products would likely be better than the cost assignment using direct labor cost. Furthermore, since small batches use the same number of moves as large batches, we have some evidence that we may be overcosting our high-volume products.
I looked at one more overhead activity: inspecting products. We have 15 inspectors who are paid an average of $4,000 per month. Each inspector offers about 160 hours of inspection capacity per month. However, it appears that they actually work only about 80 percent of those hours. The drop in demand we have experienced explains this idle time. I see no evidence of variable cost behavior here. I'm not exactly sure how to treat inspection cost, but I think that it is more related to inspection hours than direct labor cost. Some of the other overhead activities seem to be non-unit-level, as well-enough, in fact, to be concerned about how we assign costs.
After receiving the memo, Kim was intrigued. She then asked Jacob to use the same phone plant as a pilot for a preliminary ABC analysis. She instructed him to assign all overhead costs to the plant's two products (Regular and Deluxe models), using only four activities. The four activities were rework, moving materials, inspecting products, and a general catch-all activity labeled "other manufacturing activities." From the special study already performed, she knew that materials handling and inspecting involved significant cost; from production reports, she also knew that the rework activity involved significant cost. If the ABC and unit-based cost assignments did not differ by breaking out these three major activities, then ABC may not matter.
Pursuant to the request, Jacob produced the following cost and driver information:
Expected activity demands:
Required
Calculate the overhead cost per unit using the four activities and drivers identified by Kim and Jacob. If you were Kim, would you be inclined to implement an ABC system based on the evidence from this pilot test?
Unlock Deck
Unlock for access to all 33 flashcards in this deck.
Unlock Deck
k this deck
31
Zando Pharmaceuticals is an affiliate of the German-based Heisenberg Corporation, which employs 40,000 worldwide. Zando's St. Louis facility houses the U.S. corporate headquarters and Research and Development (R D). It produces 30 products, using 28 different batch processes. The facility has 2,000 employees on-site. In recent years, Zando's profitability has suffered, which can be attributed to increased competition, customer dissatisfaction, and regulatory pressures. Luis Alvarado, president of Zando, called a meeting to consider ways to improve profitability. He labeled the meeting a strategic planning session and invited the following officers: Kathy Shorts, environmental manager; Troy Lewis, head of R D; Johnny Mizukawa, vice president of production and quality; Larry Sower, vice president of finance; and Doreen Savara, marketing vice president.
Luis : "You all have received the quarterly financial reports for the last two years. The trends are negative. We are losing market share, profits are decreasing, and our costs seem to be increasing. We need to take actions to increase sales and reduce costs, and we need to do so as quickly as possible. Given our research strengths, it seems to me that our best bet is to grow revenues by introducing new products with proprietary rights. As far as costs are concerned, we need to improve our performance on that dimension as well. Lower per-unit costs for new and existing products are needed. Any suggestions?"
Troy : "For our products, our ability to control costs resides in development-my area-rather than manufacturing. We probably need to pay more attention to product and process design issues to ensure a reasonably level per-unit cost. Revenues are also affected in this stage. Once we patent a drug, the clock begins to tick, and we need to reduce time to market. Significantly, reducing time to market will allow us to generate revenues for a longer period of time than we are currently experiencing. It would also be helpful if we could reduce the cycle time for product development. Both actions would increase revenues. Finally, we can increase revenues by increasing the volume of new products."
Johnny : "There is a lot of merit to the observation that cost reduction opportunities reside mostly in product development. Once a drug is approved, its approval includes the manufacturing process. Any future changes in the manufacturing process require approval from the U.S. Food and Drug Administration. Because of this, we have been reluctant, historically, to engage in process improvement or reengineering. However, I wonder if we shouldn't reconsider this longstanding policy. Some of the quality problems we have could be corrected by changing some of our existing processes, and the costs saved may easily exceed any cost incurred from seeking FDA approval. I think our quality costs are at least 15 percent of sales. That's a lot of opportunity for improvement."
Kathy : "I agree that cost reduction-both in the product development stage and the manufacturing stage-should be a key strategic theme. The environmental area also offers some very good opportunities. A recent pollution prevention act passed by the legislature requires that we calculate the costs of generating hazardous substances for each process. This act was the incentive we needed to begin developing an environmental cost management system. The results so far indicate that environmental costs are much more than we realized. They are estimated to be in the range of 20 to 30 percent of total operating costs. Environmental costs can be reduced by such things as computerizing chemical inventory, eliminating the use of chlorinated solvents and other hazardous materials, reducing our use of virgin feedstocks, and redesigning processes and products so that we can reduce toxic residue release. We can really have a positive environmental impact while simultaneously reducing costs if more attention is paid to environmental issues during product development."
Doreen : "I like what I am hearing because I think that it also affects our ability to increase market share and revenues. For example, environmental impact is one of our major concerns. Some retail pharmacy chains pay particular attention to green products, and right now we are not competing well. Our environmental image is negative and needs to be improved. I am convinced that doing so will allow us to increase market share. Quality is another important matter. We have had to recall two batches of products during the past two years due to poor quality, and this has hurt our image more than the environmental issue. Improving the processes to avoid these kinds of problems will save us a lot of grief. Product image and reputation are essential to increasing customer satisfaction and market share."
Luis : "We started with the need to improve financial performance by increasing revenues and reducing costs. So far, we have some very good suggestions to help achieve these two objectives, but I have some concerns. First, do we have the talent and capabilities to improve quality and environmental performance? Troy, do your professionals really understand what they need to do to improve process and product designs so that we can see the desired quality and environmental improvements? Also, how can we reduce the cycle time for products and the time to market once patented?"
Troy : "Let me answer those questions in order. First, we probably are lacking the understanding on the design issues. We will need to do some training to help our research scientists and chemical engineers understand the consequences. We may need to hire a couple of professionals who have experience in dealing with these issues. Second, we may need to make cycle time and time to market significant performance measures and reward our people for actions that reduce those measures. Our employees need to align their interests with those of the company. If we can achieve this, we should see more revenue produced per employee."
Luis : "Good. Now, Johnny, tell us about production and quality. Do our manufacturing engineers and production workers need help with environmental and quality issues?"
Johnny : "Without question, training will be needed. Moreover, I really need to hire a couple of quality engineers."
Kathy : "I also think that we need an environmental engineer with experience in pharmaceutical manufacturing processes."
Luis : "Good. We certainly shouldn't ignore the necessary infrastructure to bring about the needed changes. Larry, you have been relatively quiet, what do you think about all this? Do you have any suggestions?"
Larry : "Infrastructure is important. If this is all going to work, timely and accurate information will be needed. It is hard to design products and processes with cost being a significant issue without providing the right kind of cost information. We are in the process of revamping the cost management information system so that it is activity based and so that we can provide quality and environmental cost information. After listening to the comments made here, I might also suggest that we need a strategic measurement system that can be used to align the interests of our employees with our improvement strategy. People need to know what is important, that the important factors are being measured, and that they are going to be evaluated and rewarded based on these factors. Finally, I would encourage the use of target costing to help manage costs during product development. To help you all understand the importance of good information, I have assembled some activity data relating to two new products currently under development. These two products will use the same process, using different setups. The data are organized into resource, activity, and cost object modules with an accompanying list of activity drivers to facilitate the use of an ABC software package recently acquired by Zando."
Resource Module (Projected General Ledger Costs of Manufacturing Process Associated with the Two Products)
Activity Module
Cost Object Module (Products and Projected Activity Usage)
List of Activity Drivers
Required
Classify the primary activities into three categories: environmental, quality, and other (neither quality nor environmental). Did some activities end up in more than one category? Explain.
Unlock Deck
Unlock for access to all 33 flashcards in this deck.
Unlock Deck
k this deck
32
CableTech Bell Corporation (CTB) operates in the telecommunications industry. CTB has two divisions: the Phone Division and the Cable Service Division. The Phone Division manufactures telephones in several plants located in the Midwest. The product lines run from relatively inexpensive touch-tone wall and desk phones to expensive, high-quality cellular phones. CTB also operates a cable TV service in Ohio. The Cable Service Division offers three products: a basic package with 25 channels; an enhanced package, which is the basic package plus 15 additional channels and two movie channels; and a premium package, which is the basic package plus 25 additional channels and three movie channels.
The Cable Service Division reported the following activity for the month of March:
The unit costs are divided as follows: 70 percent production and 30 percent marketing and customer service. Direct labor cost is the only driver used for tracing. Typically, the division uses only production costs to define unit costs. The preceding unit product cost information was provided at the request of the marketing manager and was the result of a special study.
Bryce Youngers, the president of CTB, is reasonably satisfied with the performance of the Cable Service Division. March's performance is fairly typical of what has been happening over the past two years. The Phone Division, however, is another matter. Its overall profit performance has been declining. Two years ago, income before income taxes had been about 25 percent of sales. March's dismal performance was also typical for what has been happening this year and is expected to continue-unless some action by management is taken to reverse the trend. During March, the Phone Division reported the following results:
During March, the Phone Division purchased materials totaling $312,000. There are no significant inventories of supplies (beginning or ending). Supplies are accounted for separately from materials. CTB's Phone Division had sales totaling $1,170,000 for March.
Based on March's results, Bryce decided to meet with three of the Phone Division's managers: Kim Breashears, divisional manager; Jacob Carder, divisional controller; and Larry Hartley, sales manager. A transcript of their recorded conversation is given next:
Bryce: "March's profit performance is down once again, and I think we need to see if we can identify the problem and correct it-before it's too late. Kim, what's your assessment of the situation?"
Kim: "Foreign competition is eating us alive. They are coming in with lower-priced phones of comparable or higher quality than our own. I've talked with several of the retailers that carry our lines, and they say the same. They are convinced that we can sell more if we lower our prices."
Larry: "They're right. If we could lower our prices by 10 to 15 percent, I think that we'd regain most ofour lost market share. But we also need to make sure that the quality of our products meets that of our competitors. As you know, we are spending a lot of money each month on rework and warranties. That worries me. I'd like to see that warranty cost cut by 70 to 80 percent. If we could do that, then customers would be more satisfied with our products, and I bet that we would not only regain our market share but increase it."
Jacob: "Lowering prices without lowering per-unit costs will not help us increase our profitability.
I think we need to improve our cost accounting system. I am not confident that we really know how much each of our product lines is costing us. It may be that we are overpricing some of our units because we are overcosting them. We may be underpricing other units."
Larry: "This sounds promising-especially if the overcosting is for some of our high-volume lines. A price decrease for these products would make the biggest difference-and if we knew they were overcosted, then we could offer immediate price reductions."
Bryce: "Jacob, I need more explanation. We have been using the same cost accounting system for the last 10 years. Why would it be a problem?"
Jacob: "I think that our manufacturing environment has changed. Over the years, we have added a lot of different product lines. Some of these products make very different demands on our manufacturing overhead resources. We trace-or attempt to trace-overhead costs to the different products using direct labor cost, a unit-based cost driver. We may be doing more allocation than tracing. If so, then we probably don't have a very good idea of our actual product costs. Also, as you know, with the way computer technology has changed over time, it is easier and cheaper to collect and use detailed information-information that will allow us to assign costs more accurately."
Bryce: "This may be something we should explore. Jacob, what do you suggest?"
Jacob: "If we want more accurate product costs and if we really want to get in the cost reduction business, then we need to understand how costs behave. In particular, we need to understand activity cost behavior. Knowing what activities we perform, why we perform them, and how well we perform them will help us identify areas for improvement. We also need to know how the different products consume activity resources. What this boils down to is the need to use an activity-based management system. But before we jump into this, we need some idea of whether non-unit-based drivers add anything. Activity-based management is not an inexpensive undertaking. So I suggest that we do a preliminary study to see if direct labor cost is adequate for tracing. If not, then maybe some non-unit-drivers might be needed. In fact, if you would like,
I can gather some data that will provide some evidence on the usefulness of the activity-based approach."
Bryce: "What do you think, Kim? It's your division."
Kim: "What Jacob has said sounds promising. I think he should pursue it and do so quickly. I also think that we need to look at improving our quality. It sounds like we have a problem there. If quality could be improved, then our costs will drop. I'll talk to our quality people. Jacob, in the meantime, find out for us if moving to an activity-based system is the way to go. How much time do you need?"
Jacob: "I have already been gathering data. I could probably have a report within two weeks."
Based on my initial analysis, I am confident that an ABC system will offer significant improvement. For one of our conventional phone plants, I regressed total monthly overhead cost on monthly direct labor cost using the following 15 months of data:
The results were revealing. Although direct labor cost appears to be a driver of overhead cost, it really doesn't explain a lot of the variation. I then searched for other drivers-particularly non-unit drivers-that might offer more insight into overhead cost behavior. Every time a batch is produced, material movement occurs, regardless of the size of the batch. The number of moves seemed like a more logical driver. I was able to gather only 10 months of data for this. (Our information system doesn't provide the number of moves, so I had to build the data set by interviewing production personnel.) This information is provided next:
The regression results were impressive. There is no question in my mind that the number of moves is a good driver of materials-handling costs. Using the number of moves to assign materials-handling costs to products would likely be better than the cost assignment using direct labor cost. Furthermore, since small batches use the same number of moves as large batches, we have some evidence that we may be overcosting our high-volume products.
I looked at one more overhead activity: inspecting products. We have 15 inspectors who are paid an average of $4,000 per month. Each inspector offers about 160 hours of inspection capacity per month. However, it appears that they actually work only about 80 percent of those hours. The drop in demand we have experienced explains this idle time. I see no evidence of variable cost behavior here. I'm not exactly sure how to treat inspection cost, but I think that it is more related to inspection hours than direct labor cost. Some of the other overhead activities seem to be non-unit-level, as well-enough, in fact, to be concerned about how we assign costs.
After receiving the memo, Kim was intrigued. She then asked Jacob to use the same phone plant as a pilot for a preliminary ABC analysis. She instructed him to assign all overhead costs to the plant's two products (Regular and Deluxe models), using only four activities. The four activities were rework, moving materials, inspecting products, and a general catch-all activity labeled "other manufacturing activities." From the special study already performed, she knew that materials handling and inspecting involved significant cost; from production reports, she also knew that the rework activity involved significant cost. If the ABC and unit-based cost assignments did not differ by breaking out these three major activities, then ABC may not matter.
Pursuant to the request, Jacob produced the following cost and driver information:
Expected activity demands:
Required
Suppose someone urged Kim to look into Time-Driven Activity-Based Costing (TDABC) instead of ABC. What would be the advantages of using a TDABC aproach?
Unlock Deck
Unlock for access to all 33 flashcards in this deck.
Unlock Deck
k this deck
33
Zando Pharmaceuticals is an affiliate of the German-based Heisenberg Corporation, which employs 40,000 worldwide. Zando's St. Louis facility houses the U.S. corporate headquarters and Research and Development (R D). It produces 30 products, using 28 different batch processes. The facility has 2,000 employees on-site. In recent years, Zando's profitability has suffered, which can be attributed to increased competition, customer dissatisfaction, and regulatory pressures. Luis Alvarado, president of Zando, called a meeting to consider ways to improve profitability. He labeled the meeting a strategic planning session and invited the following officers: Kathy Shorts, environmental manager; Troy Lewis, head of R D; Johnny Mizukawa, vice president of production and quality; Larry Sower, vice president of finance; and Doreen Savara, marketing vice president.
Luis : "You all have received the quarterly financial reports for the last two years. The trends are negative. We are losing market share, profits are decreasing, and our costs seem to be increasing. We need to take actions to increase sales and reduce costs, and we need to do so as quickly as possible. Given our research strengths, it seems to me that our best bet is to grow revenues by introducing new products with proprietary rights. As far as costs are concerned, we need to improve our performance on that dimension as well. Lower per-unit costs for new and existing products are needed. Any suggestions?"
Troy : "For our products, our ability to control costs resides in development-my area-rather than manufacturing. We probably need to pay more attention to product and process design issues to ensure a reasonably level per-unit cost. Revenues are also affected in this stage. Once we patent a drug, the clock begins to tick, and we need to reduce time to market. Significantly, reducing time to market will allow us to generate revenues for a longer period of time than we are currently experiencing. It would also be helpful if we could reduce the cycle time for product development. Both actions would increase revenues. Finally, we can increase revenues by increasing the volume of new products."
Johnny : "There is a lot of merit to the observation that cost reduction opportunities reside mostly in product development. Once a drug is approved, its approval includes the manufacturing process. Any future changes in the manufacturing process require approval from the U.S. Food and Drug Administration. Because of this, we have been reluctant, historically, to engage in process improvement or reengineering. However, I wonder if we shouldn't reconsider this longstanding policy. Some of the quality problems we have could be corrected by changing some of our existing processes, and the costs saved may easily exceed any cost incurred from seeking FDA approval. I think our quality costs are at least 15 percent of sales. That's a lot of opportunity for improvement."
Kathy : "I agree that cost reduction-both in the product development stage and the manufacturing stage-should be a key strategic theme. The environmental area also offers some very good opportunities. A recent pollution prevention act passed by the legislature requires that we calculate the costs of generating hazardous substances for each process. This act was the incentive we needed to begin developing an environmental cost management system. The results so far indicate that environmental costs are much more than we realized. They are estimated to be in the range of 20 to 30 percent of total operating costs. Environmental costs can be reduced by such things as computerizing chemical inventory, eliminating the use of chlorinated solvents and other hazardous materials, reducing our use of virgin feedstocks, and redesigning processes and products so that we can reduce toxic residue release. We can really have a positive environmental impact while simultaneously reducing costs if more attention is paid to environmental issues during product development."
Doreen : "I like what I am hearing because I think that it also affects our ability to increase market share and revenues. For example, environmental impact is one of our major concerns. Some retail pharmacy chains pay particular attention to green products, and right now we are not competing well. Our environmental image is negative and needs to be improved. I am convinced that doing so will allow us to increase market share. Quality is another important matter. We have had to recall two batches of products during the past two years due to poor quality, and this has hurt our image more than the environmental issue. Improving the processes to avoid these kinds of problems will save us a lot of grief. Product image and reputation are essential to increasing customer satisfaction and market share."
Luis : "We started with the need to improve financial performance by increasing revenues and reducing costs. So far, we have some very good suggestions to help achieve these two objectives, but I have some concerns. First, do we have the talent and capabilities to improve quality and environmental performance? Troy, do your professionals really understand what they need to do to improve process and product designs so that we can see the desired quality and environmental improvements? Also, how can we reduce the cycle time for products and the time to market once patented?"
Troy : "Let me answer those questions in order. First, we probably are lacking the understanding on the design issues. We will need to do some training to help our research scientists and chemical engineers understand the consequences. We may need to hire a couple of professionals who have experience in dealing with these issues. Second, we may need to make cycle time and time to market significant performance measures and reward our people for actions that reduce those measures. Our employees need to align their interests with those of the company. If we can achieve this, we should see more revenue produced per employee."
Luis : "Good. Now, Johnny, tell us about production and quality. Do our manufacturing engineers and production workers need help with environmental and quality issues?"
Johnny : "Without question, training will be needed. Moreover, I really need to hire a couple of quality engineers."
Kathy : "I also think that we need an environmental engineer with experience in pharmaceutical manufacturing processes."
Luis : "Good. We certainly shouldn't ignore the necessary infrastructure to bring about the needed changes. Larry, you have been relatively quiet, what do you think about all this? Do you have any suggestions?"
Larry : "Infrastructure is important. If this is all going to work, timely and accurate information will be needed. It is hard to design products and processes with cost being a significant issue without providing the right kind of cost information. We are in the process of revamping the cost management information system so that it is activity based and so that we can provide quality and environmental cost information. After listening to the comments made here, I might also suggest that we need a strategic measurement system that can be used to align the interests of our employees with our improvement strategy. People need to know what is important, that the important factors are being measured, and that they are going to be evaluated and rewarded based on these factors. Finally, I would encourage the use of target costing to help manage costs during product development. To help you all understand the importance of good information, I have assembled some activity data relating to two new products currently under development. These two products will use the same process, using different setups. The data are organized into resource, activity, and cost object modules with an accompanying list of activity drivers to facilitate the use of an ABC software package recently acquired by Zando."
Resource Module (Projected General Ledger Costs of Manufacturing Process Associated with the Two Products)
Activity Module
Cost Object Module (Products and Projected Activity Usage)
List of Activity Drivers
Required
Calculate the cost per unit for each of the proposed products using primary activity rates. Now, calculate the environmental cost per unit and the quality cost per unit. What does this tell you about the relative desirability of the two products?
Unlock Deck
Unlock for access to all 33 flashcards in this deck.
Unlock Deck
k this deck
Unlock Deck
Unlock for access to all 33 flashcards in this deck.


