Deck 23: Applying Analytics to Big Data in Operations Management
Full screen (f)
Question
Question
Question
Question
Question
Question
Question
Question
Question
Question
Question
Question
Question
Question
Question
Question
Question
Question
Question
Question
Question
Question
What Excel formula should be used to count the number of empty cells in the following dataset? 
A) COUNTIF(A6:H17, "")
B) COUNTIF(A1:H17, "")
C) COUNTIF(A6:H17, 0)
D) COUNTIF(A1:H17, Empty)
E) COUNT(A6:H17, "")
A) COUNTIF(A6:H17, "")
B) COUNTIF(A1:H17, "")
C) COUNTIF(A6:H17, 0)
D) COUNTIF(A1:H17, Empty)
E) COUNT(A6:H17, "")
Question
Question
Question
Question
An analytics manager, Mark, highlighted all empty cells using Excel's Conditional Formatting tool for the following dataset. What steps did he take? 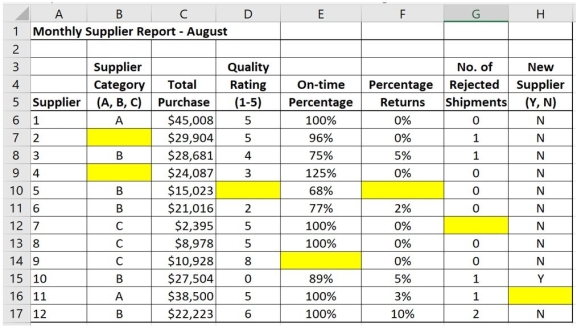
A) Select A6:H17; Rule type: Format only cells that contain, select Blanks; Color yellow.
B) Select A6:H17; Rule type: Format only cells that contain, select 0; Color yellow.
C) Select A1:H12; Rule type: Format only cells that contain, select Blanks; Color yellow.
D) Select A1:H12; Rule type: Format only top or bottom ranked values, select bottom 10%; Color yellow.
E) Select A6:H17; Rule type: Format only top or bottom ranked values, select bottom 5%; Color yellow.
Question
An analytics manager, Petra, wants to clean the following dataset using Excel's Conditional Formatting tool. What steps should she take if she wants to highlight any percentages in Column E that are not between 0% and 100% using a light blue color? 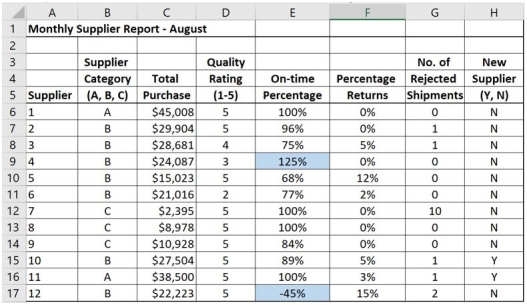
A) Select E6:E17; Rule type: Format only cells that contain, select Cell value, then not between, then 0 and 1; Color light blue.
B) Select A6:EH7; Rule type: Format only cells that contain, select Cell value, then less than, then 1; Color light blue.
C) Select E6:F17; Rule type: Format only cells that contain, select Cell value, then not between, then 0 and 1; Color light blue.
D) Select E1:E17; Rule type: Format only cells that contain, select Cell value, then more than, then 1; Color light blue.
E) Select C6:F17; Rule type: Format only cells that contain, select Cell value, then not between, then 0 and 1; Color light blue.
Question
An analytics manager, Lawrence, wants to clean the following dataset using Excel's Conditional Formatting tool. What steps should he take if he wants to make sure that any suppliers that have more than 8% returns should not receive a quality rating of 5? Highlight those cells using red. 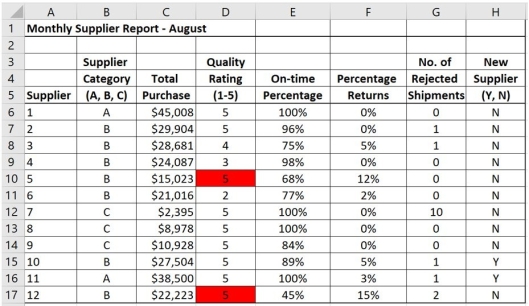
A) Select D6:D17; Rule type: Formula, enter =AND(F6=5,H6>0.08); Color red.
B) Select D6:F17; Rule type: Formula, enter =AND(F6=5,H6>0.08); Color red.
C) Select D6:D17; Rule type: Formula, enter =AND(F6=5,H6<0.08); Color red.
D) Select D6:F17; Rule type: Formula, enter =AND(F6=1,H6>0.08); Color red.
E) Select D1:D17; Rule type: Formula, enter =AND(F6=5,H6=0.08); Color red.
Question
Question
Perform a visual inspection on the following dataset. Identify the number of cells that need to be cleaned in Column D. 
A) 0
B) 1
C) 2
D) 4
E) 5
A) 0
B) 1
C) 2
D) 4
E) 5
Question
How many empty cells are there in the following dataset? 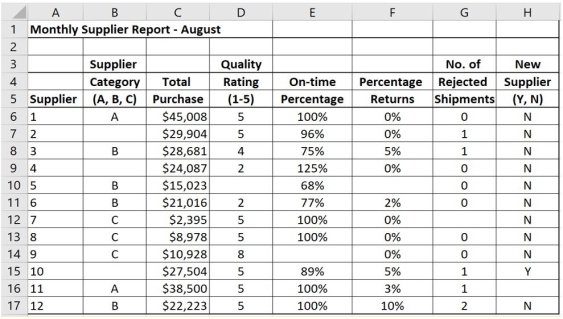
A) 0
B) 6
C) 8
D) 13
E) 28
A) 0
B) 6
C) 8
D) 13
E) 28
Question
Question
Question
Question
Question
Question
Question
Question
Question
Question
Question
Question
Question
Question
Question
Question
Question
An analytics manager, Lauren, is reviewing the performance data of fifteen branch stores. She wants to create a heat map with symbols as in the figure below. What tool should she use? 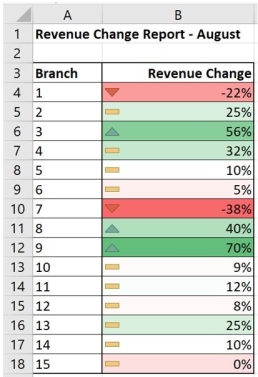
A) Select B4:B18; PivotTable
B) Select B4:B18; Conditional Formatting; Highlight Cells Rules
C) Select B4:B18; Conditional Formatting; Icon Sets
D) Select B1:B18; Conditional Formatting; Icon Sets
E) Select B4:B18; Conditional Formatting; Data Bars
A) Select B4:B18; PivotTable
B) Select B4:B18; Conditional Formatting; Highlight Cells Rules
C) Select B4:B18; Conditional Formatting; Icon Sets
D) Select B1:B18; Conditional Formatting; Icon Sets
E) Select B4:B18; Conditional Formatting; Data Bars
Question
Question
The following figure is an example of a ________. 
A) PivotTable
B) heat map
C) color map
D) heat zone
E) visual inspection grid
A) PivotTable
B) heat map
C) color map
D) heat zone
E) visual inspection grid
Question
Question
Question
Question
Question
Question
Question
Question
Question
Question
An analytics manager, Carole, is reviewing the performance data of fifteen branch stores. She wants to create a heat map using the color scale Green-White-Red.
a. Help Carole create the color map. What steps are required?
b. What color will Branch 1's cell be? Branch 9's cell?
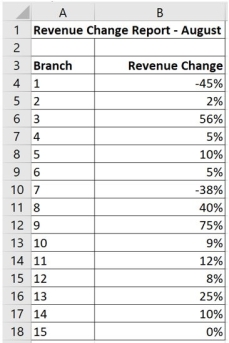
a. Help Carole create the color map. What steps are required?
b. What color will Branch 1's cell be? Branch 9's cell?
Question

Unlock Deck
Sign up to unlock the cards in this deck!
Unlock Deck
Unlock Deck
1/61
Play
Full screen (f)
Deck 23: Applying Analytics to Big Data in Operations Management
1
The three categories of analytics are ________, ________, and ________.
descriptive, predictive, prescriptive.
2
Predictive analytics invokes advanced optimization tools to recommend a strategy or action.
False
3
Descriptive analytics characterizes and summarizes data to facilitate understanding.
True
4
Data management is about using tools and techniques to convert data into summary information and business insights for decision making.
Unlock Deck
Unlock for access to all 61 flashcards in this deck.
Unlock Deck
k this deck
5
Data integrity requires that data be complete, consistent, and abundant.
Unlock Deck
Unlock for access to all 61 flashcards in this deck.
Unlock Deck
k this deck
6
One terabyte equals approximately one billion bytes.
Unlock Deck
Unlock for access to all 61 flashcards in this deck.
Unlock Deck
k this deck
7
Which of the following statements is FALSE?
A) Predictive analytics invokes advanced optimization tools to recommend a strategy or action.
B) Descriptive analytics analyzes past data to predict the future.
C) Prescriptive analytics characterizes and summaries data to facilitate understanding.
D) None of these.
E) All of these.
A) Predictive analytics invokes advanced optimization tools to recommend a strategy or action.
B) Descriptive analytics analyzes past data to predict the future.
C) Prescriptive analytics characterizes and summaries data to facilitate understanding.
D) None of these.
E) All of these.
Unlock Deck
Unlock for access to all 61 flashcards in this deck.
Unlock Deck
k this deck
8
Business analytics uses tools and techniques to convert data into ________ and ________.
Unlock Deck
Unlock for access to all 61 flashcards in this deck.
Unlock Deck
k this deck
9
Which of the following statements is TRUE?
A) Predictive analytics invokes advanced optimization tools to recommend a strategy or action.
B) Descriptive analytics analyzes past data to predict the future.
C) Prescriptive analytics characterizes and summaries data to facilitate understanding.
D) Descriptive analytics characterizes and summaries data to facilitate understanding.
E) Prescriptive analytics analyzes past data to predict the future.
Unlock Deck
Unlock for access to all 61 flashcards in this deck.
Unlock Deck
k this deck
10
What is big data?
Unlock Deck
Unlock for access to all 61 flashcards in this deck.
Unlock Deck
k this deck
11
Walmart's databases are estimated to contain more than 2.5 petabytes, the same size as the entire U.S. Library of Congress book collection.
Unlock Deck
Unlock for access to all 61 flashcards in this deck.
Unlock Deck
k this deck
12
Data collection is so massive that it is now measured in megabytes.
Unlock Deck
Unlock for access to all 61 flashcards in this deck.
Unlock Deck
k this deck
13
Digital data can be collected from web sites, credit cards, point-of-sale records, social media, and operational environments.
Unlock Deck
Unlock for access to all 61 flashcards in this deck.
Unlock Deck
k this deck
14
The huge amount of production, consumer, and social media data collected in digital form is called ________.
A) petabytes
B) big data
C) the big bang theory
D) prescriptive analytics
E) business analytics
A) petabytes
B) big data
C) the big bang theory
D) prescriptive analytics
E) business analytics
Unlock Deck
Unlock for access to all 61 flashcards in this deck.
Unlock Deck
k this deck
15
What tool does UPS use to analyze more than 1 billion data points each day?
A) predictive analytics
B) descriptive analytics
C) prescriptive analytics
D) descriptive statistics
E) variance analysis
A) predictive analytics
B) descriptive analytics
C) prescriptive analytics
D) descriptive statistics
E) variance analysis
Unlock Deck
Unlock for access to all 61 flashcards in this deck.
Unlock Deck
k this deck
16
Which of the following statements regarding big data is FALSE?
A) Data collection is so massive that it is now measured in gigabytes.
B) One terabyte equals approximately one trillion bytes.
C) Walmart's databases contain more than 2.5 petabytes.
D) Digital data can be collected from web sites, credit cards, point-of-sale records, social media, and operational environments.
E) Big data requires sophistication in how it is stored, processed, and analyzed.
Unlock Deck
Unlock for access to all 61 flashcards in this deck.
Unlock Deck
k this deck
17
Data completeness refers to the degree to which all required data are present.
Unlock Deck
Unlock for access to all 61 flashcards in this deck.
Unlock Deck
k this deck
18
Explain business analytics.
Unlock Deck
Unlock for access to all 61 flashcards in this deck.
Unlock Deck
k this deck
19
The management task with business analytics is all about gathering as much data as possible.
Unlock Deck
Unlock for access to all 61 flashcards in this deck.
Unlock Deck
k this deck
20
Define three categories of analytics.
Unlock Deck
Unlock for access to all 61 flashcards in this deck.
Unlock Deck
k this deck
21
Which of the following is NOT one of the four categories (areas) to click-and-drag fields into when using the PivotTable function?
A) Filters
B) Rows
C) Columns
D) Values
E) Buckets
A) Filters
B) Rows
C) Columns
D) Values
E) Buckets
Unlock Deck
Unlock for access to all 61 flashcards in this deck.
Unlock Deck
k this deck
22
What Excel formula should be used to count the number of empty cells in the following dataset?
A) COUNTIF(A6:H17, "")
B) COUNTIF(A1:H17, "")
C) COUNTIF(A6:H17, 0)
D) COUNTIF(A1:H17, Empty)
E) COUNT(A6:H17, "")
A) COUNTIF(A6:H17, "")
B) COUNTIF(A1:H17, "")
C) COUNTIF(A6:H17, 0)
D) COUNTIF(A1:H17, Empty)
E) COUNT(A6:H17, "")
Unlock Deck
Unlock for access to all 61 flashcards in this deck.
Unlock Deck
k this deck
23
It is impossible to include more than one field in the Rows area or the Columns area in a PivotTable.
Unlock Deck
Unlock for access to all 61 flashcards in this deck.
Unlock Deck
k this deck
24
Data can be stored three ways: ________, ________, or ________.
Unlock Deck
Unlock for access to all 61 flashcards in this deck.
Unlock Deck
k this deck
25
What is a PivotTable?
Unlock Deck
Unlock for access to all 61 flashcards in this deck.
Unlock Deck
k this deck
26
An analytics manager, Mark, highlighted all empty cells using Excel's Conditional Formatting tool for the following dataset. What steps did he take?
A) Select A6:H17; Rule type: Format only cells that contain, select Blanks; Color yellow.
B) Select A6:H17; Rule type: Format only cells that contain, select 0; Color yellow.
C) Select A1:H12; Rule type: Format only cells that contain, select Blanks; Color yellow.
D) Select A1:H12; Rule type: Format only top or bottom ranked values, select bottom 10%; Color yellow.
E) Select A6:H17; Rule type: Format only top or bottom ranked values, select bottom 5%; Color yellow.
Unlock Deck
Unlock for access to all 61 flashcards in this deck.
Unlock Deck
k this deck
27
An analytics manager, Petra, wants to clean the following dataset using Excel's Conditional Formatting tool. What steps should she take if she wants to highlight any percentages in Column E that are not between 0% and 100% using a light blue color?
A) Select E6:E17; Rule type: Format only cells that contain, select Cell value, then not between, then 0 and 1; Color light blue.
B) Select A6:EH7; Rule type: Format only cells that contain, select Cell value, then less than, then 1; Color light blue.
C) Select E6:F17; Rule type: Format only cells that contain, select Cell value, then not between, then 0 and 1; Color light blue.
D) Select E1:E17; Rule type: Format only cells that contain, select Cell value, then more than, then 1; Color light blue.
E) Select C6:F17; Rule type: Format only cells that contain, select Cell value, then not between, then 0 and 1; Color light blue.
Unlock Deck
Unlock for access to all 61 flashcards in this deck.
Unlock Deck
k this deck
28
An analytics manager, Lawrence, wants to clean the following dataset using Excel's Conditional Formatting tool. What steps should he take if he wants to make sure that any suppliers that have more than 8% returns should not receive a quality rating of 5? Highlight those cells using red.
A) Select D6:D17; Rule type: Formula, enter =AND(F6=5,H6>0.08); Color red.
B) Select D6:F17; Rule type: Formula, enter =AND(F6=5,H6>0.08); Color red.
C) Select D6:D17; Rule type: Formula, enter =AND(F6=5,H6<0.08); Color red.
D) Select D6:F17; Rule type: Formula, enter =AND(F6=1,H6>0.08); Color red.
E) Select D1:D17; Rule type: Formula, enter =AND(F6=5,H6=0.08); Color red.
Unlock Deck
Unlock for access to all 61 flashcards in this deck.
Unlock Deck
k this deck
29
A heat map uses colors to represent values, with lighter colors applied to more extreme values and darker colors applied to more moderate values.
Unlock Deck
Unlock for access to all 61 flashcards in this deck.
Unlock Deck
k this deck
30
Perform a visual inspection on the following dataset. Identify the number of cells that need to be cleaned in Column D.
A) 0
B) 1
C) 2
D) 4
E) 5
A) 0
B) 1
C) 2
D) 4
E) 5
Unlock Deck
Unlock for access to all 61 flashcards in this deck.
Unlock Deck
k this deck
31
How many empty cells are there in the following dataset?
A) 0
B) 6
C) 8
D) 13
E) 28
A) 0
B) 6
C) 8
D) 13
E) 28
Unlock Deck
Unlock for access to all 61 flashcards in this deck.
Unlock Deck
k this deck
32
Which of the following statements is TRUE regarding data management?
A) Managers should always remove the entire record with any missing values.
B) Once managers conclude that the data is consistent, they look for completeness.
C) Consistency refers to the degree of conformity of a measure to a standard value.
D) Mangers need to identify "outliers" after they are accepted into the dataset.
E) Data can be stored three ways: character, pattern, or numeric.
Unlock Deck
Unlock for access to all 61 flashcards in this deck.
Unlock Deck
k this deck
33
Explain the three requirements of data integrity.
Unlock Deck
Unlock for access to all 61 flashcards in this deck.
Unlock Deck
k this deck
34
PivotTables are easiest to read if there is(are) at most ________ field(s) in the Rows area and ________ field(s) in the Columns area.
Unlock Deck
Unlock for access to all 61 flashcards in this deck.
Unlock Deck
k this deck
35
Which of the following Excel functions is NOT used to facilitate quick accuracy checks on the extreme values?
A) MIN
B) SMALL
C) MEDIAN
D) MAX
E) LARGE
A) MIN
B) SMALL
C) MEDIAN
D) MAX
E) LARGE
Unlock Deck
Unlock for access to all 61 flashcards in this deck.
Unlock Deck
k this deck
36
Data consistency refers to the degree of conformity of a measure to a standard value.
Unlock Deck
Unlock for access to all 61 flashcards in this deck.
Unlock Deck
k this deck
37
________ is an Excel tool to visually identify characteristics of data using formatting.
Unlock Deck
Unlock for access to all 61 flashcards in this deck.
Unlock Deck
k this deck
38
________ is a tool to facilitate in-depth analysis of numeric data by applying filters and providing summary computations for categories and subcategories of the dataset.
A) COUNTIF
B) PivotTable
C) Graphical analysis
D) Visual inspection
E) Conditional Formatting
A) COUNTIF
B) PivotTable
C) Graphical analysis
D) Visual inspection
E) Conditional Formatting
Unlock Deck
Unlock for access to all 61 flashcards in this deck.
Unlock Deck
k this deck
39
PivotTables are easiest to read if there is at most one field in the Rows area and one field in the Columns area.
Unlock Deck
Unlock for access to all 61 flashcards in this deck.
Unlock Deck
k this deck
40
Which of the following Excel functions is used to facilitate quick accuracy checks on the extreme values?
A) AVERAGE
B) SMALL
C) MEDIAN
D) STDEV
E) QUARTILE
A) AVERAGE
B) SMALL
C) MEDIAN
D) STDEV
E) QUARTILE
Unlock Deck
Unlock for access to all 61 flashcards in this deck.
Unlock Deck
k this deck
41
Which of the following data visualization graphs provides a best-fit line through a central tendency of points on a graph?
A) histogram
B) line graph
C) slope graph
D) scatter diagram
E) regression line
A) histogram
B) line graph
C) slope graph
D) scatter diagram
E) regression line
Unlock Deck
Unlock for access to all 61 flashcards in this deck.
Unlock Deck
k this deck
42
Which of the following data visualization graphs represents percentages or portions of a whole?
A) bar graph
B) line graph
C) slope graph
D) pie chart
E) scatter diagram
A) bar graph
B) line graph
C) slope graph
D) pie chart
E) scatter diagram
Unlock Deck
Unlock for access to all 61 flashcards in this deck.
Unlock Deck
k this deck
43
Which of the following business analytics tools identifies and organizes data into groups with similar attributes?
A) linear programming
B) cohort analysis
C) opinion mining
D) mapping and tracking
E) cluster analysis
A) linear programming
B) cohort analysis
C) opinion mining
D) mapping and tracking
E) cluster analysis
Unlock Deck
Unlock for access to all 61 flashcards in this deck.
Unlock Deck
k this deck
44
A ________ in Excel's Conditional Formatting changes the Fill color of every cell by using a gradation of two or three different colors. ________ means more extreme.
A) color scale; Darker
B) heat map; Darker
C) color map; Lighter
D) color scale; Lighter
E) color map; Darker
A) color scale; Darker
B) heat map; Darker
C) color map; Lighter
D) color scale; Lighter
E) color map; Darker
Unlock Deck
Unlock for access to all 61 flashcards in this deck.
Unlock Deck
k this deck
45
Which of the following data visualization graphs plots data that are readily divided into categories?
A) bar graph
B) line graph
C) slope graph
D) network diagram
E) scatter diagram
A) bar graph
B) line graph
C) slope graph
D) network diagram
E) scatter diagram
Unlock Deck
Unlock for access to all 61 flashcards in this deck.
Unlock Deck
k this deck
46
Which of the following business analytics tools is designed to explore very large datasets, looking for relevant patterns or relationships?
A) data mining
B) cluster analysis
C) mapping and tracking
D) cohort analysis
E) linear programming
A) data mining
B) cluster analysis
C) mapping and tracking
D) cohort analysis
E) linear programming
Unlock Deck
Unlock for access to all 61 flashcards in this deck.
Unlock Deck
k this deck
47
Which of the following business analytics tools take(s) large volumes of data and potential variables to form groupings of variables to identify complex paths and associations?
A) neural networks
B) cohort analysis
C) opinion mining
D) mapping and tracking
E) cluster analysis
A) neural networks
B) cohort analysis
C) opinion mining
D) mapping and tracking
E) cluster analysis
Unlock Deck
Unlock for access to all 61 flashcards in this deck.
Unlock Deck
k this deck
48
An analytics manager, Lauren, is reviewing the performance data of fifteen branch stores. She wants to create a heat map with symbols as in the figure below. What tool should she use?
A) Select B4:B18; PivotTable
B) Select B4:B18; Conditional Formatting; Highlight Cells Rules
C) Select B4:B18; Conditional Formatting; Icon Sets
D) Select B1:B18; Conditional Formatting; Icon Sets
E) Select B4:B18; Conditional Formatting; Data Bars
A) Select B4:B18; PivotTable
B) Select B4:B18; Conditional Formatting; Highlight Cells Rules
C) Select B4:B18; Conditional Formatting; Icon Sets
D) Select B1:B18; Conditional Formatting; Icon Sets
E) Select B4:B18; Conditional Formatting; Data Bars
Unlock Deck
Unlock for access to all 61 flashcards in this deck.
Unlock Deck
k this deck
49
Which of the following business analytics tools presents an overview of the most important metrics (i.e., key success indicators) all in one place?
A) PivotTable
B) heat map
C) dashboard
D) Conditional Formatting
E) COUNTIF
A) PivotTable
B) heat map
C) dashboard
D) Conditional Formatting
E) COUNTIF
Unlock Deck
Unlock for access to all 61 flashcards in this deck.
Unlock Deck
k this deck
50
The following figure is an example of a ________.
A) PivotTable
B) heat map
C) color map
D) heat zone
E) visual inspection grid
A) PivotTable
B) heat map
C) color map
D) heat zone
E) visual inspection grid
Unlock Deck
Unlock for access to all 61 flashcards in this deck.
Unlock Deck
k this deck
51
Which of the following is NOT one of the three approaches for data mining?
A) text analysis
B) sentiment analysis
C) opinion mining
D) pattern analytics
E) test analysis
A) text analysis
B) sentiment analysis
C) opinion mining
D) pattern analytics
E) test analysis
Unlock Deck
Unlock for access to all 61 flashcards in this deck.
Unlock Deck
k this deck
52
A heat map uses colors to represent values, with ________ colors applied to more extreme values and ________ colors applied to more moderate values.
Unlock Deck
Unlock for access to all 61 flashcards in this deck.
Unlock Deck
k this deck
53
Describe the three approaches for data mining.
Unlock Deck
Unlock for access to all 61 flashcards in this deck.
Unlock Deck
k this deck
54
Sophisticated predictive and prescriptive tools have existed for only a few years.
Unlock Deck
Unlock for access to all 61 flashcards in this deck.
Unlock Deck
k this deck
55
In a ________, the highest and lowest values are highlighted.
A) PivotTable
B) heat map
C) color map
D) heat zone
E) visual inspection
A) PivotTable
B) heat map
C) color map
D) heat zone
E) visual inspection
Unlock Deck
Unlock for access to all 61 flashcards in this deck.
Unlock Deck
k this deck
56
Which of the following data visualization graphs shows the frequency of occurrences of a variable?
A) histogram
B) line graph
C) slope graph
D) network diagram
E) regression line
A) histogram
B) line graph
C) slope graph
D) network diagram
E) regression line
Unlock Deck
Unlock for access to all 61 flashcards in this deck.
Unlock Deck
k this deck
57
Speech recognition and self-driving cars are applications of:
A) machine learning
B) cohort analysis
C) opinion mining
D) mapping and tracking
E) cluster analysis
A) machine learning
B) cohort analysis
C) opinion mining
D) mapping and tracking
E) cluster analysis
Unlock Deck
Unlock for access to all 61 flashcards in this deck.
Unlock Deck
k this deck
58
Which of the following data visualization graphs uses arcs and nodes to provide a representation of flow through a system?
A) bar graph
B) line graph
C) slope graph
D) network diagram
E) scatter diagram
A) bar graph
B) line graph
C) slope graph
D) network diagram
E) scatter diagram
Unlock Deck
Unlock for access to all 61 flashcards in this deck.
Unlock Deck
k this deck
59
Which of the following data visualization graphs illustrates relative increases or decreases of categories in time or at points of comparison?
A) bar graph
B) line graph
C) slope graph
D) network diagram
E) scatter diagram
A) bar graph
B) line graph
C) slope graph
D) network diagram
E) scatter diagram
Unlock Deck
Unlock for access to all 61 flashcards in this deck.
Unlock Deck
k this deck
60
An analytics manager, Carole, is reviewing the performance data of fifteen branch stores. She wants to create a heat map using the color scale Green-White-Red.
a. Help Carole create the color map. What steps are required?
b. What color will Branch 1's cell be? Branch 9's cell?
a. Help Carole create the color map. What steps are required?
b. What color will Branch 1's cell be? Branch 9's cell?
Unlock Deck
Unlock for access to all 61 flashcards in this deck.
Unlock Deck
k this deck
61
Explain neural networks and machine learning.
Unlock Deck
Unlock for access to all 61 flashcards in this deck.
Unlock Deck
k this deck
Unlock Deck
Unlock for access to all 61 flashcards in this deck.


