Deck 13: Multiple Regression Analysis
Full screen (f)
Question
Three predictor variables are being considered for use in a linear regression model. 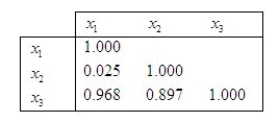 Given the correlation matrix above, does it appear that multicollinearity could be a problem?
______________
Explain.
________________________________________________________
Given the correlation matrix above, does it appear that multicollinearity could be a problem?______________
Explain.
________________________________________________________
Question
Question
Question
Question
Question
Question
Question
Question
Question
Question
Question
Question
Question
Question
Question
Question
Question
Question
Question
Question
The t-distribution with df = n - 2 is used for testing a specific set of regression coefficients,e.g.,
 .
.
. Question
Question
Question
Question
Question
Question
Question
Question
Question
Plots of the residuals against  or against the individual independent variables
  often indicate departures from the assumptions required for an analysis of variance, and they also may suggest changes in the underlying model.
or against the individual independent variables often indicate departures from the assumptions required for an analysis of variance, and they also may suggest changes in the underlying model. Question
Question
Question
Question
In constructing a multiple regression model with two independent variables  and
and  it was known that the correlation between
  and y is .75, and the correlation between
  and y is .55. Based on this information, the regression model containing both independent variable will explain 65% of the variation in the dependent variable y.
and it was known that the correlation between and y is .75, and the correlation between and y is .55. Based on this information, the regression model containing both independent variable will explain 65% of the variation in the dependent variable y. Question
Question
Question
Question
Question
In a multiple regression analysis, the regression equation  is obtained. The
  variable is quantitative variable, and the
  variable is a dummy variable with values 0 and 1. Given this information, we can interpret the slope coefficient (-3) on variable
  as follows: Holding
  constant, if the value of
  is changed from 0 to 1, the average value of y will decrease by 3 units.
is obtained. The variable is quantitative variable, and the variable is a dummy variable with values 0 and 1. Given this information, we can interpret the slope coefficient (-3) on variable as follows: Holding constant, if the value of is changed from 0 to 1, the average value of y will decrease by 3 units. Question
Question
In multiple regression, the prediction equation  is the line that minimizes SSE, the sum of squares of the deviations of the observed values y from the predicted values
  .
.
is the line that minimizes SSE, the sum of squares of the deviations of the observed values y from the predicted values . Question
Question
Question
Question
Question
Same statistical packages print a second  statistic, called the adjusted coefficient of determination, which has been adjusted for the degrees of freedom to take into account the sample size and the number of predictor variables.
statistic, called the adjusted coefficient of determination, which has been adjusted for the degrees of freedom to take into account the sample size and the number of predictor variables. Question
Assume that a company is tracking their advertising expenditures as they relate to television (  ) and radio advertising (
  ). The owner of the company believes that it would improve the regression model to add a third variable that represents the sum of the advertising on radio and television (
  =
=  +
+  ). This assessment is generally correct.
) and radio advertising ( ). The owner of the company believes that it would improve the regression model to add a third variable that represents the sum of the advertising on radio and television ( = + ). This assessment is generally correct. Question
Question
In testing the significance of a multiple regression model in which there are three independent variables, the null hypothesis is  .
.
. Question
Residuals are the deviations between the observed values of y and their predicted values  .
.
. Question
Question
Question
Question
Question
In reference to the equation  , the value 0.63 is the average change in y per unit change in
  , regardless of the value of
  .
.
, the value 0.63 is the average change in y per unit change in , regardless of the value of . Question
Let  be the least squares estimate of the population coefficient
  . If the regression assumptions hold true, the test statistic given by
  has an F distribution with k and n-k-1 degrees of freedom, where n is the number of observations and k is the number of predictor variables.
be the least squares estimate of the population coefficient . If the regression assumptions hold true, the test statistic given by has an F distribution with k and n-k-1 degrees of freedom, where n is the number of observations and k is the number of predictor variables. Question
Question
Question
A multiple regression model has the form  . The coefficient
  is interpreted as the change in y per unit change in
  .
.
. The coefficient is interpreted as the change in y per unit change in . Question
Question
In a multiple regression problem involving 24 observations and three independent variables, the estimated regression equation is  . For this model, SST = 800 and SSE = 245. Then, the value of the F statistic for testing the significance of the model is 15.102.
. For this model, SST = 800 and SSE = 245. Then, the value of the F statistic for testing the significance of the model is 15.102. Question
If we want to relate a random variable y to two-independent variables  and
and  , a regression hyperplane is the three-dimensional equivalent of a regression line that minimizes the sum of the squared vertical deviations between the sample points suspended in y vs.
  vs.
vs.  space and their associated multiple regression estimates, all of which lie on this hyperplane.
and , a regression hyperplane is the three-dimensional equivalent of a regression line that minimizes the sum of the squared vertical deviations between the sample points suspended in y vs. vs. space and their associated multiple regression estimates, all of which lie on this hyperplane. Question
Question
Question
In regression analysis, a p-value provides the probability (judged by the t-value associated with an estimated regression coefficient) of  being true, given the claim
  : The true regression coefficient equals 0.
being true, given the claim : The true regression coefficient equals 0. Question
In a multiple regression problem, the regression equation is  . The estimated value for y when
  and
and  is 48.
. The estimated value for y when and is 48. Question
For each x term in the multiple regression equation, the corresponding  is referred to as a partial regression coefficient.
is referred to as a partial regression coefficient. Question
Question
Question
Question
Question
Question
In reference to the equation: 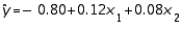 , the value -0.80 is the y-intercept.
, the value -0.80 is the y-intercept. Question
In reference to the equation 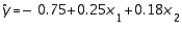 , the value -0.75 is the intercept.
, the value -0.75 is the intercept. Question
A coefficient of multiple correlation is denoted by  and equals the proportion of the total variation in the values of the dependent variable, y that is explained by the estimated multiple regression of y on
  ,
,  , and possibly additional independent variable (
  , and so on).
and equals the proportion of the total variation in the values of the dependent variable, y that is explained by the estimated multiple regression of y on , , and possibly additional independent variable ( , and so on). Question
In testing the significance of a multiple regression model in which there are three independent variables, the null hypothesis is  .
.
. Question
Question
Question
Question

Unlock Deck
Sign up to unlock the cards in this deck!
Unlock Deck
Unlock Deck
1/178
Play
Full screen (f)
Deck 13: Multiple Regression Analysis
1
Three predictor variables are being considered for use in a linear regression model. Given the correlation matrix above, does it appear that multicollinearity could be a problem?
______________
Explain.
________________________________________________________
Given the correlation matrix above, does it appear that multicollinearity could be a problem?______________
Explain.
________________________________________________________
Yes; It appears that multicollinearity could be a problem because x[3] is highly correlated with both x[1] and x[2].
2
When two or more of the predictor variables are highly correlated with one another, adding or deleting a predictor variable may cause significant changes in the values of the other regression coefficients.
True
3
Multicollinearity is present if the dependent variable is linearly related to one of the explanatory variables.
False
4
Qualitative predictor variables are entered into a regression model through dummy variables.
Unlock Deck
Unlock for access to all 178 flashcards in this deck.
Unlock Deck
k this deck
5
One of the consequences of multicollinearity in multiple regression is inflated standard errors in some or all of the estimated slope coefficients.
Unlock Deck
Unlock for access to all 178 flashcards in this deck.
Unlock Deck
k this deck
6
If a multiple regression model includes 10 or more predictor variables, it is almost certain that changes in the predictor variables cause changes in the response variable y.
Unlock Deck
Unlock for access to all 178 flashcards in this deck.
Unlock Deck
k this deck
7
When the independent variables are correlated with one another in a multiple regression analysis, this condition is called:
A) heteroscedasticity
B) homoscedasticity
C) multicollinearity
D) causality
E) collinearity
A) heteroscedasticity
B) homoscedasticity
C) multicollinearity
D) causality
E) collinearity
Unlock Deck
Unlock for access to all 178 flashcards in this deck.
Unlock Deck
k this deck
8
The problem of multicollinearity arises when:
A) the dependent variables are highly correlated with one another
B) the independent variables are highly correlated with one another
C) the independent variables are highly correlated with the dependent variable
D) the independent variables are not correlated with each other
E) none of these
A) the dependent variables are highly correlated with one another
B) the independent variables are highly correlated with one another
C) the independent variables are highly correlated with the dependent variable
D) the independent variables are not correlated with each other
E) none of these
Unlock Deck
Unlock for access to all 178 flashcards in this deck.
Unlock Deck
k this deck
9
Discuss some of the signals for the presence of multicollinearity.
Unlock Deck
Unlock for access to all 178 flashcards in this deck.
Unlock Deck
k this deck
10
If multicollinearity exists among the independent variables included in a multiple regression model, then:
A) regression coefficients will be difficult to interpret
B) standard errors of the regression coefficients for the correlated independent variables will increase
C) multiple coefficient of determination will assume a value close to zero
D) regression coefficients will be difficult to interpret and standard errors of the regression coefficients for the correlated independent variables will increase
E) none of these
Unlock Deck
Unlock for access to all 178 flashcards in this deck.
Unlock Deck
k this deck
11
Multicollinearity will result in excessively low standard errors of the parameter estimates reported in the regression output.
Unlock Deck
Unlock for access to all 178 flashcards in this deck.
Unlock Deck
k this deck
12
When multicollinearity is present, the estimated regression coefficients will have large standard error, causing imprecision in confidence and prediction intervals.
Unlock Deck
Unlock for access to all 178 flashcards in this deck.
Unlock Deck
k this deck
13
Which of the following statements regarding multicollinearity is not true?
A) It exists in virtually all multiple regression models.
B) It is also called collinearity and intercorrelation.
C) It is a condition that exists when the independent variables are highly correlated with the dependent variable.
D) It does not affect the F-test of the analysis of variance.
E) It exists in virtually all multiple regression models and it is also called collinearity and intercorrelation.
Unlock Deck
Unlock for access to all 178 flashcards in this deck.
Unlock Deck
k this deck
14
Multicollinearity is a situation in which two or more of the independent variables are highly correlated with each other.
Unlock Deck
Unlock for access to all 178 flashcards in this deck.
Unlock Deck
k this deck
15
In multiple regression analysis, which of the following is a clue that multicollinearity is present?
A) The value ofis large, indicting a good fit, but the individual t - tests are nonsignificant.
B) The signs of the regression coefficients are contrary to what we would intuitively expect the contributions of those variables would be.
C) A matrix of correlations, generated by computer, shows which predictor variables are highly correlated with each other and with the response variable y.
D) All of these.
E) None of these.
Unlock Deck
Unlock for access to all 178 flashcards in this deck.
Unlock Deck
k this deck
16
In regression analysis, multicollinearity refers to:
A) the response variables being highly correlated with one another
B) the predictor variables being highly correlated with one another
C) the response variable and the predictor variables are highly correlated with one another
D) the response variables are highly correlated over time
E) the predictor variables are highly correlated over time
Unlock Deck
Unlock for access to all 178 flashcards in this deck.
Unlock Deck
k this deck
17
What is the effect of multicollinearity on the estimated regression coefficients?
Unlock Deck
Unlock for access to all 178 flashcards in this deck.
Unlock Deck
k this deck
18
Multicollinearity is present when there is a high degree of correlation between the dependent variable and all the independent variables included in the model.
Unlock Deck
Unlock for access to all 178 flashcards in this deck.
Unlock Deck
k this deck
19
Discuss briefly what is meant by multicollinearity.
Unlock Deck
Unlock for access to all 178 flashcards in this deck.
Unlock Deck
k this deck
20
Typical symptoms of the presence of multicollinearity include:
A) the estimated regression coefficients to vary substantially from sample to sample ; this fact raises their standard errors; hence, theis unlikely to be greater than 2, or statistically significant
B) the estimated regression coefficients change greatly in value as independent variables are dropped from or added to the regression equation
C) the signs of the estimated regression coefficients are nonsensical; they are negative when common sense suggests positive signs and vice versa
D) all of these and more
E) none of these
Unlock Deck
Unlock for access to all 178 flashcards in this deck.
Unlock Deck
k this deck
21
The t-distribution with df = n - 2 is used for testing a specific set of regression coefficients,e.g.,
.
. Unlock Deck
Unlock for access to all 178 flashcards in this deck.
Unlock Deck
k this deck
22
In stepwise regression procedure, if two independent variables are highly correlated, then:
A) both variables will enter the equation
B) only one variable will enter the equation
C) neither variable will enter the equation
D) the regression is equal to zero
E) Not enough information is given to answer this question.
A) both variables will enter the equation
B) only one variable will enter the equation
C) neither variable will enter the equation
D) the regression is equal to zero
E) Not enough information is given to answer this question.
Unlock Deck
Unlock for access to all 178 flashcards in this deck.
Unlock Deck
k this deck
23
Quantitative predictor variables are entered into a regression model through indicator variables.
Unlock Deck
Unlock for access to all 178 flashcards in this deck.
Unlock Deck
k this deck
24
If a stepwise regression procedure is used to enter, one at a time, three variables into a regression model, the resulting regression equation may differ from the regression equation that occurs when all three variables are entered at one step.
Unlock Deck
Unlock for access to all 178 flashcards in this deck.
Unlock Deck
k this deck
25
In order to incorporate the marital status variable into a multiple regression model, there are four possible categories for this variable: married, single, divorced, or widow. Based on this information, four indictor variables will need to be created (one for each category) and incorporated into the regression model.
Unlock Deck
Unlock for access to all 178 flashcards in this deck.
Unlock Deck
k this deck
26
A dummy or indicator variable is a dependent variable whose values are either 0.0 or 1.0.
Unlock Deck
Unlock for access to all 178 flashcards in this deck.
Unlock Deck
k this deck
27
Stepwise regression is a statistical technique that is always implemented when developing a regression model to fit a nonlinear relationship between the dependent and potential independent variables.
Unlock Deck
Unlock for access to all 178 flashcards in this deck.
Unlock Deck
k this deck
28
Stepwise regression analysis is a procedure that is implemented by computer and is available in most statistical packages. It is mainly used to determine which of a large number of independent variables should be included in the model.
Unlock Deck
Unlock for access to all 178 flashcards in this deck.
Unlock Deck
k this deck
29
In stepwise regression procedure, the independent variable with the largest F-statistic, or equally with the smallest p-value, is chosen as the first entering variable. The standard, also called the F-to-enter, is usually set at F equals:
A) 4
B) 2
C) 5
D) 0
E) 1
A) 4
B) 2
C) 5
D) 0
E) 1
Unlock Deck
Unlock for access to all 178 flashcards in this deck.
Unlock Deck
k this deck
30
Plots of the residuals against or against the individual independent variables often indicate departures from the assumptions required for an analysis of variance, and they also may suggest changes in the underlying model.
or against the individual independent variables often indicate departures from the assumptions required for an analysis of variance, and they also may suggest changes in the underlying model. Unlock Deck
Unlock for access to all 178 flashcards in this deck.
Unlock Deck
k this deck
31
Stepwise regression is an iterative procedure that:
A) adds one independent variable at a time
B) deletes one independent variable at a time
C) adds one dependent variable at a time
D) either adds one independent variable at a time or deletes one independent variable at a time
E) both adds one independent variable at a time and deletes one independent variable at a time
Unlock Deck
Unlock for access to all 178 flashcards in this deck.
Unlock Deck
k this deck
32
Three qualitative variables need to be incorporated into a regression model. The first variable has 5 possible categories, the second one has 3 possible categories, and the third one has 2 possible categories. Based on this information, ten dummy variables need to be included in the regression model.
Unlock Deck
Unlock for access to all 178 flashcards in this deck.
Unlock Deck
k this deck
33
In order to incorporate qualitative variables into a regression model, one or more dummy variables are needed.
Unlock Deck
Unlock for access to all 178 flashcards in this deck.
Unlock Deck
k this deck
34
In constructing a multiple regression model with two independent variables and it was known that the correlation between and y is .75, and the correlation between and y is .55. Based on this information, the regression model containing both independent variable will explain 65% of the variation in the dependent variable y.
and it was known that the correlation between and y is .75, and the correlation between and y is .55. Based on this information, the regression model containing both independent variable will explain 65% of the variation in the dependent variable y. Unlock Deck
Unlock for access to all 178 flashcards in this deck.
Unlock Deck
k this deck
35
Stepwise regression is especially useful when there are:
A) a great many independent variables
B) few independent variables
C) a great many dependent variables
D) few dependent variables
E) two independent variables
A) a great many independent variables
B) few independent variables
C) a great many dependent variables
D) few dependent variables
E) two independent variables
Unlock Deck
Unlock for access to all 178 flashcards in this deck.
Unlock Deck
k this deck
36
The stepwise regression analysis is best used as a preliminary tool for identifying which of a large number of variables should be considered in the model.
Unlock Deck
Unlock for access to all 178 flashcards in this deck.
Unlock Deck
k this deck
37
If you wish to develop a multiple regression model that includes a qualitative variable; education status, in which the following categories exist: no degree, high school diploma, junior college degree, bachelor degree, and graduate degree, you need to code the categories as 1, 2, 3, 4, and 5.
Unlock Deck
Unlock for access to all 178 flashcards in this deck.
Unlock Deck
k this deck
38
Stepwise regression analysis is most useful when it is anticipated that there are curvilinear relationships between the dependent variable and the potential independent variables.
Unlock Deck
Unlock for access to all 178 flashcards in this deck.
Unlock Deck
k this deck
39
In a multiple regression analysis, the regression equation is obtained. The variable is quantitative variable, and the variable is a dummy variable with values 0 and 1. Given this information, we can interpret the slope coefficient (-3) on variable as follows: Holding constant, if the value of is changed from 0 to 1, the average value of y will decrease by 3 units.
is obtained. The variable is quantitative variable, and the variable is a dummy variable with values 0 and 1. Given this information, we can interpret the slope coefficient (-3) on variable as follows: Holding constant, if the value of is changed from 0 to 1, the average value of y will decrease by 3 units. Unlock Deck
Unlock for access to all 178 flashcards in this deck.
Unlock Deck
k this deck
40
If stepwise procedure is used, a variable selected at an earlier step can be removed from the model if, in the presence of other variables, it no longer contributes significantly to explaining the variation in the dependent variable y.
Unlock Deck
Unlock for access to all 178 flashcards in this deck.
Unlock Deck
k this deck
41
In multiple regression, the prediction equation is the line that minimizes SSE, the sum of squares of the deviations of the observed values y from the predicted values .
is the line that minimizes SSE, the sum of squares of the deviations of the observed values y from the predicted values . Unlock Deck
Unlock for access to all 178 flashcards in this deck.
Unlock Deck
k this deck
42
Which of the following is an advantage of using stepwise regression compared to just entering all the independent variables at one time?
A) There are no advantages of using stepwise regression over entering all the variables at one time.
B) Stepwise regression allows us to observe the effects of multicollinearity more early than when all variables are entered at one time.
C) Stepwise regression will generally produce a model with larger value for the coefficient of determination.
D) All of these.
E) None of these.
Unlock Deck
Unlock for access to all 178 flashcards in this deck.
Unlock Deck
k this deck
43
If you wish to develop a regression model in which the High School Class standing is a qualitative variable with 4 possible levels of response, then you will need to include how many dummy variables?
A) 6
B) 5
C) 4
D) 3
E) none of these
A) 6
B) 5
C) 4
D) 3
E) none of these
Unlock Deck
Unlock for access to all 178 flashcards in this deck.
Unlock Deck
k this deck
44
Having a large number of predictors in a regression model guarantees that the model fit is good.
Unlock Deck
Unlock for access to all 178 flashcards in this deck.
Unlock Deck
k this deck
45
Which of the following statements is true?
A) It is appropriate to compute a correlation coefficient for the relationship between a dummy variable and a dependent variable.
B) If a qualitative variable has m categories, you should use m - 1 dummy variables to incorporate the qualitative variable into a regression model.
C) Dummy variables are used to incorporate qualitative variables into a regression model.
D) All of these.
E) None of these.
Unlock Deck
Unlock for access to all 178 flashcards in this deck.
Unlock Deck
k this deck
46
Same statistical packages print a second statistic, called the adjusted coefficient of determination, which has been adjusted for the degrees of freedom to take into account the sample size and the number of predictor variables.
statistic, called the adjusted coefficient of determination, which has been adjusted for the degrees of freedom to take into account the sample size and the number of predictor variables. Unlock Deck
Unlock for access to all 178 flashcards in this deck.
Unlock Deck
k this deck
47
Assume that a company is tracking their advertising expenditures as they relate to television ( ) and radio advertising ( ). The owner of the company believes that it would improve the regression model to add a third variable that represents the sum of the advertising on radio and television ( = + ). This assessment is generally correct.
) and radio advertising ( ). The owner of the company believes that it would improve the regression model to add a third variable that represents the sum of the advertising on radio and television ( = + ). This assessment is generally correct. Unlock Deck
Unlock for access to all 178 flashcards in this deck.
Unlock Deck
k this deck
48
The coefficient of determination R2 represents the proportion of the total variability in y that can be explained by the regression of y on x. When transformed to a percentage, it represents the percentage reduction in the sum of the squares of the error that can be accomplished by using the model to predict the dependent variable as opposed to just using the sample mean of the dependent variable.
Unlock Deck
Unlock for access to all 178 flashcards in this deck.
Unlock Deck
k this deck
49
In testing the significance of a multiple regression model in which there are three independent variables, the null hypothesis is .
. Unlock Deck
Unlock for access to all 178 flashcards in this deck.
Unlock Deck
k this deck
50
Residuals are the deviations between the observed values of y and their predicted values .
. Unlock Deck
Unlock for access to all 178 flashcards in this deck.
Unlock Deck
k this deck
51
The more predictors that are added to a regression model, the larger the coefficient of determination R2 value will be.
Unlock Deck
Unlock for access to all 178 flashcards in this deck.
Unlock Deck
k this deck
52
In order to test the usefulness of a multiple regression model involving 5 predictor variables and 25 observations, the numerator and denominator degrees of freedom for the critical value of F are 4 and 24, respectively.
Unlock Deck
Unlock for access to all 178 flashcards in this deck.
Unlock Deck
k this deck
53
Which of the following statements is correct?
A) The number of dummy variables that must be added to a regression model is one less than the number of categories for a qualitative independent variable.
B) A dummy variable is incorporated into a regression model if the dependent variable is qualitative.
C) Including a dummy variable into a regression model will simplify the regression results and help people to interpret the meaning of the regression parameters.
D) The number of dummy variables that must be added to a regression model is one more than the number of categories for a qualitative independent variable.
E) All of these.
Unlock Deck
Unlock for access to all 178 flashcards in this deck.
Unlock Deck
k this deck
54
Suppose that one equation has 3 explanatory variables and an F-ratio of 52. Another equation has 5 explanatory variables and an F-ratio of 40. The first equation will always be considered a better model.
Unlock Deck
Unlock for access to all 178 flashcards in this deck.
Unlock Deck
k this deck
55
In reference to the equation , the value 0.63 is the average change in y per unit change in , regardless of the value of .
, the value 0.63 is the average change in y per unit change in , regardless of the value of . Unlock Deck
Unlock for access to all 178 flashcards in this deck.
Unlock Deck
k this deck
56
Let be the least squares estimate of the population coefficient . If the regression assumptions hold true, the test statistic given by has an F distribution with k and n-k-1 degrees of freedom, where n is the number of observations and k is the number of predictor variables.
be the least squares estimate of the population coefficient . If the regression assumptions hold true, the test statistic given by has an F distribution with k and n-k-1 degrees of freedom, where n is the number of observations and k is the number of predictor variables. Unlock Deck
Unlock for access to all 178 flashcards in this deck.
Unlock Deck
k this deck
57
A multiple regression equation includes 5 predictor variables, and the coefficient of multiple determination is 0.7921. The percentage of the variation in y that is explained by the regression equation is 89%.
Unlock Deck
Unlock for access to all 178 flashcards in this deck.
Unlock Deck
k this deck
58
Assume you are considering including two additional qualitative variables into a regression model. The first variable has 4 categories, and the second variable has 4 categories as well. Given this information, how many indicator variables will be incorporated into the model?
A) 8
B) 7
C) 6
D) 5
E) 4
A) 8
B) 7
C) 6
D) 5
E) 4
Unlock Deck
Unlock for access to all 178 flashcards in this deck.
Unlock Deck
k this deck
59
A multiple regression model has the form . The coefficient is interpreted as the change in y per unit change in .
. The coefficient is interpreted as the change in y per unit change in . Unlock Deck
Unlock for access to all 178 flashcards in this deck.
Unlock Deck
k this deck
60
In multiple regression analysis, which procedure permits variables to enter and leave the model at different stages of its development?
A) forward selection
B) residual analysis
C) backward elimination
D) stepwise regression
E) chi-square test
A) forward selection
B) residual analysis
C) backward elimination
D) stepwise regression
E) chi-square test
Unlock Deck
Unlock for access to all 178 flashcards in this deck.
Unlock Deck
k this deck
61
In a multiple regression problem involving 24 observations and three independent variables, the estimated regression equation is . For this model, SST = 800 and SSE = 245. Then, the value of the F statistic for testing the significance of the model is 15.102.
. For this model, SST = 800 and SSE = 245. Then, the value of the F statistic for testing the significance of the model is 15.102. Unlock Deck
Unlock for access to all 178 flashcards in this deck.
Unlock Deck
k this deck
62
If we want to relate a random variable y to two-independent variables and , a regression hyperplane is the three-dimensional equivalent of a regression line that minimizes the sum of the squared vertical deviations between the sample points suspended in y vs. vs. space and their associated multiple regression estimates, all of which lie on this hyperplane.
and , a regression hyperplane is the three-dimensional equivalent of a regression line that minimizes the sum of the squared vertical deviations between the sample points suspended in y vs. vs. space and their associated multiple regression estimates, all of which lie on this hyperplane. Unlock Deck
Unlock for access to all 178 flashcards in this deck.
Unlock Deck
k this deck
63
A multiple regression model involves 40 observations and 4 independent variables produces SST = 2,000 and SSR = 1,608. The value of MSE is 11.2.
Unlock Deck
Unlock for access to all 178 flashcards in this deck.
Unlock Deck
k this deck
64
In multiple regression, the descriptor "multiple" refers to more than one dependent variable.
Unlock Deck
Unlock for access to all 178 flashcards in this deck.
Unlock Deck
k this deck
65
In regression analysis, a p-value provides the probability (judged by the t-value associated with an estimated regression coefficient) of being true, given the claim : The true regression coefficient equals 0.
being true, given the claim : The true regression coefficient equals 0. Unlock Deck
Unlock for access to all 178 flashcards in this deck.
Unlock Deck
k this deck
66
In a multiple regression problem, the regression equation is . The estimated value for y when and is 48.
. The estimated value for y when and is 48. Unlock Deck
Unlock for access to all 178 flashcards in this deck.
Unlock Deck
k this deck
67
For each x term in the multiple regression equation, the corresponding is referred to as a partial regression coefficient.
is referred to as a partial regression coefficient. Unlock Deck
Unlock for access to all 178 flashcards in this deck.
Unlock Deck
k this deck
68
A multiple regression equation includes 5 independent variables, and the coefficient of determination is 0.81. Then, the percentage of the variation in y that is explained by the regression equation is 90%.
Unlock Deck
Unlock for access to all 178 flashcards in this deck.
Unlock Deck
k this deck
69
Multiple regression is the process of using several independent variables to predict a number of dependent variables.
Unlock Deck
Unlock for access to all 178 flashcards in this deck.
Unlock Deck
k this deck
70
A coefficient of multiple correlation is a measure of how well an estimated regression plane (or hyperplane) fits the sample data on which it is based.
Unlock Deck
Unlock for access to all 178 flashcards in this deck.
Unlock Deck
k this deck
71
An estimated partial-regression coefficient gives the partial change in y for a unit change in that independent variable, while holding other independent variables constant.
Unlock Deck
Unlock for access to all 178 flashcards in this deck.
Unlock Deck
k this deck
72
Multiple regression analysis is a type of regression analysis in which several independent variables are used to estimate the value of an unknown dependent variable; hence, each of these predictor variables explains part of the total variation of the dependent variable.
Unlock Deck
Unlock for access to all 178 flashcards in this deck.
Unlock Deck
k this deck
73
In reference to the equation: , the value -0.80 is the y-intercept.
, the value -0.80 is the y-intercept. Unlock Deck
Unlock for access to all 178 flashcards in this deck.
Unlock Deck
k this deck
74
In reference to the equation , the value -0.75 is the intercept.
, the value -0.75 is the intercept. Unlock Deck
Unlock for access to all 178 flashcards in this deck.
Unlock Deck
k this deck
75
A coefficient of multiple correlation is denoted by and equals the proportion of the total variation in the values of the dependent variable, y that is explained by the estimated multiple regression of y on , , and possibly additional independent variable ( , and so on).
and equals the proportion of the total variation in the values of the dependent variable, y that is explained by the estimated multiple regression of y on , , and possibly additional independent variable ( , and so on). Unlock Deck
Unlock for access to all 178 flashcards in this deck.
Unlock Deck
k this deck
76
In testing the significance of a multiple regression model in which there are three independent variables, the null hypothesis is .
. Unlock Deck
Unlock for access to all 178 flashcards in this deck.
Unlock Deck
k this deck
77
An estimated partial-regression coefficient is the coefficient of a dependent variable in an estimated multiple-regression equation.
Unlock Deck
Unlock for access to all 178 flashcards in this deck.
Unlock Deck
k this deck
78
In multiple regression analysis, the adjusted multiple coefficient of determination is adjusted for the number of independent variables and the sample size.
Unlock Deck
Unlock for access to all 178 flashcards in this deck.
Unlock Deck
k this deck
79
A multiple regression analysis includes 25 data points and 4 independent variables produces SST = 400 and SSR = 300. Then, the multiple standard error of estimate is 5.
Unlock Deck
Unlock for access to all 178 flashcards in this deck.
Unlock Deck
k this deck
80
Multiple linear regression is an extension of simple linear regression to allow for more than one dependent variable.
Unlock Deck
Unlock for access to all 178 flashcards in this deck.
Unlock Deck
k this deck
Unlock Deck
Unlock for access to all 178 flashcards in this deck.


