Deck 11: Additional Topics Using Inference
Full screen (f)
Question
Question
Question
Question
For all Hypothesis tests, please provide the following information:
(i) What is the level of significance State the null and alternate hypotheses.
(ii) Check Requirements What sampling distribution will you use What assumptions are you making What is the value of the sample test statistic
(iii) Find (or estimate) the P -value. Sketch the sampling distribution and show the area corresponding to the P -value.
(iv) Based on your answers in parts (i)-(iii), will you reject or fail to reject the null hypothesis Are the data statistically significant at level
(v) Interpret your conclusion in the context of the application.
Testing Variances: Iris Random samples of two species of iris gave the following petal length (in cm) (Reference: R. A. Fisher, Annals of Eugenics , Vol. 7):
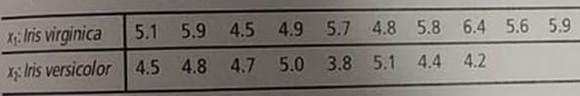
Use a 5% level of significance to test the claim that the population standard deviation of x 1 larger than 0.55.
(i) What is the level of significance State the null and alternate hypotheses.
(ii) Check Requirements What sampling distribution will you use What assumptions are you making What is the value of the sample test statistic
(iii) Find (or estimate) the P -value. Sketch the sampling distribution and show the area corresponding to the P -value.
(iv) Based on your answers in parts (i)-(iii), will you reject or fail to reject the null hypothesis Are the data statistically significant at level
(v) Interpret your conclusion in the context of the application.
Testing Variances: Iris Random samples of two species of iris gave the following petal length (in cm) (Reference: R. A. Fisher, Annals of Eugenics , Vol. 7):
Use a 5% level of significance to test the claim that the population standard deviation of x 1 larger than 0.55.
Question
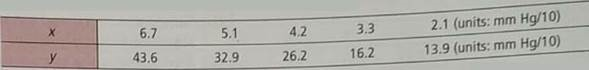
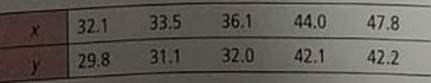
Physiology: Oxygen Aviation and high-altitude physiology is a specialty in the study of medicine. Let x = partial pressure of oxygen in the alveoli (air cells in the lungs) when breathing naturally available air. Let y = partial pressure when breathing pure oxygen. The ( x, y ) data pairs correspond to elevations from 10,000 feet to 30,000 feet in 5000-foot intervals for a random sample of volunteers. Although the medical data were collected using airplanes, they apply equally well to Mt. Everest climbers (summit 29,028 feet).
 (Based on information taken from Textbook of Medical Physiology By A. C. Guyton M.D.)
(a) Verify that x = 21.4, y = 132.8, x 2 = 103.84, y 2 = 4125.46, xy = 652.6, and r 0.984.
(b) Use a 1% level of significance to test the claim that 0.
(c) Verify that S e 2.5319, a 2.869, and b 6.876.
(d) Find the predicted pressure when breathing pure oxygen if the pressure from breathing available air is x = 4.0.
(e) Find a 90% confidence interval for y when x = 4.0.
(f) Use a 1% level of significance to test the claim that 0.
(Based on information taken from Textbook of Medical Physiology By A. C. Guyton M.D.)(a) Verify that x = 21.4, y = 132.8, x 2 = 103.84, y 2 = 4125.46, xy = 652.6, and r 0.984.
(b) Use a 1% level of significance to test the claim that 0.
(c) Verify that S e 2.5319, a 2.869, and b 6.876.
(d) Find the predicted pressure when breathing pure oxygen if the pressure from breathing available air is x = 4.0.
(e) Find a 90% confidence interval for y when x = 4.0.
(f) Use a 1% level of significance to test the claim that 0.
Question
Question
For Problems 5-14, please provide the following information.
(a) What is the level of significance State the null and alternate hypotheses.
(b) Find the value of the chi-square statistic for the sample. Are all the expected frequencies greater than 5 What sampling distribution will you use What are the degrees of freedom
(c) Find or estimate the P -value of the sample test statistic.
(d) Based on your answers in parts (a)-(c), will you reject or fail to reject the null hypothesis that the population fits the specified distribution of categories
(e) Interpret your conclusion in the context of the application.
Census: Age The age distribution of the Canadian population and the age distribution of a random sample of 455 residents in the Indian community of Red Lake Village (Northwest Territories) are shown below (based on U.S. Bureau of the Census, International Data Base ):
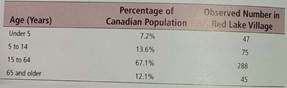
Use a 5% level of significance to test the claim that the age distribution of the general Canadian population fits the age distribution of the residents of Red Lake Village.
(a) What is the level of significance State the null and alternate hypotheses.
(b) Find the value of the chi-square statistic for the sample. Are all the expected frequencies greater than 5 What sampling distribution will you use What are the degrees of freedom
(c) Find or estimate the P -value of the sample test statistic.
(d) Based on your answers in parts (a)-(c), will you reject or fail to reject the null hypothesis that the population fits the specified distribution of categories
(e) Interpret your conclusion in the context of the application.
Census: Age The age distribution of the Canadian population and the age distribution of a random sample of 455 residents in the Indian community of Red Lake Village (Northwest Territories) are shown below (based on U.S. Bureau of the Census, International Data Base ):
Use a 5% level of significance to test the claim that the age distribution of the general Canadian population fits the age distribution of the residents of Red Lake Village.
Question
Question
Statistical Literacy How does the t value for the sample correlation coefficient r compare to the t value for the corresponding slope b of the sample least-squares line
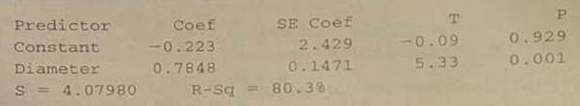
Using Computer Printouts Problems 5 and 6 use the following information. Prehistoric pottery vessels are usually found as sherds (broken pieces) and are carefully reconstructed if enough sherds can be found. Information taken from Mimbres Mogollon Archaeology by A. I Woolsey and A. J. McIntyre (University of New Mexico Press) provides data relating x = body diameter in centimeters and y = height in centimeters of prehistoric vessels reconstructed from sherds found at a prehistoric site. The following Minitab Printout provides an analysis of the data:
Using Computer Printouts Problems 5 and 6 use the following information. Prehistoric pottery vessels are usually found as sherds (broken pieces) and are carefully reconstructed if enough sherds can be found. Information taken from Mimbres Mogollon Archaeology by A. I Woolsey and A. J. McIntyre (University of New Mexico Press) provides data relating x = body diameter in centimeters and y = height in centimeters of prehistoric vessels reconstructed from sherds found at a prehistoric site. The following Minitab Printout provides an analysis of the data:
Question
Baseball: Batting Average and Home Runs In baseball, is there a linear correlation between batting average and home run percentage Let x represent the batting average of a professional baseball player, and let y represent the player's home run percentage (number of home runs per 100 times at bat). A random sample of n = 7 professional baseball players gave the following information (Reference: The Baseball Encyclopedia , Macmillan Publishing Company).
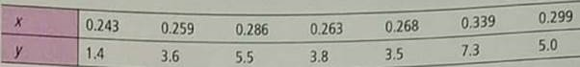
x = 1.957; x 2 = 0.553; y 2 30.1; y 2 = 150.15; xy 8.753
(a) Verify that S e 0.647.
(b) Verify that r 0.984. Test that is positive. Use = 0.01.
(c) Verify that b 55.166. Test that is positive. Use = 0.01.
(d) Verify that
 . Find a 90% confidence interval for the predicted home run percentage for a player with a batting average of 0.0310.
x = 1.957; x 2 = 0.553; y 2 30.1; y 2 = 150.15; xy 8.753
(a) Verify that S e 0.647.
(b) Verify that r 0.984. Test that is positive. Use = 0.01.
(c) Verify that b 55.166. Test that is positive. Use = 0.01.
(d) Verify that
. Find a 90% confidence interval for the predicted home run percentage for a player with a batting average of 0.0310. Question
For Problems 9-19, please provide the following information:
(a) What is the level of significance State the null and alternate hypotheses.
(b) Check Requirements Find the value of the chi-square statistic for the sample. Are all the expected frequencies greater than 5 What sampling distribution will you use What are the degrees of freedom
(c) Find or estimate the P -value of the sample test statistic.
(d) Based on your answers in parts (a)-(c), will you reject or fail to reject the null hypothesis of independence
(e) Interpret your conclusion in the context of the application.
Use the expected values E to the hundredths place.
Psychology: Myers-Briggs The following table shows the Myers-Briggs personality preferences for a random sample of 406 people in the listed professions ( Myers-Briggs Type Indicator Atlas of Type Tables , by Macdaid, McCaulley, and Kainz). E refers to extroverted and I refers to introverted.
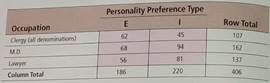
Use the chi-square test to determine if the listed occupations and personality preferences are independent at the 0.05 level of signicance.
(a) What is the level of significance State the null and alternate hypotheses.
(b) Check Requirements Find the value of the chi-square statistic for the sample. Are all the expected frequencies greater than 5 What sampling distribution will you use What are the degrees of freedom
(c) Find or estimate the P -value of the sample test statistic.
(d) Based on your answers in parts (a)-(c), will you reject or fail to reject the null hypothesis of independence
(e) Interpret your conclusion in the context of the application.
Use the expected values E to the hundredths place.
Psychology: Myers-Briggs The following table shows the Myers-Briggs personality preferences for a random sample of 406 people in the listed professions ( Myers-Briggs Type Indicator Atlas of Type Tables , by Macdaid, McCaulley, and Kainz). E refers to extroverted and I refers to introverted.
Use the chi-square test to determine if the listed occupations and personality preferences are independent at the 0.05 level of signicance.
Question
For Problems 5-14, please provide the following information.
(a) What is the level of significance State the null and alternate hypotheses.
(b) Find the value of the chi-square statistic for the sample. Are all the expected frequencies greater than 5 What sampling distribution will you use What are the degrees of freedom
(c) Find or estimate the P -value of the sample test statistic.
(d) Based on your answers in parts (a)-(c), will you reject or fail to reject the null hypothesis that the population fits the specified distribution of categories
(e) Interpret your conclusion in the context of the application.
Census: Type of Household The type of household for the U.S. population and for a random sample of 411 households from the community of Dove Creek, Montana, are shown (based on Statistical Abstract of the United States ):
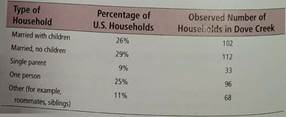
Use a 5% level of significance to test the claim that the distribution of U.S. households fits the Dove Creek distribution.
(a) What is the level of significance State the null and alternate hypotheses.
(b) Find the value of the chi-square statistic for the sample. Are all the expected frequencies greater than 5 What sampling distribution will you use What are the degrees of freedom
(c) Find or estimate the P -value of the sample test statistic.
(d) Based on your answers in parts (a)-(c), will you reject or fail to reject the null hypothesis that the population fits the specified distribution of categories
(e) Interpret your conclusion in the context of the application.
Census: Type of Household The type of household for the U.S. population and for a random sample of 411 households from the community of Dove Creek, Montana, are shown (based on Statistical Abstract of the United States ):
Use a 5% level of significance to test the claim that the distribution of U.S. households fits the Dove Creek distribution.
Question
Question
Question
New Car: Negotiating Price Suppose you are interested in buying a new Toyota Corolla. You are standing on the scales lot looking at a model with different optioms. The list price on the vehicle. As a salesperson approaches, you wonder what the dealer invoice price is for this model with its options. The following data are based on information taken from Consumer Guide (Vol. 677). Let x be the list price (in thousands of dollars) for a random selection of Toyota Corolla of different models and options. Let y be the dealer invoice (in thousands of dollars) for the given vehicle.
 (a) Verify that x = 79.6, y = 72.1, x 2 = 1057.76, y 2 = 867.49, xy = 957.84, and r 0.956.
(b) Use a 1% level of significance to test the claim that 0.
(c) Verify that S e 0.1527, a 1.965, and b 0.758.
(d) Find the predicted dealer invoice when the list price is x = 14 (thousand dollars).
(e) Find a 85% confidence interval for y when x = 14 (thousand dollars).
(f) Use a 1% level of significance to test the claim that 0.
(a) Verify that x = 79.6, y = 72.1, x 2 = 1057.76, y 2 = 867.49, xy = 957.84, and r 0.956.(b) Use a 1% level of significance to test the claim that 0.
(c) Verify that S e 0.1527, a 1.965, and b 0.758.
(d) Find the predicted dealer invoice when the list price is x = 14 (thousand dollars).
(e) Find a 85% confidence interval for y when x = 14 (thousand dollars).
(f) Use a 1% level of significance to test the claim that 0.
Question
For Problems 9-19, please provide the following information:
(a) What is the level of significance State the null and alternate hypotheses.
(b) Check Requirements Find the value of the chi-square statistic for the sample. Are all the expected frequencies greater than 5 What sampling distribution will you use What are the degrees of freedom
(c) Find or estimate the P -value of the sample test statistic.
(d) Based on your answers in parts (a)-(c), will you reject or fail to reject the null hypothesis of independence
(e) Interpret your conclusion in the context of the application.
Use the expected values E to the hundredths place.
Psychology: Myers-Briggs The following table shows the Myers-Briggs personality preferences for a random sample of 519 people in the listed professions ( Myers-Briggs Type Indicator Atlas of Type Tables , by Macdaid, McCaulley, and Kainz). T refers to thinking and F refers to feeling.
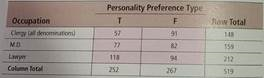
Use the chi-square test to determine if the listed occupations and personality preferences are independent at the 0.01 level of signicance.
(a) What is the level of significance State the null and alternate hypotheses.
(b) Check Requirements Find the value of the chi-square statistic for the sample. Are all the expected frequencies greater than 5 What sampling distribution will you use What are the degrees of freedom
(c) Find or estimate the P -value of the sample test statistic.
(d) Based on your answers in parts (a)-(c), will you reject or fail to reject the null hypothesis of independence
(e) Interpret your conclusion in the context of the application.
Use the expected values E to the hundredths place.
Psychology: Myers-Briggs The following table shows the Myers-Briggs personality preferences for a random sample of 519 people in the listed professions ( Myers-Briggs Type Indicator Atlas of Type Tables , by Macdaid, McCaulley, and Kainz). T refers to thinking and F refers to feeling.
Use the chi-square test to determine if the listed occupations and personality preferences are independent at the 0.01 level of signicance.
Question
For Problems 5-14, please provide the following information.
(a) What is the level of significance State the null and alternate hypotheses.
(b) Find the value of the chi-square statistic for the sample. Are all the expected frequencies greater than 5 What sampling distribution will you use What are the degrees of freedom
(c) Find or estimate the P -value of the sample test statistic.
(d) Based on your answers in parts (a)-(c), will you reject or fail to reject the null hypothesis that the population fits the specified distribution of categories
(e) Interpret your conclusion in the context of the application.
Archaeology: Stone Tools The types of raw materials used to construct stone tools found at an archaeological site Casa del Rito are shown below ( Bandelier Archaeological Excavation project , edited by Kohler and Root). A random sample of 1486 stone tools was obtained from a current excavation site.
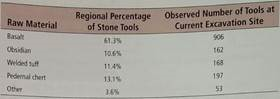
Use a 1% level of significance to test the claim that the regional distribution of raw materials fits the distribution at the current excavation site.
(a) What is the level of significance State the null and alternate hypotheses.
(b) Find the value of the chi-square statistic for the sample. Are all the expected frequencies greater than 5 What sampling distribution will you use What are the degrees of freedom
(c) Find or estimate the P -value of the sample test statistic.
(d) Based on your answers in parts (a)-(c), will you reject or fail to reject the null hypothesis that the population fits the specified distribution of categories
(e) Interpret your conclusion in the context of the application.
Archaeology: Stone Tools The types of raw materials used to construct stone tools found at an archaeological site Casa del Rito are shown below ( Bandelier Archaeological Excavation project , edited by Kohler and Root). A random sample of 1486 stone tools was obtained from a current excavation site.
Use a 1% level of significance to test the claim that the regional distribution of raw materials fits the distribution at the current excavation site.
Question
Question
For all Hypothesis tests, please provide the following information:
(i) What is the level of significance State the null and alternate hypotheses.
(ii) Check Requirements What sampling distribution will you use What assumptions are you making What is the value of the sample test statistic
(iii) Find (or estimate) the P -value. Sketch the sampling distribution and show the area corresponding to the P -value.
(iv) Based on your answers in parts (i)-(iii), will you reject or fail to reject the null hypothesis Are the data statistically significant at level
(v) Interpret your conclusion in the context of the application.
Testing Paired Differences Phosphorus is a chemical that is found in many household cleaning products. Unfortunately, phosphorus also finds its way into surface water, where it can harm fish, plants, and other wildlife. Two methods of phosphorus reduction are being studied. At a random sample of 7 locations, both methods were used and the total phosphorus reduction (mg/L) was reduced (Reference: EPA report 832-R-93-005).
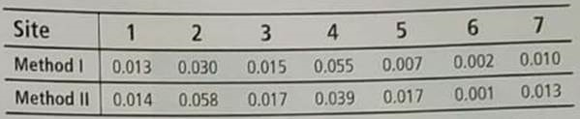
Do these data indicate a difference (either way) in the average reduction of phosphorus between the two methods Use = 0.05
(i) What is the level of significance State the null and alternate hypotheses.
(ii) Check Requirements What sampling distribution will you use What assumptions are you making What is the value of the sample test statistic
(iii) Find (or estimate) the P -value. Sketch the sampling distribution and show the area corresponding to the P -value.
(iv) Based on your answers in parts (i)-(iii), will you reject or fail to reject the null hypothesis Are the data statistically significant at level
(v) Interpret your conclusion in the context of the application.
Testing Paired Differences Phosphorus is a chemical that is found in many household cleaning products. Unfortunately, phosphorus also finds its way into surface water, where it can harm fish, plants, and other wildlife. Two methods of phosphorus reduction are being studied. At a random sample of 7 locations, both methods were used and the total phosphorus reduction (mg/L) was reduced (Reference: EPA report 832-R-93-005).
Do these data indicate a difference (either way) in the average reduction of phosphorus between the two methods Use = 0.05
Question
New Car: Negotiating Price Suppose you are interested in buying a new Lincoln Navigator or Town Car. You are standing on the sales lot looking at a model with different options. The list price is on the vehicle. As a salesperson approaches, you wonder what the dealer invoice price is for this model with its options. The following data are based on information taken from Consumer Guide (Vol. 677). Let x be the list price (in thousands of dollars) for a random selection of these cars of different models and options. Let y be the dealer invoice (in thousands of dollars) for the given vehicle.
(a) Verify that x = 193.2, y = 177.2, x 2 = 7676.71, y 2 = 6432.5, xy = 7023.19, and r 0.977.
(b) Use a 1% level of significance to test the claim that 0.
(c) Verify that S e 1.5223, a 1.4084, and b 0.8794.
(d) Find the predicted dealer invoice when the list price is x = 40 (thousand dollars).
(e) Find a 95% confidence interval for y when x = 40 (thousand dollars).
(f) Use a 1% level of significance to test the claim that 0.
Question
For Problems 9-19, please provide the following information:
(a) What is the level of significance State the null and alternate hypotheses.
(b) Check Requirements Find the value of the chi-square statistic for the sample. Are all the expected frequencies greater than 5 What sampling distribution will you use What are the degrees of freedom
(c) Find or estimate the P -value of the sample test statistic.
(d) Based on your answers in parts (a)-(c), will you reject or fail to reject the null hypothesis of independence
(e) Interpret your conclusion in the context of the application.
Use the expected values E to the hundredths place.
Archaeology: Pottery The following table shows site type and type of pottery for a random sample of 628 sherds at a location in Sand Canyon Archaeological Project, Colorado ( The Sand Canyon Archaeological Project , edited by Lipe):
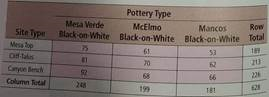
Use the chi-square test to determine if site type and pottery type are independent at the 0.01 level of signicance.
(a) What is the level of significance State the null and alternate hypotheses.
(b) Check Requirements Find the value of the chi-square statistic for the sample. Are all the expected frequencies greater than 5 What sampling distribution will you use What are the degrees of freedom
(c) Find or estimate the P -value of the sample test statistic.
(d) Based on your answers in parts (a)-(c), will you reject or fail to reject the null hypothesis of independence
(e) Interpret your conclusion in the context of the application.
Use the expected values E to the hundredths place.
Archaeology: Pottery The following table shows site type and type of pottery for a random sample of 628 sherds at a location in Sand Canyon Archaeological Project, Colorado ( The Sand Canyon Archaeological Project , edited by Lipe):
Use the chi-square test to determine if site type and pottery type are independent at the 0.01 level of signicance.
Question
For Problems 5-14, please provide the following information.
(a) What is the level of significance State the null and alternate hypotheses.
(b) Find the value of the chi-square statistic for the sample. Are all the expected frequencies greater than 5 What sampling distribution will you use What are the degrees of freedom
(c) Find or estimate the P -value of the sample test statistic.
(d) Based on your answers in parts (a)-(c), will you reject or fail to reject the null hypothesis that the population fits the specified distribution of categories
(e) Interpret your conclusion in the context of the application.
Ecology: Deer The types of browse favored by deer are shown in the following table ( The Mule Deer of Mesa Verde National Park , edited by Mierau and Schmidt). Using binoculars, volunteers observed the feeding habits of a random sample of 320 deer.
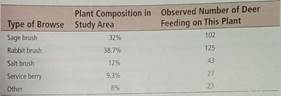
Use a 5% level of significance to test the claim that the natural distribution of browse fits the deer feeding pattern.
(a) What is the level of significance State the null and alternate hypotheses.
(b) Find the value of the chi-square statistic for the sample. Are all the expected frequencies greater than 5 What sampling distribution will you use What are the degrees of freedom
(c) Find or estimate the P -value of the sample test statistic.
(d) Based on your answers in parts (a)-(c), will you reject or fail to reject the null hypothesis that the population fits the specified distribution of categories
(e) Interpret your conclusion in the context of the application.
Ecology: Deer The types of browse favored by deer are shown in the following table ( The Mule Deer of Mesa Verde National Park , edited by Mierau and Schmidt). Using binoculars, volunteers observed the feeding habits of a random sample of 320 deer.
Use a 5% level of significance to test the claim that the natural distribution of browse fits the deer feeding pattern.
Question
Question
Critical Thinking: Using Information from a Computer Display to Test for Significance Refer to the Minitab printout regarding prehistoric pottery.
(a) Minitab calls the explanatory variable the predictor variable. Which is the predictor variable, the diameter of the pot or the height
(b) For the least-squares line
 , what is the value of the constant a What is the value of the slope b ( Note : the slope is the coefficient of the predictor variable). Write the equation of the least-squares line.
(c) The P -value for a two-tailed test corresponding to each coefficient is listed under P. The t value corresponding to the coefficient is listed under T. What is the P -value of the slope What are the hypotheses for a two-tailed test = 0 Based on the P -value in the printout, do we reject or fail to reject the null hypothesis for = 0.01
(d) Recall that the t value and resulting P -value of the slope b equal the t value and resulting P -value of the corresponding correlation coefficient r. To find the value of the sample correlation coefficient r , take the square root of the R-Sq value shown in the display. What is the value of r Consider a two-tailed test for . Based on the P -value shown in the Minitab display, is the correlation coefficient significant at the 1% level of significance
(a) Minitab calls the explanatory variable the predictor variable. Which is the predictor variable, the diameter of the pot or the height
(b) For the least-squares line
, what is the value of the constant a What is the value of the slope b ( Note : the slope is the coefficient of the predictor variable). Write the equation of the least-squares line.(c) The P -value for a two-tailed test corresponding to each coefficient is listed under P. The t value corresponding to the coefficient is listed under T. What is the P -value of the slope What are the hypotheses for a two-tailed test = 0 Based on the P -value in the printout, do we reject or fail to reject the null hypothesis for = 0.01
(d) Recall that the t value and resulting P -value of the slope b equal the t value and resulting P -value of the corresponding correlation coefficient r. To find the value of the sample correlation coefficient r , take the square root of the R-Sq value shown in the display. What is the value of r Consider a two-tailed test for . Based on the P -value shown in the Minitab display, is the correlation coefficient significant at the 1% level of significance
Question
Question
For Problems 9-19, please provide the following information:
(a) What is the level of significance State the null and alternate hypotheses.
(b) Check Requirements Find the value of the chi-square statistic for the sample. Are all the expected frequencies greater than 5 What sampling distribution will you use What are the degrees of freedom
(c) Find or estimate the P -value of the sample test statistic.
(d) Based on your answers in parts (a)-(c), will you reject or fail to reject the null hypothesis of independence
(e) Interpret your conclusion in the context of the application.
Use the expected values E to the hundredths place.
Archaeology: Pottery The following table shows ceremonial ranking and type of pottery sherd for a random sample of 434 sherds at a location in the Sand Canyon Archaeological Project, Colorado ( The Architecture of Social Integration in Prehistoric Pueblos , edited by Lipe and Hegmon):
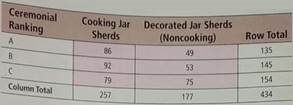
Use a chi-square test to determine if ceremonial ranking and pottery type are independent at the 0.05 level of significance.
(a) What is the level of significance State the null and alternate hypotheses.
(b) Check Requirements Find the value of the chi-square statistic for the sample. Are all the expected frequencies greater than 5 What sampling distribution will you use What are the degrees of freedom
(c) Find or estimate the P -value of the sample test statistic.
(d) Based on your answers in parts (a)-(c), will you reject or fail to reject the null hypothesis of independence
(e) Interpret your conclusion in the context of the application.
Use the expected values E to the hundredths place.
Archaeology: Pottery The following table shows ceremonial ranking and type of pottery sherd for a random sample of 434 sherds at a location in the Sand Canyon Archaeological Project, Colorado ( The Architecture of Social Integration in Prehistoric Pueblos , edited by Lipe and Hegmon):
Use a chi-square test to determine if ceremonial ranking and pottery type are independent at the 0.05 level of significance.
Question
For Problems 5-14, please provide the following information.
(a) What is the level of significance State the null and alternate hypotheses.
(b) Find the value of the chi-square statistic for the sample. Are all the expected frequencies greater than 5 What sampling distribution will you use What are the degrees of freedom
(c) Find or estimate the P -value of the sample test statistic.
(d) Based on your answers in parts (a)-(c), will you reject or fail to reject the null hypothesis that the population fits the specified distribution of categories
(e) Interpret your conclusion in the context of the application.
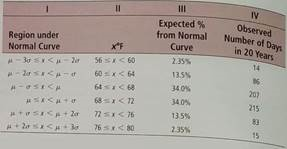
Meteorology: Normal Distribution The following problem is based on information from the National Oceanic and Atmospheric Administration (NOAA) Environmental Data Service. Let x be a random variable that represents the average daily temperature (in degrees Fahrenheit) in July in the town of Kit Carson, Colorado. The x distribution has a mean of approximately 75°F and standard deviation of approximately 8°F. A 20-year study (620 July days) gave the entries in the rightmost column of the following table.
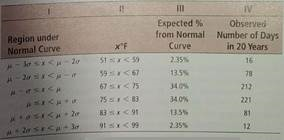
(i) Remember that = 75 and = 8. Examine Figure 7-3 in Chapter 7. Write a brief explanation for Columns I, II, and III in the context of this problem.
(ii) Use a 1% level of significance to test the claim that the average daily July temperature follows a normal distribution with = 75 and = 8.
(a) What is the level of significance State the null and alternate hypotheses.
(b) Find the value of the chi-square statistic for the sample. Are all the expected frequencies greater than 5 What sampling distribution will you use What are the degrees of freedom
(c) Find or estimate the P -value of the sample test statistic.
(d) Based on your answers in parts (a)-(c), will you reject or fail to reject the null hypothesis that the population fits the specified distribution of categories
(e) Interpret your conclusion in the context of the application.
Meteorology: Normal Distribution The following problem is based on information from the National Oceanic and Atmospheric Administration (NOAA) Environmental Data Service. Let x be a random variable that represents the average daily temperature (in degrees Fahrenheit) in July in the town of Kit Carson, Colorado. The x distribution has a mean of approximately 75°F and standard deviation of approximately 8°F. A 20-year study (620 July days) gave the entries in the rightmost column of the following table.
(i) Remember that = 75 and = 8. Examine Figure 7-3 in Chapter 7. Write a brief explanation for Columns I, II, and III in the context of this problem.
(ii) Use a 1% level of significance to test the claim that the average daily July temperature follows a normal distribution with = 75 and = 8.
Question
Question
Question
Expand Your Knowledge: Student's t Value for Sample r and for Sample b It is not obvious from the formulas, but the values of the sample test statistic t for the correlation coefficient and for the slope of the least-squares line are equal for the same data set. This fact is based on the relation.
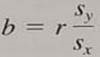
where s y and s x are the sample standard deviations of the x and y values, respectively.
(a) Many computer software packages give the t value and corresponding P -value for b. If is significant, is significant
(b) When doing statistical tests "by hand," it is easier to computer the sample test statistic t for the sample correlation coefficient r than it is to compute the sample test statistic t for the slope b of the sample least-squares line. Compare the results of parts (b) and (f) for Problems 7-12 of this problem set. Is the sample test statistic t for r the same as the corresponding test statistic for b If you conclude that is positive, can you conclude that is positive at the same level of significance If you conclude that is not significant, is also not significant at the same level of significance
Question
For Problems 9-19, please provide the following information:
(a) What is the level of significance State the null and alternate hypotheses.
(b) Check Requirements Find the value of the chi-square statistic for the sample. Are all the expected frequencies greater than 5 What sampling distribution will you use What are the degrees of freedom
(c) Find or estimate the P -value of the sample test statistic.
(d) Based on your answers in parts (a)-(c), will you reject or fail to reject the null hypothesis of independence
(e) Interpret your conclusion in the context of the application.
Use the expected values E to the hundredths place.
Ecology: Buffalo The following table shows age distribution and location of a random sample of 166 buffalo in Yellowstone National Park (based on information from The Bison of Yellowstone National Park , National Park Service Scientific Monograph Series):
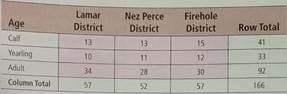
Use a chi-square test to determine if age distribution and location are independent at the 0.05 level of significance.
(a) What is the level of significance State the null and alternate hypotheses.
(b) Check Requirements Find the value of the chi-square statistic for the sample. Are all the expected frequencies greater than 5 What sampling distribution will you use What are the degrees of freedom
(c) Find or estimate the P -value of the sample test statistic.
(d) Based on your answers in parts (a)-(c), will you reject or fail to reject the null hypothesis of independence
(e) Interpret your conclusion in the context of the application.
Use the expected values E to the hundredths place.
Ecology: Buffalo The following table shows age distribution and location of a random sample of 166 buffalo in Yellowstone National Park (based on information from The Bison of Yellowstone National Park , National Park Service Scientific Monograph Series):
Use a chi-square test to determine if age distribution and location are independent at the 0.05 level of significance.
Question
For Problems 5-14, please provide the following information.
(a) What is the level of significance State the null and alternate hypotheses.
(b) Find the value of the chi-square statistic for the sample. Are all the expected frequencies greater than 5 What sampling distribution will you use What are the degrees of freedom
(c) Find or estimate the P -value of the sample test statistic.
(d) Based on your answers in parts (a)-(c), will you reject or fail to reject the null hypothesis that the population fits the specified distribution of categories
(e) Interpret your conclusion in the context of the application.
Meteorology: Normal Distribution Let x be a random variable that represents the average daily temperature (in degrees Fahrenheit) in January for the town of Hana, Maui. The x variable has a mean of approximately 68°F and standard deviation of approximately 4°F (see reference in Problem 9). A 20-year study (620 January days) gave the entries in the rightmost column of the following table.
(i) Remember that = 68 and = 4. Examine Figure 7-3 in Chapter 7. Write a brief explanation for columns I, II, and III in the context of this problem.
(ii) Use a 1% level of significance to test the claim that the average daily January temperature follows a normal distribution with = 68 and = 4.
Question
Question
For all Hypothesis tests, please provide the following information:
(i) What is the level of significance State the null and alternate hypotheses.
(ii) Check Requirements What sampling distribution will you use What assumptions are you making What is the value of the sample test statistic
(iii) Find (or estimate) the P -value. Sketch the sampling distribution and show the area corresponding to the P -value.
(iv) Based on your answers in parts (i)-(iii), will you reject or fail to reject the null hypothesis Are the data statistically significant at level
(v) Interpret your conclusion in the context of the application.
Testing and Estimating m 1 - m 2 , s 1 and s 2 Unknown In the airline business. "on-time" flight arrival is important for connecting flights and general customer satisfaction. Is there a difference between summer and winter average on-time flight arrivals Let x 1 be a random variable that represents percentage of on-time arrivals at major airports in the summer. Let x 2 be a random variable that represents percentage of on-time arrivals at major airports in the winter. A random sample of n 1 = 16 major airports showed that
 , with s 1 = 5.2%. A random sample of n 2 = 18 major airports showed that
 , with s 2 = 8.6% (Reference: Statistical Abstract of the United States ).
(a) Does this information indicate a difference (either way) in the population mean percentage of ontime arrivals for summer compared to winter Use = 0.05.
(b)Find a 95% confidence interval for µ 1 µ 2.
(c) What assumptions about the original populations have you made for the methods used
(i) What is the level of significance State the null and alternate hypotheses.
(ii) Check Requirements What sampling distribution will you use What assumptions are you making What is the value of the sample test statistic
(iii) Find (or estimate) the P -value. Sketch the sampling distribution and show the area corresponding to the P -value.
(iv) Based on your answers in parts (i)-(iii), will you reject or fail to reject the null hypothesis Are the data statistically significant at level
(v) Interpret your conclusion in the context of the application.
Testing and Estimating m 1 - m 2 , s 1 and s 2 Unknown In the airline business. "on-time" flight arrival is important for connecting flights and general customer satisfaction. Is there a difference between summer and winter average on-time flight arrivals Let x 1 be a random variable that represents percentage of on-time arrivals at major airports in the summer. Let x 2 be a random variable that represents percentage of on-time arrivals at major airports in the winter. A random sample of n 1 = 16 major airports showed that
, with s 1 = 5.2%. A random sample of n 2 = 18 major airports showed that , with s 2 = 8.6% (Reference: Statistical Abstract of the United States ).(a) Does this information indicate a difference (either way) in the population mean percentage of ontime arrivals for summer compared to winter Use = 0.05.
(b)Find a 95% confidence interval for µ 1 µ 2.
(c) What assumptions about the original populations have you made for the methods used
Question
Expand Your Knowledge: Time Series and Serial Correlation Serial Correlation , also known as autocorrelation , describes the extent to which the result in one period of a time series is related to the result in the text period. A time series with high serial correlation is said to be very predictable from one period to the next. If the serial correlation is low (or near zero), the time series is considered to be much less predictable. For more information about serial correlation, see the book Ibbotson SBBI published by Morningstar.
A research veterinarian at a major university has developed a new vaccine to protect horses from West Nile virus. An important question is: How predictable is the buildup of antibodies in the horse's blood after the vaccination is given A large random sample of horses from Wyoming were given the vaccination. The average antibody buildup factor (as determined from blood samples) was measured each week after the vaccination for eight weeks. Results are shown in the following time series:
Original Time Series
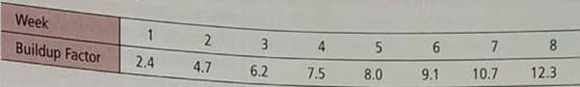
To construct a serial correlation, we simply use data pairs ( x , y ) where x = original buildup factor data and y = original data shifted ahead by one week. This gives us the following data set. Since we are shifting one week ahead, we now have 7 data pairs (not 8).
Data for Serial Correlation
For convenience, we are given the following sums:
x = 48.6 y = 58.5 x 2 = 383.84 y 2 = 529.37 xy = 448.7
(a) Use the sums provided (or a calculator with least-squares regression) to compute the equation of the sample least squares line,
 . If the buildup factor was x = 5.8 one week, what would you predict the buildup factor to be the next week
(b) Compute the sample correlation coefficient r and the coefficient of determination r 2. Test p 0 at the 1% level of significance. Would you say the time series of antibody buildup factor is relatively predictable from one week to the next Explain.
A research veterinarian at a major university has developed a new vaccine to protect horses from West Nile virus. An important question is: How predictable is the buildup of antibodies in the horse's blood after the vaccination is given A large random sample of horses from Wyoming were given the vaccination. The average antibody buildup factor (as determined from blood samples) was measured each week after the vaccination for eight weeks. Results are shown in the following time series:
Original Time Series
To construct a serial correlation, we simply use data pairs ( x , y ) where x = original buildup factor data and y = original data shifted ahead by one week. This gives us the following data set. Since we are shifting one week ahead, we now have 7 data pairs (not 8).
Data for Serial Correlation
For convenience, we are given the following sums:
x = 48.6 y = 58.5 x 2 = 383.84 y 2 = 529.37 xy = 448.7
(a) Use the sums provided (or a calculator with least-squares regression) to compute the equation of the sample least squares line,
. If the buildup factor was x = 5.8 one week, what would you predict the buildup factor to be the next week(b) Compute the sample correlation coefficient r and the coefficient of determination r 2. Test p 0 at the 1% level of significance. Would you say the time series of antibody buildup factor is relatively predictable from one week to the next Explain.
Question
For Problems 9-19, please provide the following information:
(a) What is the level of significance State the null and alternate hypotheses.
(b) Check Requirements Find the value of the chi-square statistic for the sample. Are all the expected frequencies greater than 5 What sampling distribution will you use What are the degrees of freedom
(c) Find or estimate the P -value of the sample test statistic.
(d) Based on your answers in parts (a)-(c), will you reject or fail to reject the null hypothesis of independence
(e) Interpret your conclusion in the context of the application.
Use the expected values E to the hundredths place.
Psychology: Myers-Briggs The following table shows the Myers-Briggs personality preference and area of study for a random sample of 519 college students ( Applications of the Myers-Briggs Type Indicator in Higher Education , edited by Provost and Anchors). In the table, IN refers to introvert, intuitive; EN refers to extrovert, intuitive; IS refers to introvert, sensing; and ES refers to extrovert, sensing.
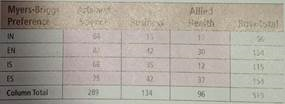
Use a chi-square test to determine if Myers-Briggs preference type is independent of area of study at the 0.05 level of significance.
(a) What is the level of significance State the null and alternate hypotheses.
(b) Check Requirements Find the value of the chi-square statistic for the sample. Are all the expected frequencies greater than 5 What sampling distribution will you use What are the degrees of freedom
(c) Find or estimate the P -value of the sample test statistic.
(d) Based on your answers in parts (a)-(c), will you reject or fail to reject the null hypothesis of independence
(e) Interpret your conclusion in the context of the application.
Use the expected values E to the hundredths place.
Psychology: Myers-Briggs The following table shows the Myers-Briggs personality preference and area of study for a random sample of 519 college students ( Applications of the Myers-Briggs Type Indicator in Higher Education , edited by Provost and Anchors). In the table, IN refers to introvert, intuitive; EN refers to extrovert, intuitive; IS refers to introvert, sensing; and ES refers to extrovert, sensing.
Use a chi-square test to determine if Myers-Briggs preference type is independent of area of study at the 0.05 level of significance.
Question
For Problems 5-14, please provide the following information.
(a) What is the level of significance State the null and alternate hypotheses.
(b) Find the value of the chi-square statistic for the sample. Are all the expected frequencies greater than 5 What sampling distribution will you use What are the degrees of freedom
(c) Find or estimate the P -value of the sample test statistic.
(d) Based on your answers in parts (a)-(c), will you reject or fail to reject the null hypothesis that the population fits the specified distribution of categories
(e) Interpret your conclusion in the context of the application.
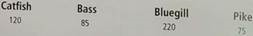
Ecology: Fish The Fish and Game Department stocked Lake Lulu with fish in the following proportions: 30% catfish, 15% bass, 40% bluegill, and 15% pike. Five years later it sampled the lake to see if the distribution of fish had changed. It found that the 500 fish in the sample were distributed as follows:
In the 5-year interval, did the distribution of fish change at the 0.05 level
(a) What is the level of significance State the null and alternate hypotheses.
(b) Find the value of the chi-square statistic for the sample. Are all the expected frequencies greater than 5 What sampling distribution will you use What are the degrees of freedom
(c) Find or estimate the P -value of the sample test statistic.
(d) Based on your answers in parts (a)-(c), will you reject or fail to reject the null hypothesis that the population fits the specified distribution of categories
(e) Interpret your conclusion in the context of the application.
Ecology: Fish The Fish and Game Department stocked Lake Lulu with fish in the following proportions: 30% catfish, 15% bass, 40% bluegill, and 15% pike. Five years later it sampled the lake to see if the distribution of fish had changed. It found that the 500 fish in the sample were distributed as follows:
In the 5-year interval, did the distribution of fish change at the 0.05 level
Question
For all Hypothesis tests, please provide the following information:
(i) What is the level of significance State the null and alternate hypotheses.
(ii) Check Requirements What sampling distribution will you use What assumptions are you making What is the value of the sample test statistic
(iii) Find (or estimate) the P -value. Sketch the sampling distribution and show the area corresponding to the P -value.
(iv) Based on your answers in parts (i)-(iii), will you reject or fail to reject the null hypothesis Are the data statistically significant at level
(v) Interpret your conclusion in the context of the application.
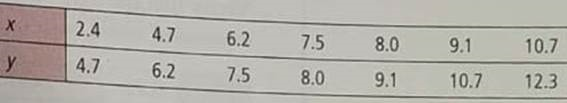
Inferences for Linear Regression Plate tectonics and the spread of the ocean floor are very important in modern studies of earthquakes and earth science in general. A random sample of islands in the Indian Ocean gave the following information, where x = age of a volcanic island in the Indian Ocean (units in 10 6 years) and y = distance of the island from the center of the midoceanic ridge (units in 100 km).
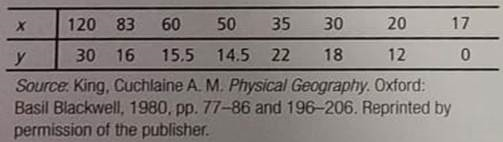
x = 415; y = 128; x 2 = 30,203 y 2 = 2558.5; xy = 8133.
(a) Verify that the standard error of estimate S e 6.50.
(b) Verify that the sample correlation coefficient r 6.50. Use a 5% level of significance to test that is positive.
(c) Verify that the equation of the least-squares line is
 . Use a 5% level of significance to test that is positive.
(d) Given that the age of a volcanic island is 55 (units 10 6 years), predict how far the island is from the center of the midoceanic ridge (units in 100 km). Find an 85% confidence interval for the prediction.
(i) What is the level of significance State the null and alternate hypotheses.
(ii) Check Requirements What sampling distribution will you use What assumptions are you making What is the value of the sample test statistic
(iii) Find (or estimate) the P -value. Sketch the sampling distribution and show the area corresponding to the P -value.
(iv) Based on your answers in parts (i)-(iii), will you reject or fail to reject the null hypothesis Are the data statistically significant at level
(v) Interpret your conclusion in the context of the application.
Inferences for Linear Regression Plate tectonics and the spread of the ocean floor are very important in modern studies of earthquakes and earth science in general. A random sample of islands in the Indian Ocean gave the following information, where x = age of a volcanic island in the Indian Ocean (units in 10 6 years) and y = distance of the island from the center of the midoceanic ridge (units in 100 km).
x = 415; y = 128; x 2 = 30,203 y 2 = 2558.5; xy = 8133.
(a) Verify that the standard error of estimate S e 6.50.
(b) Verify that the sample correlation coefficient r 6.50. Use a 5% level of significance to test that is positive.
(c) Verify that the equation of the least-squares line is
. Use a 5% level of significance to test that is positive.(d) Given that the age of a volcanic island is 55 (units 10 6 years), predict how far the island is from the center of the midoceanic ridge (units in 100 km). Find an 85% confidence interval for the prediction.
Question
Critical Thinking: Using Information in a Computer Display to Fine a Confidence interval Refer to the Minitab printout regarding prehistoric pottery.
(a) The standard error S c of the linear regression model is given in the printout as "S." What is the value of S c
(b) The standard error of the coefficient of the predictor variable is found under "SE Coef." Recall that the standard error for b is
From the Minitab display, what is the value of the standard error for the slope b
Question
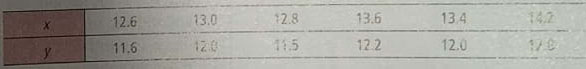
Expand Your Knowledge: Time Series and Serial Correlation An Internet advertising agency is studying the number of "hits" on a certain website during an advertising compaign. It is hoped that as the compaign progresses, the number of hits on the website will also increase in a predictable way from one day to the next. For 10 days of the compaign, the number of hits × 10 5 is shown:
Original Time Series
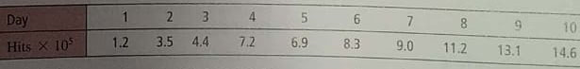
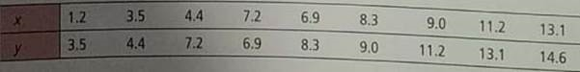
(a) To construct a serial correlation, we use data pairs ( x , y ) where x = original data and y = original data shifted ahead by one time period. Verify that the data set ( x , y ) for serial correlation is shown here. (For discussion of serial correlation, see Problem15.)
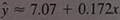
(b) For the ( x , y ) data set of part (a), compute the equation of the sample least-squares line
 . If the number of hits was 9.3 (×10 5 ) one day, what do you predict for the number of hits the next day
(c) Compute the sample correlation coefficient r and the coefficient of determination r 2. Test 0 at the 1% level of significance. Would you say the time series of website hits is relatively predictable from one day to the next Explain.
Original Time Series
(a) To construct a serial correlation, we use data pairs ( x , y ) where x = original data and y = original data shifted ahead by one time period. Verify that the data set ( x , y ) for serial correlation is shown here. (For discussion of serial correlation, see Problem15.)
(b) For the ( x , y ) data set of part (a), compute the equation of the sample least-squares line
. If the number of hits was 9.3 (×10 5 ) one day, what do you predict for the number of hits the next day(c) Compute the sample correlation coefficient r and the coefficient of determination r 2. Test 0 at the 1% level of significance. Would you say the time series of website hits is relatively predictable from one day to the next Explain.
Question
For Problems 9-19, please provide the following information:
(a) What is the level of significance State the null and alternate hypotheses.
(b) Check Requirements Find the value of the chi-square statistic for the sample. Are all the expected frequencies greater than 5 What sampling distribution will you use What are the degrees of freedom
(c) Find or estimate the P -value of the sample test statistic.
(d) Based on your answers in parts (a)-(c), will you reject or fail to reject the null hypothesis of independence
(e) Interpret your conclusion in the context of the application.
Use the expected values E to the hundredths place.
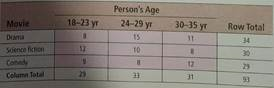
Sociology: Movie Preference Mr. Acosta, a sociologist, is doing a study to see if there is a relationship between the age of a young adult (18 to 35 years old) and the type of movie preferred. A random sample of 93 adults revealed the following data. Test whether age and type of movie preferred are independent at the 0.05 level.
(a) What is the level of significance State the null and alternate hypotheses.
(b) Check Requirements Find the value of the chi-square statistic for the sample. Are all the expected frequencies greater than 5 What sampling distribution will you use What are the degrees of freedom
(c) Find or estimate the P -value of the sample test statistic.
(d) Based on your answers in parts (a)-(c), will you reject or fail to reject the null hypothesis of independence
(e) Interpret your conclusion in the context of the application.
Use the expected values E to the hundredths place.
Sociology: Movie Preference Mr. Acosta, a sociologist, is doing a study to see if there is a relationship between the age of a young adult (18 to 35 years old) and the type of movie preferred. A random sample of 93 adults revealed the following data. Test whether age and type of movie preferred are independent at the 0.05 level.
Question
For Problems 5-14, please provide the following information.
(a) What is the level of significance State the null and alternate hypotheses.
(b) Find the value of the chi-square statistic for the sample. Are all the expected frequencies greater than 5 What sampling distribution will you use What are the degrees of freedom
(c) Find or estimate the P -value of the sample test statistic.
(d) Based on your answers in parts (a)-(c), will you reject or fail to reject the null hypothesis that the population fits the specified distribution of categories
(e) Interpret your conclusion in the context of the application.
Library: Book Circulation The director of library services at Fairmont College did a survey of types of books (by subject) in the circulation library. Then she used library records to take a random sample of 888 books checked out last term and classified the books in the sample by subject. The results are shown below.
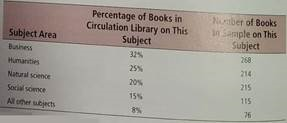
Using a 5% level of significance, test the claim that the subject distribution of books in the library fits the distribution of books checked out by students.
(a) What is the level of significance State the null and alternate hypotheses.
(b) Find the value of the chi-square statistic for the sample. Are all the expected frequencies greater than 5 What sampling distribution will you use What are the degrees of freedom
(c) Find or estimate the P -value of the sample test statistic.
(d) Based on your answers in parts (a)-(c), will you reject or fail to reject the null hypothesis that the population fits the specified distribution of categories
(e) Interpret your conclusion in the context of the application.
Library: Book Circulation The director of library services at Fairmont College did a survey of types of books (by subject) in the circulation library. Then she used library records to take a random sample of 888 books checked out last term and classified the books in the sample by subject. The results are shown below.
Using a 5% level of significance, test the claim that the subject distribution of books in the library fits the distribution of books checked out by students.
Question
Question
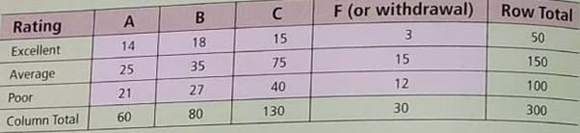
Teacher Ratings: Grades Professor Stone complains that student teacher rating depends on the grade the student receives. In other words, according to Professor Stone, a teacher who gives good grades gets good ratings, and a teacher who gives bad grades gets bad ratings. To test this claim, the Student Assembly took a random sample of 300 teacher ratings on which the student's grade for the course also was indicated. The results are given in the following table. Test the hypothesis that teacher ratings and student grades are independent at the 0.01 level of significance.
Question
Expand Your Knowledge: Time Series and Serial Correlation A company that produces and markets video games wants to estimate the predictability of per capita consumer spending on video games in the United States. For the most recent seven years, the amount of annual spending per person per year in shown here (Reference: Statistical Abstract of the United States , 128 th edition):
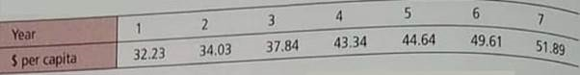
(a) To construct a serial correlation, we use data pairs ( x , y ) where x = original data and y = original data shifted ahead by one time period. Verify that the data set ( x , y ) for serial correlation is shown here. (For discussion of serial correlation, see Problem 15.)
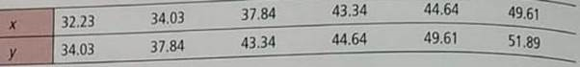
(b) For the ( x , y ) data set of part (a), compute the equation of the sample least-squares line
 . If the per capita spending was x = $42 one year, what do you predict for the spending the next year
(c) Compute the sample correlation coefficient r and the coefficient of determination r 2. Test 0 at the 1% level of significance. Would you say the time series of per capita spending on video games is relatively predictable from one year to the next Explain.
(a) To construct a serial correlation, we use data pairs ( x , y ) where x = original data and y = original data shifted ahead by one time period. Verify that the data set ( x , y ) for serial correlation is shown here. (For discussion of serial correlation, see Problem 15.)
(b) For the ( x , y ) data set of part (a), compute the equation of the sample least-squares line
. If the per capita spending was x = $42 one year, what do you predict for the spending the next year(c) Compute the sample correlation coefficient r and the coefficient of determination r 2. Test 0 at the 1% level of significance. Would you say the time series of per capita spending on video games is relatively predictable from one year to the next Explain.
Question
For Problems 9-19, please provide the following information:
(a) What is the level of significance State the null and alternate hypotheses.
(b) Check Requirements Find the value of the chi-square statistic for the sample. Are all the expected frequencies greater than 5 What sampling distribution will you use What are the degrees of freedom
(c) Find or estimate the P -value of the sample test statistic.
(d) Based on your answers in parts (a)-(c), will you reject or fail to reject the null hypothesis of independence
(e) Interpret your conclusion in the context of the application.
Use the expected values E to the hundredths place.
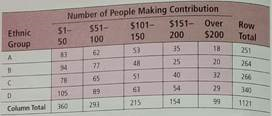
Sociology: Ethnic Groups After a large fund drive to help the Boston City Library, the following information was obtained from a random sample of contributors to the library fund. Using a 1% level of significance, test the claim that the amount contributed to the library fund is independent of ethnic group.
(a) What is the level of significance State the null and alternate hypotheses.
(b) Check Requirements Find the value of the chi-square statistic for the sample. Are all the expected frequencies greater than 5 What sampling distribution will you use What are the degrees of freedom
(c) Find or estimate the P -value of the sample test statistic.
(d) Based on your answers in parts (a)-(c), will you reject or fail to reject the null hypothesis of independence
(e) Interpret your conclusion in the context of the application.
Use the expected values E to the hundredths place.
Sociology: Ethnic Groups After a large fund drive to help the Boston City Library, the following information was obtained from a random sample of contributors to the library fund. Using a 1% level of significance, test the claim that the amount contributed to the library fund is independent of ethnic group.
Question
For Problems 5-14, please provide the following information.
(a) What is the level of significance State the null and alternate hypotheses.
(b) Find the value of the chi-square statistic for the sample. Are all the expected frequencies greater than 5 What sampling distribution will you use What are the degrees of freedom
(c) Find or estimate the P -value of the sample test statistic.
(d) Based on your answers in parts (a)-(c), will you reject or fail to reject the null hypothesis that the population fits the specified distribution of categories
(e) Interpret your conclusion in the context of the application.
Census: California The accuracy of a census report on a city in southern California was questioned by some government officials. A random sample of 1215 people living in the city was used to check the report, and the results are shown next:
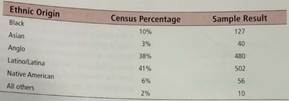
Using a 1% level of significance, test the claim that the census distribution and the sample distribution agree.
(a) What is the level of significance State the null and alternate hypotheses.
(b) Find the value of the chi-square statistic for the sample. Are all the expected frequencies greater than 5 What sampling distribution will you use What are the degrees of freedom
(c) Find or estimate the P -value of the sample test statistic.
(d) Based on your answers in parts (a)-(c), will you reject or fail to reject the null hypothesis that the population fits the specified distribution of categories
(e) Interpret your conclusion in the context of the application.
Census: California The accuracy of a census report on a city in southern California was questioned by some government officials. A random sample of 1215 people living in the city was used to check the report, and the results are shown next:
Using a 1% level of significance, test the claim that the census distribution and the sample distribution agree.
Question
Question
Question
Question
For Problems 9-19, please provide the following information:
(a) What is the level of significance State the null and alternate hypotheses.
(b) Check Requirements Find the value of the chi-square statistic for the sample. Are all the expected frequencies greater than 5 What sampling distribution will you use What are the degrees of freedom
(c) Find or estimate the P -value of the sample test statistic.
(d) Based on your answers in parts (a)-(c), will you reject or fail to reject the null hypothesis of independence
(e) Interpret your conclusion in the context of the application.
Use the expected values E to the hundredths place.
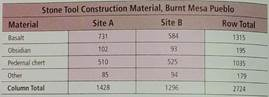
Focus Problem: Archaeology The Focus Problem at the beginning of the chapter refers to excavations at Burnt Mesa Pueblo in Bandelier National Monument. One question the archaeologists asked was: Is the raw material used by prehistoric Indians for stone tool manufacture independent of the archaeological excavation site Two different excavation sites at Burnt Mesa Pueblo gave the information in the following table. Use a chi-square test with 5% level of significance to test the claim that the raw material used for construction of stone tools and the excavation site are independent.
(a) What is the level of significance State the null and alternate hypotheses.
(b) Check Requirements Find the value of the chi-square statistic for the sample. Are all the expected frequencies greater than 5 What sampling distribution will you use What are the degrees of freedom
(c) Find or estimate the P -value of the sample test statistic.
(d) Based on your answers in parts (a)-(c), will you reject or fail to reject the null hypothesis of independence
(e) Interpret your conclusion in the context of the application.
Use the expected values E to the hundredths place.
Focus Problem: Archaeology The Focus Problem at the beginning of the chapter refers to excavations at Burnt Mesa Pueblo in Bandelier National Monument. One question the archaeologists asked was: Is the raw material used by prehistoric Indians for stone tool manufacture independent of the archaeological excavation site Two different excavation sites at Burnt Mesa Pueblo gave the information in the following table. Use a chi-square test with 5% level of significance to test the claim that the raw material used for construction of stone tools and the excavation site are independent.
Question
For Problems 5-14, please provide the following information.
(a) What is the level of significance State the null and alternate hypotheses.
(b) Find the value of the chi-square statistic for the sample. Are all the expected frequencies greater than 5 What sampling distribution will you use What are the degrees of freedom
(c) Find or estimate the P -value of the sample test statistic.
(d) Based on your answers in parts (a)-(c), will you reject or fail to reject the null hypothesis that the population fits the specified distribution of categories
(e) Interpret your conclusion in the context of the application.
Accounting Records: Benford's Law Benford's Law states that the first nonzero digits of numbers drawn at random from a large complex data file have the following probability distribution (Reference: American Statistical Association, Chance , Vol. 12, No. 3, pp. 27-31; see also the Focus Problem of Chapter 9):
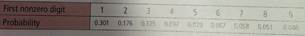
Suppose that n = 275 numerical entries were drawn at random from a large accounting file of a major corporation. The first nonzero digits were recorded for the sample.
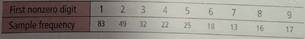
Use a 1% level of significance to test the claim that the distribution of first nonzero digits in this accounting file follows Benford's Law.
(a) What is the level of significance State the null and alternate hypotheses.
(b) Find the value of the chi-square statistic for the sample. Are all the expected frequencies greater than 5 What sampling distribution will you use What are the degrees of freedom
(c) Find or estimate the P -value of the sample test statistic.
(d) Based on your answers in parts (a)-(c), will you reject or fail to reject the null hypothesis that the population fits the specified distribution of categories
(e) Interpret your conclusion in the context of the application.
Accounting Records: Benford's Law Benford's Law states that the first nonzero digits of numbers drawn at random from a large complex data file have the following probability distribution (Reference: American Statistical Association, Chance , Vol. 12, No. 3, pp. 27-31; see also the Focus Problem of Chapter 9):
Suppose that n = 275 numerical entries were drawn at random from a large accounting file of a major corporation. The first nonzero digits were recorded for the sample.
Use a 1% level of significance to test the claim that the distribution of first nonzero digits in this accounting file follows Benford's Law.
Question
For all Hypothesis tests, please provide the following information:
(i) What is the level of significance State the null and alternate hypotheses.
(ii) Check Requirements What sampling distribution will you use What assumptions are you making What is the value of the sample test statistic
(iii) Find (or estimate) the P -value. Sketch the sampling distribution and show the area corresponding to the P -value.
(iv) Based on your answers in parts (i)-(iii), will you reject or fail to reject the null hypothesis Are the data statistically significant at level
(v) Interpret your conclusion in the context of the application.

Goodness of Fit A recent national study gave the following information about declared major of undergraduate college students: humanities, 15%; science, 23%; business, 29%; education, 11%; social science, 10%; all other fields, 12% (Reference: Statistical Abstract of the United States ). A random sample of 215 college students in Colorado gave the following counts regarding college major: humanities, 24; science, 54; business, 70; education, 16; social science, 30; all other fields, 21. Does this information indicate that the distribution of college majors for Colorado students is different from the national distribution
(i) What is the level of significance State the null and alternate hypotheses.
(ii) Check Requirements What sampling distribution will you use What assumptions are you making What is the value of the sample test statistic
(iii) Find (or estimate) the P -value. Sketch the sampling distribution and show the area corresponding to the P -value.
(iv) Based on your answers in parts (i)-(iii), will you reject or fail to reject the null hypothesis Are the data statistically significant at level
(v) Interpret your conclusion in the context of the application.
Goodness of Fit A recent national study gave the following information about declared major of undergraduate college students: humanities, 15%; science, 23%; business, 29%; education, 11%; social science, 10%; all other fields, 12% (Reference: Statistical Abstract of the United States ). A random sample of 215 college students in Colorado gave the following counts regarding college major: humanities, 24; science, 54; business, 70; education, 16; social science, 30; all other fields, 21. Does this information indicate that the distribution of college majors for Colorado students is different from the national distribution
Question
In Problems 7-12, parts (a) and (b) relate to testing . Part (c) requests the value of S c. Part (e) relates to confidence intervals for prediction. Part (f) relates to testing . Answers may very due to rounding.
Basketball: Free Throws and Field Goals Let x be a random variable that represents the percentage of successful free throws a professional basketball players makes in a season. Let y be a random variable that represents the percentage of successful field goals a professional basketball player makes in a season. A random sample of n = 6 professional basketball players gave the following information (Reference: The Official NBA Basketball Encyclopedia , Villard Books):
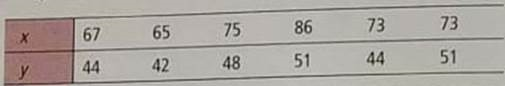
(a) Verify that x = 439, y = 280, x 2 = 32,393, y 2 = 13,142, xy = 20,599, and r 0.784.
(b) Use a 5% level of significance to test the claim that p 0.
(c) Verify that S c 2.6964, a 16.542, and b 0.4117.
(d) Find the predicted percentage
 of successful field goals for a player with x = 70% successful free throws.
(e) Fine a 90% confidence interval for y when x = 70.
(f) Use a 5% level of significance to test the claim that 0.
Basketball: Free Throws and Field Goals Let x be a random variable that represents the percentage of successful free throws a professional basketball players makes in a season. Let y be a random variable that represents the percentage of successful field goals a professional basketball player makes in a season. A random sample of n = 6 professional basketball players gave the following information (Reference: The Official NBA Basketball Encyclopedia , Villard Books):
(a) Verify that x = 439, y = 280, x 2 = 32,393, y 2 = 13,142, xy = 20,599, and r 0.784.
(b) Use a 5% level of significance to test the claim that p 0.
(c) Verify that S c 2.6964, a 16.542, and b 0.4117.
(d) Find the predicted percentage
of successful field goals for a player with x = 70% successful free throws.(e) Fine a 90% confidence interval for y when x = 70.
(f) Use a 5% level of significance to test the claim that 0.
Question
Question
For Problems 9-19, please provide the following information:
(a) What is the level of significance State the null and alternate hypotheses.
(b) Check Requirements Find the value of the chi-square statistic for the sample. Are all the expected frequencies greater than 5 What sampling distribution will you use What are the degrees of freedom
(c) Find or estimate the P -value of the sample test statistic.
(d) Based on your answers in parts (a)-(c), will you reject or fail to reject the null hypothesis of independence
(e) Interpret your conclusion in the context of the application.
Use the expected values E to the hundredths place.
Political Affiliation: Spending Two random samples were drawn from members of the U.S. Congress. One sample was taken from members who are Democrats and the other from members who are Republicans. For each sample, the number of dollars spent on federal projects in each congressperson's home district was recorded.
(i) Make a cluster bar graph showing the percentage of Congress members from each party who spent each designated amount in their respective home districts.
(ii) Use a 1% level of significance to test whether congressional members of each political party spent designated amounts in the same proportions.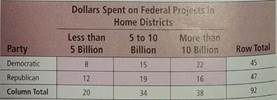
Question
Question
Question
Sociology: Age Distribution A sociologist is studying the age of the population in Blue Valley. Ten years ago, the population was such that 20% were under 20 years old, 15% were in the 20-35 year old bracket, 30% were between 36 and 50, 25% were between 51 and 65, and 10% were over 65. A study done this year used a random sample of 210 residents. This sample showed.
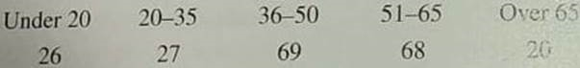
At the 0.01 level of significance, has the age distribution of the population of Blue Valley changed
At the 0.01 level of significance, has the age distribution of the population of Blue Valley changed
Question
Question
For Problems 9-19, please provide the following information:
(a) What is the level of significance State the null and alternate hypotheses.
(b) Check Requirements Find the value of the chi-square statistic for the sample. Are all the expected frequencies greater than 5 What sampling distribution will you use What are the degrees of freedom
(c) Find or estimate the P -value of the sample test statistic.
(d) Based on your answers in parts (a)-(c), will you reject or fail to reject the null hypothesis of independence
(e) Interpret your conclusion in the context of the application.
Use the expected values E to the hundredths place.
Sociology: Methods of Communication Random samples of people aged 15-24 and of people aged 25-34 were asked about their preferred method of (remote) communication with friends. The respondents were asked to select one of the methods from the following list: cell phone, instant message, e-mail, or other.
(i) Make a cluster bar graph showing the percentages in each age group who selected each method.
(ii) Test whether the two populations share the same proportions of preferences for each type of communication method. Use = 0.05.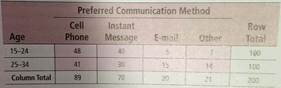
Question
Question
Question
In Problems 7-12, parts (a) and (b) relate to testing . Part (c) requests the value of S c. Part (e) relates to confidence intervals for prediction. Part (f) relates to testing . Answers may very due to rounding.
Baseball: Batting Average and Strikeouts Let x be a random variable that represents the batting average of a professional baseball player. Let y be a random variable that represents the percentage of strikeouts of a professional baseball player. A random sample of n = 6 professional baseball players gave the following information (Reference: The Baseball Encyclopedia , Macmillan):
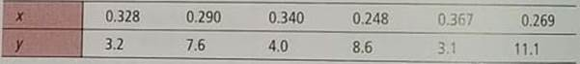
(a) Verify that x = 1.842, y = 37.6, x 2 = 0.575838, y 2 = 290.78, xy = 10.87, and r 0.891.
(b) Use a 5% level of significance to test the claim that 0.
(c) Verify that S e 1.6838, a 26.247, and b 65.081.
(d) Find the predicted percentage of strikeouts for a player with an x = 0.300 batting average.
(e) Find a 80% confidence interval for y when x = 0.300.
(f) Use a 5% level of significance to test the claim that 0.
Baseball: Batting Average and Strikeouts Let x be a random variable that represents the batting average of a professional baseball player. Let y be a random variable that represents the percentage of strikeouts of a professional baseball player. A random sample of n = 6 professional baseball players gave the following information (Reference: The Baseball Encyclopedia , Macmillan):
(a) Verify that x = 1.842, y = 37.6, x 2 = 0.575838, y 2 = 290.78, xy = 10.87, and r 0.891.
(b) Use a 5% level of significance to test the claim that 0.
(c) Verify that S e 1.6838, a 26.247, and b 65.081.
(d) Find the predicted percentage of strikeouts for a player with an x = 0.300 batting average.
(e) Find a 80% confidence interval for y when x = 0.300.
(f) Use a 5% level of significance to test the claim that 0.
Question
Question
Question
Question
For all Hypothesis tests, please provide the following information:
(i) What is the level of significance State the null and alternate hypotheses.
(ii) Check Requirements What sampling distribution will you use What assumptions are you making What is the value of the sample test statistic
(iii) Find (or estimate) the P -value. Sketch the sampling distribution and show the area corresponding to the P -value.
(iv) Based on your answers in parts (i)-(iii), will you reject or fail to reject the null hypothesis Are the data statistically significant at level
(v) Interpret your conclusion in the context of the application.
Test of Independence: Agriculture Three types of fertilizer were used on 132 identical plots of maize. Each plot was harvested and the yield (in kg) was recorded (Reference: Caribbean Agricultural Research and Development Institute).
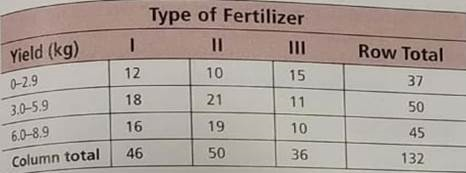
Use a 5% level of significance to test the hypothesis that type of fertilizer and yield of maize are independent. Interpret the results.
(i) What is the level of significance State the null and alternate hypotheses.
(ii) Check Requirements What sampling distribution will you use What assumptions are you making What is the value of the sample test statistic
(iii) Find (or estimate) the P -value. Sketch the sampling distribution and show the area corresponding to the P -value.
(iv) Based on your answers in parts (i)-(iii), will you reject or fail to reject the null hypothesis Are the data statistically significant at level
(v) Interpret your conclusion in the context of the application.
Test of Independence: Agriculture Three types of fertilizer were used on 132 identical plots of maize. Each plot was harvested and the yield (in kg) was recorded (Reference: Caribbean Agricultural Research and Development Institute).
Use a 5% level of significance to test the hypothesis that type of fertilizer and yield of maize are independent. Interpret the results.
Question
Question
Question
Question
Question
Statistical Literacy For a fixed confidence level, how does the length of the confidence interval for predicted values of y change as the corresponding x values become farther away from

Question
In Problems 7-12, parts (a) and (b) relate to testing . Part (c) requests the value of S c. Part (e) relates to confidence intervals for prediction. Part (f) relates to testing . Answers may very due to rounding.
Scuba Diving: Depth What is the optimal time for a scuba diver to be on the bottom of the ocean That depends on the depth of the dive. The U.S. navy has done a lot of research on this topic. The Navy defines the "optimal time" to be the time at each depth for the best balance between length of work period and decompression time after surfacing. Let x = depth of dive in meters, and let y = optimal time in hours. A random sample of divers gave the following data (based on information taken from Textbook of Medical Physiology by A. C. Guyton, M.D):
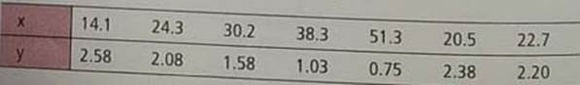
(a) Verify that x = 201.4, y = 12.6, x 2 = 6735.46, y 2 = 25.607, xy = 311.292, and r 0.976.
(b) Use a 1% level of significance to test the claim that 0.
(c) Verify that S e 0.1660, a 3.366, and b 0.0544.
(d) Find the predicted optimal time in hours for a dive depth of x = 18 meters.
(e) Find an 80% confidence interval for y when x = 18 meters.
(f) Use a 1% level of significance to test the claim that 0.
Scuba Diving: Depth What is the optimal time for a scuba diver to be on the bottom of the ocean That depends on the depth of the dive. The U.S. navy has done a lot of research on this topic. The Navy defines the "optimal time" to be the time at each depth for the best balance between length of work period and decompression time after surfacing. Let x = depth of dive in meters, and let y = optimal time in hours. A random sample of divers gave the following data (based on information taken from Textbook of Medical Physiology by A. C. Guyton, M.D):
(a) Verify that x = 201.4, y = 12.6, x 2 = 6735.46, y 2 = 25.607, xy = 311.292, and r 0.976.
(b) Use a 1% level of significance to test the claim that 0.
(c) Verify that S e 0.1660, a 3.366, and b 0.0544.
(d) Find the predicted optimal time in hours for a dive depth of x = 18 meters.
(e) Find an 80% confidence interval for y when x = 18 meters.
(f) Use a 1% level of significance to test the claim that 0.
Question
Question
Question
Question
Education: Exams Professor Fair believes that extra time does not improve grades on exams. He randomly divided a group of 300 students into two groups and gave them all the same test. One group had exactly 1 hour in which to finish the test, and the other group could stay as long as desired. The results follow. Test at the 0.01 level of significance that time to do a test and test results are independent.
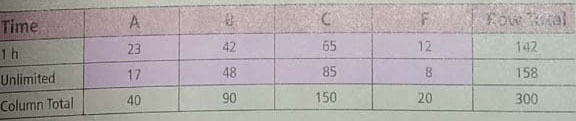
Question
Physiology: Children The following problem is based on information taken from the paediatrics section of The Merck Manual (a commonly used reference in medical schools and nursing programs). Let x be the body weight of a child (in kilograms), and let y be the metabolic rate of the child (in 100 kcal/24 h).
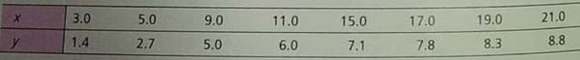
x = 100; y = 47.1; x 2 = 1552; y 2 = 327.83; xy = 710.3.
(a) Verify that S e 0.518.
(b) Verify that r 0.984. Test that is positive. Use = 0.01.
(c) Verify that b 0.402. Test that is positive. Use = 0.01.
(d) Verify that
 . Find a 90% confidence interval for the predicted metabolic rate for a child weighing 10 kg.
x = 100; y = 47.1; x 2 = 1552; y 2 = 327.83; xy = 710.3.
(a) Verify that S e 0.518.
(b) Verify that r 0.984. Test that is positive. Use = 0.01.
(c) Verify that b 0.402. Test that is positive. Use = 0.01.
(d) Verify that
. Find a 90% confidence interval for the predicted metabolic rate for a child weighing 10 kg.
Unlock Deck
Sign up to unlock the cards in this deck!
Unlock Deck
Unlock Deck
1/79
Play
Full screen (f)
Deck 11: Additional Topics Using Inference
1
Interpretation: Test of Homogeneity Consider Zane's study regarding products recycled and age group (see Problem 5). Suppose he found a sample 2 = 16.83.
(a) How many degrees of freedom are used Recall that there were 4 age groups and 3 products specified. Approximate the P -value and conclude the test at the 1% level of significance. Does it appear that the proportion of people who recycle each of the specified products differ by age group Explain.
(b) From this study, can Zane identify how the different age groups differ regarding the proportion of those recycling the specified product Explain.
The researcher performs a chi-square test of homogeneity to see if the distribution of products recycled differs among different age groups. The
 test statistic is found to be 16.83.
(a) There are 4 age groups and 3 types of recyclables. The contingency table has 4 rows and 3 columns. Therefore the degrees of freedom for this experiment is
 The number of degrees of freedom is 6.
He will use the table of the
 distribution to approximate the P -value. Looking at the row corresponding to d.f. = 6, he finds that the value of his test statistic is between the tabular values of 16.81 and 18.55, which corresponds to a P -value between 0.005 and 0.01. Thus, 0.005 P -value 0.01.
The hypotheses for this experiment are
 The test is conducted at the 1% significance level;
 = 0.01.
The computed range of P -values is less than the
 value of 0.01. Therefore he would reject the null hypothesis.
There is convincing evidence that the proportions of types of items recycled are different in the different age groups.
(b) In this study he cannot pinpoint which recyclable products are differently distributed among the different age groups. He can only make the larger generalization that there is at least one difference in the proportions of products recycled by the different age groups.
test statistic is found to be 16.83.(a) There are 4 age groups and 3 types of recyclables. The contingency table has 4 rows and 3 columns. Therefore the degrees of freedom for this experiment is
The number of degrees of freedom is 6.He will use the table of the
distribution to approximate the P -value. Looking at the row corresponding to d.f. = 6, he finds that the value of his test statistic is between the tabular values of 16.81 and 18.55, which corresponds to a P -value between 0.005 and 0.01. Thus, 0.005 P -value 0.01.The hypotheses for this experiment are
The test is conducted at the 1% significance level; = 0.01.The computed range of P -values is less than the
value of 0.01. Therefore he would reject the null hypothesis.There is convincing evidence that the proportions of types of items recycled are different in the different age groups.
(b) In this study he cannot pinpoint which recyclable products are differently distributed among the different age groups. He can only make the larger generalization that there is at least one difference in the proportions of products recycled by the different age groups.
2
Critical Thinking When the sample evidence is sufficient to justify rejecting the null hypothesis in a goodness-of-fit test, can you tell exactly how the distribution of observed values over the specified categories differs from the expected distribution Explain.
When we reject the null hypothesis in a goodness-of-fit
 test, we are saying simply that the differences between the observed and expected values are so great that the outcome's occurring by chance alone is highly improbable. We do not have information about how the observed values are distributed over the categories.
test, we are saying simply that the differences between the observed and expected values are so great that the outcome's occurring by chance alone is highly improbable. We do not have information about how the observed values are distributed over the categories. 3
For Problems 3-11, please provide the following information:
(a) What is the level of significance State the null and alternate hypotheses.
(b) Find the value of the chi-square statistic for the sample. What are the degrees of freedom Check Requirements What assumptions are you making about the original distribution
(c) Find or estimate the P -value of the sample test statistic.
(d) Based on your answers in parts (a)-(c), will you reject or fail to reject the null hypothesis of independence
(e) Interpret your conclusion in the context of the application.
In each of the following problems, assume a normal population distribution.
Professors: Salaries The following problem is based on information taken from Academe, Bulletin of the American Association of University Professors. Let x represent the average annual salary of college and university professors (in thousands of dollars) in the United States. For all colleges and universities in the United States, the population variance of x is approximately 2 = 47.1. However, a random sample of 15 colleges a universities in Kansas showed that x has a sample variance s 2 = 83.2. Use a 5% level of significance to test the claim that the variance for colleges and universities in Kansas is greater than 47.1.
(a)


 (b)
(b)
Using n = 15,
 =83.2, and
 =47.1 from
 ,
,


 (c)
(c)
Degrees of freedom d.f. = n
 1=14
1=14
Since this is a right tailed test, we look up P-values directly in the
 table.
0.025
The figure shows the P-value
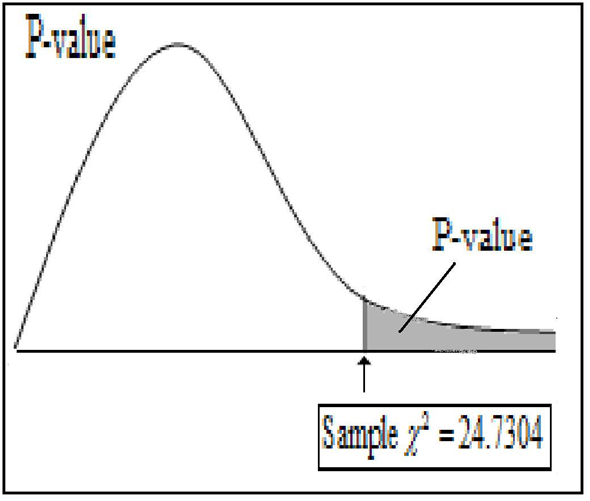 (d)
(d)
Since, the P-value interval
 , we reject
 .
.
(e)
Hence, at 5% level of significance we can conclude that the variance for colleges and universities in is greater than 47.1
(b)Using n = 15,
=83.2, and =47.1 from , (c)Degrees of freedom d.f. = n
1=14Since this is a right tailed test, we look up P-values directly in the
table. 0.025
The figure shows the P-value
(d) Since, the P-value interval
, we reject .(e)
Hence, at 5% level of significance we can conclude that the variance for colleges and universities in is greater than 47.1
4
For all Hypothesis tests, please provide the following information:
(i) What is the level of significance State the null and alternate hypotheses.
(ii) Check Requirements What sampling distribution will you use What assumptions are you making What is the value of the sample test statistic
(iii) Find (or estimate) the P -value. Sketch the sampling distribution and show the area corresponding to the P -value.
(iv) Based on your answers in parts (i)-(iii), will you reject or fail to reject the null hypothesis Are the data statistically significant at level
(v) Interpret your conclusion in the context of the application.
Testing Variances: Iris Random samples of two species of iris gave the following petal length (in cm) (Reference: R. A. Fisher, Annals of Eugenics , Vol. 7):
Use a 5% level of significance to test the claim that the population standard deviation of x 1 larger than 0.55.
Unlock Deck
Unlock for access to all 79 flashcards in this deck.
Unlock Deck
k this deck
5
Physiology: Oxygen Aviation and high-altitude physiology is a specialty in the study of medicine. Let x = partial pressure of oxygen in the alveoli (air cells in the lungs) when breathing naturally available air. Let y = partial pressure when breathing pure oxygen. The ( x, y ) data pairs correspond to elevations from 10,000 feet to 30,000 feet in 5000-foot intervals for a random sample of volunteers. Although the medical data were collected using airplanes, they apply equally well to Mt. Everest climbers (summit 29,028 feet).
(Based on information taken from Textbook of Medical Physiology By A. C. Guyton M.D.)
(a) Verify that x = 21.4, y = 132.8, x 2 = 103.84, y 2 = 4125.46, xy = 652.6, and r 0.984.
(b) Use a 1% level of significance to test the claim that 0.
(c) Verify that S e 2.5319, a 2.869, and b 6.876.
(d) Find the predicted pressure when breathing pure oxygen if the pressure from breathing available air is x = 4.0.
(e) Find a 90% confidence interval for y when x = 4.0.
(f) Use a 1% level of significance to test the claim that 0.
(Based on information taken from Textbook of Medical Physiology By A. C. Guyton M.D.)(a) Verify that x = 21.4, y = 132.8, x 2 = 103.84, y 2 = 4125.46, xy = 652.6, and r 0.984.
(b) Use a 1% level of significance to test the claim that 0.
(c) Verify that S e 2.5319, a 2.869, and b 6.876.
(d) Find the predicted pressure when breathing pure oxygen if the pressure from breathing available air is x = 4.0.
(e) Find a 90% confidence interval for y when x = 4.0.
(f) Use a 1% level of significance to test the claim that 0.
Unlock Deck
Unlock for access to all 79 flashcards in this deck.
Unlock Deck
k this deck
6
Interpretation: Test of Independence Consider Charlotte's study of source of fraud/identity theft and gender (see Problem 6). She computed sample 2 = 10.2.
(a) How many degrees of freedom are used Recall that there were 5 sources of fraud/identity theft and, of course, 2 genders. Approximate the P -value and conclude the test at the 5% level of significance. Would it seem that gender and source of fraud/identity theft are independent
(b) From this study, can Charlotte identify which source of fraud/identity theft is dependent with respect to gender Explain.
Unlock Deck
Unlock for access to all 79 flashcards in this deck.
Unlock Deck
k this deck
7
For Problems 5-14, please provide the following information.
(a) What is the level of significance State the null and alternate hypotheses.
(b) Find the value of the chi-square statistic for the sample. Are all the expected frequencies greater than 5 What sampling distribution will you use What are the degrees of freedom
(c) Find or estimate the P -value of the sample test statistic.
(d) Based on your answers in parts (a)-(c), will you reject or fail to reject the null hypothesis that the population fits the specified distribution of categories
(e) Interpret your conclusion in the context of the application.
Census: Age The age distribution of the Canadian population and the age distribution of a random sample of 455 residents in the Indian community of Red Lake Village (Northwest Territories) are shown below (based on U.S. Bureau of the Census, International Data Base ):
Use a 5% level of significance to test the claim that the age distribution of the general Canadian population fits the age distribution of the residents of Red Lake Village.
Unlock Deck
Unlock for access to all 79 flashcards in this deck.
Unlock Deck
k this deck
8
For Problems 3-11, please provide the following information:
(a) What is the level of significance State the null and alternate hypotheses.
(b) Find the value of the chi-square statistic for the sample. What are the degrees of freedom Check Requirements What assumptions are you making about the original distribution
(c) Find or estimate the P -value of the sample test statistic.
(d) Based on your answers in parts (a)-(c), will you reject or fail to reject the null hypothesis of independence
(e) Interpret your conclusion in the context of the application.
In each of the following problems, assume a normal population distribution.
Medicine: Clinical Test A new kind of typhoid shot is being developed by a medical research team. The old typhoid shot was known to protect the population for a mean time of 36 months, with a standard deviation of 3 months. To test the time variability of the new shot, a random sample of 23 people were given the new shot. Regular blood tests showed that the sample standard deviation of protection times was 1.9 months. Using a 0.05 level of significance, test the claim that the new typhoid shot has a smaller variance of protection times.
Unlock Deck
Unlock for access to all 79 flashcards in this deck.
Unlock Deck
k this deck
9
Statistical Literacy How does the t value for the sample correlation coefficient r compare to the t value for the corresponding slope b of the sample least-squares line
Using Computer Printouts Problems 5 and 6 use the following information. Prehistoric pottery vessels are usually found as sherds (broken pieces) and are carefully reconstructed if enough sherds can be found. Information taken from Mimbres Mogollon Archaeology by A. I Woolsey and A. J. McIntyre (University of New Mexico Press) provides data relating x = body diameter in centimeters and y = height in centimeters of prehistoric vessels reconstructed from sherds found at a prehistoric site. The following Minitab Printout provides an analysis of the data:
Using Computer Printouts Problems 5 and 6 use the following information. Prehistoric pottery vessels are usually found as sherds (broken pieces) and are carefully reconstructed if enough sherds can be found. Information taken from Mimbres Mogollon Archaeology by A. I Woolsey and A. J. McIntyre (University of New Mexico Press) provides data relating x = body diameter in centimeters and y = height in centimeters of prehistoric vessels reconstructed from sherds found at a prehistoric site. The following Minitab Printout provides an analysis of the data:
Unlock Deck
Unlock for access to all 79 flashcards in this deck.
Unlock Deck
k this deck
10
Baseball: Batting Average and Home Runs In baseball, is there a linear correlation between batting average and home run percentage Let x represent the batting average of a professional baseball player, and let y represent the player's home run percentage (number of home runs per 100 times at bat). A random sample of n = 7 professional baseball players gave the following information (Reference: The Baseball Encyclopedia , Macmillan Publishing Company).
x = 1.957; x 2 = 0.553; y 2 30.1; y 2 = 150.15; xy 8.753
(a) Verify that S e 0.647.
(b) Verify that r 0.984. Test that is positive. Use = 0.01.
(c) Verify that b 55.166. Test that is positive. Use = 0.01.
(d) Verify that
. Find a 90% confidence interval for the predicted home run percentage for a player with a batting average of 0.0310.
x = 1.957; x 2 = 0.553; y 2 30.1; y 2 = 150.15; xy 8.753
(a) Verify that S e 0.647.
(b) Verify that r 0.984. Test that is positive. Use = 0.01.
(c) Verify that b 55.166. Test that is positive. Use = 0.01.
(d) Verify that
. Find a 90% confidence interval for the predicted home run percentage for a player with a batting average of 0.0310. Unlock Deck
Unlock for access to all 79 flashcards in this deck.
Unlock Deck
k this deck
11
For Problems 9-19, please provide the following information:
(a) What is the level of significance State the null and alternate hypotheses.
(b) Check Requirements Find the value of the chi-square statistic for the sample. Are all the expected frequencies greater than 5 What sampling distribution will you use What are the degrees of freedom
(c) Find or estimate the P -value of the sample test statistic.
(d) Based on your answers in parts (a)-(c), will you reject or fail to reject the null hypothesis of independence
(e) Interpret your conclusion in the context of the application.
Use the expected values E to the hundredths place.
Psychology: Myers-Briggs The following table shows the Myers-Briggs personality preferences for a random sample of 406 people in the listed professions ( Myers-Briggs Type Indicator Atlas of Type Tables , by Macdaid, McCaulley, and Kainz). E refers to extroverted and I refers to introverted.
Use the chi-square test to determine if the listed occupations and personality preferences are independent at the 0.05 level of signicance.
Unlock Deck
Unlock for access to all 79 flashcards in this deck.
Unlock Deck
k this deck
12
For Problems 5-14, please provide the following information.
(a) What is the level of significance State the null and alternate hypotheses.
(b) Find the value of the chi-square statistic for the sample. Are all the expected frequencies greater than 5 What sampling distribution will you use What are the degrees of freedom
(c) Find or estimate the P -value of the sample test statistic.
(d) Based on your answers in parts (a)-(c), will you reject or fail to reject the null hypothesis that the population fits the specified distribution of categories
(e) Interpret your conclusion in the context of the application.
Census: Type of Household The type of household for the U.S. population and for a random sample of 411 households from the community of Dove Creek, Montana, are shown (based on Statistical Abstract of the United States ):
Use a 5% level of significance to test the claim that the distribution of U.S. households fits the Dove Creek distribution.
Unlock Deck
Unlock for access to all 79 flashcards in this deck.
Unlock Deck
k this deck
13
For Problems 3-11, please provide the following information:
(a) What is the level of significance State the null and alternate hypotheses.
(b) Find the value of the chi-square statistic for the sample. What are the degrees of freedom Check Requirements What assumptions are you making about the original distribution
(c) Find or estimate the P -value of the sample test statistic.
(d) Based on your answers in parts (a)-(c), will you reject or fail to reject the null hypothesis of independence
(e) Interpret your conclusion in the context of the application.
In each of the following problems, assume a normal population distribution.
Veterinary Science: Tranquilizer Jim Mead is a veterinarian who visits a Vermont farm to examine prize bulls. In order to examine a bull. Jim first gives the animal a tranquilizer shot. The effect of the shot is supposed to last an average of 65 minutes, and it usually does. However, Jim sometimes gets chased out of the pasture by a bull that recovers too soon, and other times he becomes worried about prize bulls that take too long to recover. By reading journals, Jim has found that the tranquilizer should have a mean duration time of 65 minutes, with a standard deviation of 15 minutes. A random sample of 10 of Jim's bulls had a mean tranquilized duration time of close to 65 minutes but a standard deviation of 24 minutes. At the 1% level of significance, is Jim justified in the claim that the variance is larger than that stated in his journal
Unlock Deck
Unlock for access to all 79 flashcards in this deck.
Unlock Deck
k this deck
14
Tires: Blowouts A consumer agency is investigating the blowout pressures of Soap Stone tires. A Soap Stone tire is said to blow out when it separates from the wheel rim due to impact forces usually caused by hitting a rock or a pothole in the road. A random sample of 30 Soap Stone tires were inflated to the recommended pressure, and then forces measured in foot-pounds were applied to each tire (1 foot-pound is the force of 1 pound dropped from a height of 1 foot). The customer complaint is that some Soap Stone tires blow out under small-impact forces, while other tires seem to be well made and don't have this fault. For the 30 test tires, the sample standard deviation of blowout forces was 1353 foot-pounds.
Soap Stone claims its tires will blow out at an average pressure of 20,000 foot-pounds, with a standard deviation of 1020 foot-pounds. The average blowout force is not in question, but the variability of blowout forces is in question. Using a 0.01 level of significance, test the claim that the variance of blowout pressures is more than Soap Stone claims it is.
Soap Stone claims its tires will blow out at an average pressure of 20,000 foot-pounds, with a standard deviation of 1020 foot-pounds. The average blowout force is not in question, but the variability of blowout forces is in question. Using a 0.01 level of significance, test the claim that the variance of blowout pressures is more than Soap Stone claims it is.
Unlock Deck
Unlock for access to all 79 flashcards in this deck.
Unlock Deck
k this deck
15
New Car: Negotiating Price Suppose you are interested in buying a new Toyota Corolla. You are standing on the scales lot looking at a model with different optioms. The list price on the vehicle. As a salesperson approaches, you wonder what the dealer invoice price is for this model with its options. The following data are based on information taken from Consumer Guide (Vol. 677). Let x be the list price (in thousands of dollars) for a random selection of Toyota Corolla of different models and options. Let y be the dealer invoice (in thousands of dollars) for the given vehicle.
(a) Verify that x = 79.6, y = 72.1, x 2 = 1057.76, y 2 = 867.49, xy = 957.84, and r 0.956.
(b) Use a 1% level of significance to test the claim that 0.
(c) Verify that S e 0.1527, a 1.965, and b 0.758.
(d) Find the predicted dealer invoice when the list price is x = 14 (thousand dollars).
(e) Find a 85% confidence interval for y when x = 14 (thousand dollars).
(f) Use a 1% level of significance to test the claim that 0.
(a) Verify that x = 79.6, y = 72.1, x 2 = 1057.76, y 2 = 867.49, xy = 957.84, and r 0.956.(b) Use a 1% level of significance to test the claim that 0.
(c) Verify that S e 0.1527, a 1.965, and b 0.758.
(d) Find the predicted dealer invoice when the list price is x = 14 (thousand dollars).
(e) Find a 85% confidence interval for y when x = 14 (thousand dollars).
(f) Use a 1% level of significance to test the claim that 0.
Unlock Deck
Unlock for access to all 79 flashcards in this deck.
Unlock Deck
k this deck
16
For Problems 9-19, please provide the following information:
(a) What is the level of significance State the null and alternate hypotheses.
(b) Check Requirements Find the value of the chi-square statistic for the sample. Are all the expected frequencies greater than 5 What sampling distribution will you use What are the degrees of freedom
(c) Find or estimate the P -value of the sample test statistic.
(d) Based on your answers in parts (a)-(c), will you reject or fail to reject the null hypothesis of independence
(e) Interpret your conclusion in the context of the application.
Use the expected values E to the hundredths place.
Psychology: Myers-Briggs The following table shows the Myers-Briggs personality preferences for a random sample of 519 people in the listed professions ( Myers-Briggs Type Indicator Atlas of Type Tables , by Macdaid, McCaulley, and Kainz). T refers to thinking and F refers to feeling.
Use the chi-square test to determine if the listed occupations and personality preferences are independent at the 0.01 level of signicance.
Unlock Deck
Unlock for access to all 79 flashcards in this deck.
Unlock Deck
k this deck
17
For Problems 5-14, please provide the following information.
(a) What is the level of significance State the null and alternate hypotheses.
(b) Find the value of the chi-square statistic for the sample. Are all the expected frequencies greater than 5 What sampling distribution will you use What are the degrees of freedom
(c) Find or estimate the P -value of the sample test statistic.
(d) Based on your answers in parts (a)-(c), will you reject or fail to reject the null hypothesis that the population fits the specified distribution of categories
(e) Interpret your conclusion in the context of the application.
Archaeology: Stone Tools The types of raw materials used to construct stone tools found at an archaeological site Casa del Rito are shown below ( Bandelier Archaeological Excavation project , edited by Kohler and Root). A random sample of 1486 stone tools was obtained from a current excavation site.
Use a 1% level of significance to test the claim that the regional distribution of raw materials fits the distribution at the current excavation site.
Unlock Deck
Unlock for access to all 79 flashcards in this deck.
Unlock Deck
k this deck
18
For Problems 3-11, please provide the following information:
(a) What is the level of significance State the null and alternate hypotheses.
(b) Find the value of the chi-square statistic for the sample. What are the degrees of freedom Check Requirements What assumptions are you making about the original distribution
(c) Find or estimate the P -value of the sample test statistic.
(d) Based on your answers in parts (a)-(c), will you reject or fail to reject the null hypothesis of independence
(e) Interpret your conclusion in the context of the application.
In each of the following problems, assume a normal population distribution.
Engineering: Jet Engines The fan blades on commercial jet engines must be replaced when wear on these parts indicates too much variability to pass inspection. If a single fan blade broke during operation, it could severely endanger a flight. A large engine contains thousands of fan blades and safety regulations require that variability measurements on the population of all blades not exceed 2 = 0.18 mm 2. An engine inspector took a random sample of 61 fan blades from an engine. She measured each blade and found a sample variance of 0.27 mm 2. Using a 0.01 level of significance, is the inspector justified in claiming that all the engine fan blades must be replaced
Unlock Deck
Unlock for access to all 79 flashcards in this deck.
Unlock Deck
k this deck
19
For all Hypothesis tests, please provide the following information:
(i) What is the level of significance State the null and alternate hypotheses.
(ii) Check Requirements What sampling distribution will you use What assumptions are you making What is the value of the sample test statistic
(iii) Find (or estimate) the P -value. Sketch the sampling distribution and show the area corresponding to the P -value.
(iv) Based on your answers in parts (i)-(iii), will you reject or fail to reject the null hypothesis Are the data statistically significant at level
(v) Interpret your conclusion in the context of the application.
Testing Paired Differences Phosphorus is a chemical that is found in many household cleaning products. Unfortunately, phosphorus also finds its way into surface water, where it can harm fish, plants, and other wildlife. Two methods of phosphorus reduction are being studied. At a random sample of 7 locations, both methods were used and the total phosphorus reduction (mg/L) was reduced (Reference: EPA report 832-R-93-005).
Do these data indicate a difference (either way) in the average reduction of phosphorus between the two methods Use = 0.05
Unlock Deck
Unlock for access to all 79 flashcards in this deck.
Unlock Deck
k this deck
20
New Car: Negotiating Price Suppose you are interested in buying a new Lincoln Navigator or Town Car. You are standing on the sales lot looking at a model with different options. The list price is on the vehicle. As a salesperson approaches, you wonder what the dealer invoice price is for this model with its options. The following data are based on information taken from Consumer Guide (Vol. 677). Let x be the list price (in thousands of dollars) for a random selection of these cars of different models and options. Let y be the dealer invoice (in thousands of dollars) for the given vehicle.
(a) Verify that x = 193.2, y = 177.2, x 2 = 7676.71, y 2 = 6432.5, xy = 7023.19, and r 0.977.
(b) Use a 1% level of significance to test the claim that 0.
(c) Verify that S e 1.5223, a 1.4084, and b 0.8794.
(d) Find the predicted dealer invoice when the list price is x = 40 (thousand dollars).
(e) Find a 95% confidence interval for y when x = 40 (thousand dollars).
(f) Use a 1% level of significance to test the claim that 0.
(a) Verify that x = 193.2, y = 177.2, x 2 = 7676.71, y 2 = 6432.5, xy = 7023.19, and r 0.977.
(b) Use a 1% level of significance to test the claim that 0.
(c) Verify that S e 1.5223, a 1.4084, and b 0.8794.
(d) Find the predicted dealer invoice when the list price is x = 40 (thousand dollars).
(e) Find a 95% confidence interval for y when x = 40 (thousand dollars).
(f) Use a 1% level of significance to test the claim that 0.
Unlock Deck
Unlock for access to all 79 flashcards in this deck.
Unlock Deck
k this deck
21
For Problems 9-19, please provide the following information:
(a) What is the level of significance State the null and alternate hypotheses.
(b) Check Requirements Find the value of the chi-square statistic for the sample. Are all the expected frequencies greater than 5 What sampling distribution will you use What are the degrees of freedom
(c) Find or estimate the P -value of the sample test statistic.
(d) Based on your answers in parts (a)-(c), will you reject or fail to reject the null hypothesis of independence
(e) Interpret your conclusion in the context of the application.
Use the expected values E to the hundredths place.
Archaeology: Pottery The following table shows site type and type of pottery for a random sample of 628 sherds at a location in Sand Canyon Archaeological Project, Colorado ( The Sand Canyon Archaeological Project , edited by Lipe):
Use the chi-square test to determine if site type and pottery type are independent at the 0.01 level of signicance.
Unlock Deck
Unlock for access to all 79 flashcards in this deck.
Unlock Deck
k this deck
22
For Problems 5-14, please provide the following information.
(a) What is the level of significance State the null and alternate hypotheses.
(b) Find the value of the chi-square statistic for the sample. Are all the expected frequencies greater than 5 What sampling distribution will you use What are the degrees of freedom
(c) Find or estimate the P -value of the sample test statistic.
(d) Based on your answers in parts (a)-(c), will you reject or fail to reject the null hypothesis that the population fits the specified distribution of categories
(e) Interpret your conclusion in the context of the application.
Ecology: Deer The types of browse favored by deer are shown in the following table ( The Mule Deer of Mesa Verde National Park , edited by Mierau and Schmidt). Using binoculars, volunteers observed the feeding habits of a random sample of 320 deer.
Use a 5% level of significance to test the claim that the natural distribution of browse fits the deer feeding pattern.
Unlock Deck
Unlock for access to all 79 flashcards in this deck.
Unlock Deck
k this deck
23
For Problems 3-11, please provide the following information:
(a) What is the level of significance State the null and alternate hypotheses.
(b) Find the value of the chi-square statistic for the sample. What are the degrees of freedom Check Requirements What assumptions are you making about the original distribution
(c) Find or estimate the P -value of the sample test statistic.
(d) Based on your answers in parts (a)-(c), will you reject or fail to reject the null hypothesis of independence
(e) Interpret your conclusion in the context of the application.
In each of the following problems, assume a normal population distribution.
Law: Bar Exam A factor in determining the usefulness of an examination as a measure of demonstrated ability is the amount of spread that occurs in the grades. If the spread or variation of examination scores is very small, it usually means that the examination was either too hard or too easy. However, if the variance of scores is moderately large, then there is a definite difference in scores between "better," "average," and "poorer" students. A group of attorneys in a Midwestern state has been given the task of making up this year's bar examination for the state. The examination has 500 total possible points, and from the history of past examinations, it is known that a standard deviation of around 60 points is desirable. Of course, too large or too small a standard deviation is not good. The attorneys want to test their examination to see how good it is. A preliminary version of the examination (with slight modifications to protect the integrity of the real examination) is given to a random sample of 24 newly graduated law students. Their scores give a sample standard deviation of 72 points. Using a 0.01 level of significance, test the claim that the population standard deviation for the new examination is 60 against the claim that the population standard deviation is different from 60.
Unlock Deck
Unlock for access to all 79 flashcards in this deck.
Unlock Deck
k this deck
24
Critical Thinking: Using Information from a Computer Display to Test for Significance Refer to the Minitab printout regarding prehistoric pottery.
(a) Minitab calls the explanatory variable the predictor variable. Which is the predictor variable, the diameter of the pot or the height
(b) For the least-squares line
, what is the value of the constant a What is the value of the slope b ( Note : the slope is the coefficient of the predictor variable). Write the equation of the least-squares line.
(c) The P -value for a two-tailed test corresponding to each coefficient is listed under P. The t value corresponding to the coefficient is listed under T. What is the P -value of the slope What are the hypotheses for a two-tailed test = 0 Based on the P -value in the printout, do we reject or fail to reject the null hypothesis for = 0.01
(d) Recall that the t value and resulting P -value of the slope b equal the t value and resulting P -value of the corresponding correlation coefficient r. To find the value of the sample correlation coefficient r , take the square root of the R-Sq value shown in the display. What is the value of r Consider a two-tailed test for . Based on the P -value shown in the Minitab display, is the correlation coefficient significant at the 1% level of significance
(a) Minitab calls the explanatory variable the predictor variable. Which is the predictor variable, the diameter of the pot or the height
(b) For the least-squares line
, what is the value of the constant a What is the value of the slope b ( Note : the slope is the coefficient of the predictor variable). Write the equation of the least-squares line.(c) The P -value for a two-tailed test corresponding to each coefficient is listed under P. The t value corresponding to the coefficient is listed under T. What is the P -value of the slope What are the hypotheses for a two-tailed test = 0 Based on the P -value in the printout, do we reject or fail to reject the null hypothesis for = 0.01
(d) Recall that the t value and resulting P -value of the slope b equal the t value and resulting P -value of the corresponding correlation coefficient r. To find the value of the sample correlation coefficient r , take the square root of the R-Sq value shown in the display. What is the value of r Consider a two-tailed test for . Based on the P -value shown in the Minitab display, is the correlation coefficient significant at the 1% level of significance
Unlock Deck
Unlock for access to all 79 flashcards in this deck.
Unlock Deck
k this deck
25
Expand Your Knowledge: Sample Size and Significance of r
(a) Suppose n = 6 and the sample correlation coefficient is r = 0.90. Is r significant at the 1% level of significance (based on a two-tailed test)
(b) Suppose n = 10 and the sample correlation coefficient is r = 0.90. Is r significant at the 1% level of significance (based on a two-tailed test)
(c) Explain why the test results of parts (a) and (b) are different even though the sample correlation coefficient r = 0.90 is the same in both parts. Does it appear that sample size plays an important role in determining the significance of a correlation coefficient Explain.
Unlock Deck
Unlock for access to all 79 flashcards in this deck.
Unlock Deck
k this deck
26
For Problems 9-19, please provide the following information:
(a) What is the level of significance State the null and alternate hypotheses.
(b) Check Requirements Find the value of the chi-square statistic for the sample. Are all the expected frequencies greater than 5 What sampling distribution will you use What are the degrees of freedom
(c) Find or estimate the P -value of the sample test statistic.
(d) Based on your answers in parts (a)-(c), will you reject or fail to reject the null hypothesis of independence
(e) Interpret your conclusion in the context of the application.
Use the expected values E to the hundredths place.
Archaeology: Pottery The following table shows ceremonial ranking and type of pottery sherd for a random sample of 434 sherds at a location in the Sand Canyon Archaeological Project, Colorado ( The Architecture of Social Integration in Prehistoric Pueblos , edited by Lipe and Hegmon):
Use a chi-square test to determine if ceremonial ranking and pottery type are independent at the 0.05 level of significance.
Unlock Deck
Unlock for access to all 79 flashcards in this deck.
Unlock Deck
k this deck
27
For Problems 5-14, please provide the following information.
(a) What is the level of significance State the null and alternate hypotheses.
(b) Find the value of the chi-square statistic for the sample. Are all the expected frequencies greater than 5 What sampling distribution will you use What are the degrees of freedom
(c) Find or estimate the P -value of the sample test statistic.
(d) Based on your answers in parts (a)-(c), will you reject or fail to reject the null hypothesis that the population fits the specified distribution of categories
(e) Interpret your conclusion in the context of the application.
Meteorology: Normal Distribution The following problem is based on information from the National Oceanic and Atmospheric Administration (NOAA) Environmental Data Service. Let x be a random variable that represents the average daily temperature (in degrees Fahrenheit) in July in the town of Kit Carson, Colorado. The x distribution has a mean of approximately 75°F and standard deviation of approximately 8°F. A 20-year study (620 July days) gave the entries in the rightmost column of the following table.
(i) Remember that = 75 and = 8. Examine Figure 7-3 in Chapter 7. Write a brief explanation for Columns I, II, and III in the context of this problem.
(ii) Use a 1% level of significance to test the claim that the average daily July temperature follows a normal distribution with = 75 and = 8.
Unlock Deck
Unlock for access to all 79 flashcards in this deck.
Unlock Deck
k this deck
28
For Problems 3-11, please provide the following information:
(a) What is the level of significance State the null and alternate hypotheses.
(b) Find the value of the chi-square statistic for the sample. What are the degrees of freedom Check Requirements What assumptions are you making about the original distribution
(c) Find or estimate the P -value of the sample test statistic.
(d) Based on your answers in parts (a)-(c), will you reject or fail to reject the null hypothesis of independence
(e) Interpret your conclusion in the context of the application.
In each of the following problems, assume a normal population distribution.
Engineering: Solar Batteries A set of solar batteries is used in a research satellite. The satellite can run on only one battery, but it runs best if more than one battery is used. The variance 2 of lifetimes of these batteries affects the useful lifetime of the satellite before it goes dead. If the variance is too small, all the batteries will tend to die at once. Why If the variance is too large, the batteries are simply not dependable. Why Engineers have determined that a variance of 2 = 23 months (squared) is most desirable for these batteries. A random sample of 22 batteries gave a sample variance of 14.3 months (squared). Using a 0.05 level of significance, test the claim that 2 = 23 against the claim that 2 is different from 23.
Unlock Deck
Unlock for access to all 79 flashcards in this deck.
Unlock Deck
k this deck
29
Packaging: Corn Flakes A machine that puts corn flakes into boxes is adjusted to put an average of 15 ounces into each box, with standard deviation of 0.25 ounce. If a random sample of 12 boxes gave a sample standard deviation of 0.38 ounce, do these data support the claim that the variance has increased and the machine needs to be brought back into adjustment (Use a 0.01 level of significance.)
Unlock Deck
Unlock for access to all 79 flashcards in this deck.
Unlock Deck
k this deck
30
Expand Your Knowledge: Student's t Value for Sample r and for Sample b It is not obvious from the formulas, but the values of the sample test statistic t for the correlation coefficient and for the slope of the least-squares line are equal for the same data set. This fact is based on the relation.
where s y and s x are the sample standard deviations of the x and y values, respectively.
(a) Many computer software packages give the t value and corresponding P -value for b. If is significant, is significant
(b) When doing statistical tests "by hand," it is easier to computer the sample test statistic t for the sample correlation coefficient r than it is to compute the sample test statistic t for the slope b of the sample least-squares line. Compare the results of parts (b) and (f) for Problems 7-12 of this problem set. Is the sample test statistic t for r the same as the corresponding test statistic for b If you conclude that is positive, can you conclude that is positive at the same level of significance If you conclude that is not significant, is also not significant at the same level of significance
Unlock Deck
Unlock for access to all 79 flashcards in this deck.
Unlock Deck
k this deck
31
For Problems 9-19, please provide the following information:
(a) What is the level of significance State the null and alternate hypotheses.
(b) Check Requirements Find the value of the chi-square statistic for the sample. Are all the expected frequencies greater than 5 What sampling distribution will you use What are the degrees of freedom
(c) Find or estimate the P -value of the sample test statistic.
(d) Based on your answers in parts (a)-(c), will you reject or fail to reject the null hypothesis of independence
(e) Interpret your conclusion in the context of the application.
Use the expected values E to the hundredths place.
Ecology: Buffalo The following table shows age distribution and location of a random sample of 166 buffalo in Yellowstone National Park (based on information from The Bison of Yellowstone National Park , National Park Service Scientific Monograph Series):
Use a chi-square test to determine if age distribution and location are independent at the 0.05 level of significance.
Unlock Deck
Unlock for access to all 79 flashcards in this deck.
Unlock Deck
k this deck
32
For Problems 5-14, please provide the following information.
(a) What is the level of significance State the null and alternate hypotheses.
(b) Find the value of the chi-square statistic for the sample. Are all the expected frequencies greater than 5 What sampling distribution will you use What are the degrees of freedom
(c) Find or estimate the P -value of the sample test statistic.
(d) Based on your answers in parts (a)-(c), will you reject or fail to reject the null hypothesis that the population fits the specified distribution of categories
(e) Interpret your conclusion in the context of the application.
Meteorology: Normal Distribution Let x be a random variable that represents the average daily temperature (in degrees Fahrenheit) in January for the town of Hana, Maui. The x variable has a mean of approximately 68°F and standard deviation of approximately 4°F (see reference in Problem 9). A 20-year study (620 January days) gave the entries in the rightmost column of the following table.
(i) Remember that = 68 and = 4. Examine Figure 7-3 in Chapter 7. Write a brief explanation for columns I, II, and III in the context of this problem.
(ii) Use a 1% level of significance to test the claim that the average daily January temperature follows a normal distribution with = 68 and = 4.
Unlock Deck
Unlock for access to all 79 flashcards in this deck.
Unlock Deck
k this deck
33
Statistical Literacy Of the following random variable, which have only non-negative values z , t , chi-square
Unlock Deck
Unlock for access to all 79 flashcards in this deck.
Unlock Deck
k this deck
34
For all Hypothesis tests, please provide the following information:
(i) What is the level of significance State the null and alternate hypotheses.
(ii) Check Requirements What sampling distribution will you use What assumptions are you making What is the value of the sample test statistic
(iii) Find (or estimate) the P -value. Sketch the sampling distribution and show the area corresponding to the P -value.
(iv) Based on your answers in parts (i)-(iii), will you reject or fail to reject the null hypothesis Are the data statistically significant at level
(v) Interpret your conclusion in the context of the application.
Testing and Estimating m 1 - m 2 , s 1 and s 2 Unknown In the airline business. "on-time" flight arrival is important for connecting flights and general customer satisfaction. Is there a difference between summer and winter average on-time flight arrivals Let x 1 be a random variable that represents percentage of on-time arrivals at major airports in the summer. Let x 2 be a random variable that represents percentage of on-time arrivals at major airports in the winter. A random sample of n 1 = 16 major airports showed that
, with s 1 = 5.2%. A random sample of n 2 = 18 major airports showed that
, with s 2 = 8.6% (Reference: Statistical Abstract of the United States ).
(a) Does this information indicate a difference (either way) in the population mean percentage of ontime arrivals for summer compared to winter Use = 0.05.
(b)Find a 95% confidence interval for µ 1 µ 2.
(c) What assumptions about the original populations have you made for the methods used
(i) What is the level of significance State the null and alternate hypotheses.
(ii) Check Requirements What sampling distribution will you use What assumptions are you making What is the value of the sample test statistic
(iii) Find (or estimate) the P -value. Sketch the sampling distribution and show the area corresponding to the P -value.
(iv) Based on your answers in parts (i)-(iii), will you reject or fail to reject the null hypothesis Are the data statistically significant at level
(v) Interpret your conclusion in the context of the application.
Testing and Estimating m 1 - m 2 , s 1 and s 2 Unknown In the airline business. "on-time" flight arrival is important for connecting flights and general customer satisfaction. Is there a difference between summer and winter average on-time flight arrivals Let x 1 be a random variable that represents percentage of on-time arrivals at major airports in the summer. Let x 2 be a random variable that represents percentage of on-time arrivals at major airports in the winter. A random sample of n 1 = 16 major airports showed that
, with s 1 = 5.2%. A random sample of n 2 = 18 major airports showed that , with s 2 = 8.6% (Reference: Statistical Abstract of the United States ).(a) Does this information indicate a difference (either way) in the population mean percentage of ontime arrivals for summer compared to winter Use = 0.05.
(b)Find a 95% confidence interval for µ 1 µ 2.
(c) What assumptions about the original populations have you made for the methods used
Unlock Deck
Unlock for access to all 79 flashcards in this deck.
Unlock Deck
k this deck
35
Expand Your Knowledge: Time Series and Serial Correlation Serial Correlation , also known as autocorrelation , describes the extent to which the result in one period of a time series is related to the result in the text period. A time series with high serial correlation is said to be very predictable from one period to the next. If the serial correlation is low (or near zero), the time series is considered to be much less predictable. For more information about serial correlation, see the book Ibbotson SBBI published by Morningstar.
A research veterinarian at a major university has developed a new vaccine to protect horses from West Nile virus. An important question is: How predictable is the buildup of antibodies in the horse's blood after the vaccination is given A large random sample of horses from Wyoming were given the vaccination. The average antibody buildup factor (as determined from blood samples) was measured each week after the vaccination for eight weeks. Results are shown in the following time series:
Original Time Series
To construct a serial correlation, we simply use data pairs ( x , y ) where x = original buildup factor data and y = original data shifted ahead by one week. This gives us the following data set. Since we are shifting one week ahead, we now have 7 data pairs (not 8).
Data for Serial Correlation
For convenience, we are given the following sums:
x = 48.6 y = 58.5 x 2 = 383.84 y 2 = 529.37 xy = 448.7
(a) Use the sums provided (or a calculator with least-squares regression) to compute the equation of the sample least squares line,
. If the buildup factor was x = 5.8 one week, what would you predict the buildup factor to be the next week
(b) Compute the sample correlation coefficient r and the coefficient of determination r 2. Test p 0 at the 1% level of significance. Would you say the time series of antibody buildup factor is relatively predictable from one week to the next Explain.
A research veterinarian at a major university has developed a new vaccine to protect horses from West Nile virus. An important question is: How predictable is the buildup of antibodies in the horse's blood after the vaccination is given A large random sample of horses from Wyoming were given the vaccination. The average antibody buildup factor (as determined from blood samples) was measured each week after the vaccination for eight weeks. Results are shown in the following time series:
Original Time Series
To construct a serial correlation, we simply use data pairs ( x , y ) where x = original buildup factor data and y = original data shifted ahead by one week. This gives us the following data set. Since we are shifting one week ahead, we now have 7 data pairs (not 8).
Data for Serial Correlation
For convenience, we are given the following sums:
x = 48.6 y = 58.5 x 2 = 383.84 y 2 = 529.37 xy = 448.7
(a) Use the sums provided (or a calculator with least-squares regression) to compute the equation of the sample least squares line,
. If the buildup factor was x = 5.8 one week, what would you predict the buildup factor to be the next week(b) Compute the sample correlation coefficient r and the coefficient of determination r 2. Test p 0 at the 1% level of significance. Would you say the time series of antibody buildup factor is relatively predictable from one week to the next Explain.
Unlock Deck
Unlock for access to all 79 flashcards in this deck.
Unlock Deck
k this deck
36
For Problems 9-19, please provide the following information:
(a) What is the level of significance State the null and alternate hypotheses.
(b) Check Requirements Find the value of the chi-square statistic for the sample. Are all the expected frequencies greater than 5 What sampling distribution will you use What are the degrees of freedom
(c) Find or estimate the P -value of the sample test statistic.
(d) Based on your answers in parts (a)-(c), will you reject or fail to reject the null hypothesis of independence
(e) Interpret your conclusion in the context of the application.
Use the expected values E to the hundredths place.
Psychology: Myers-Briggs The following table shows the Myers-Briggs personality preference and area of study for a random sample of 519 college students ( Applications of the Myers-Briggs Type Indicator in Higher Education , edited by Provost and Anchors). In the table, IN refers to introvert, intuitive; EN refers to extrovert, intuitive; IS refers to introvert, sensing; and ES refers to extrovert, sensing.
Use a chi-square test to determine if Myers-Briggs preference type is independent of area of study at the 0.05 level of significance.
Unlock Deck
Unlock for access to all 79 flashcards in this deck.
Unlock Deck
k this deck
37
For Problems 5-14, please provide the following information.
(a) What is the level of significance State the null and alternate hypotheses.
(b) Find the value of the chi-square statistic for the sample. Are all the expected frequencies greater than 5 What sampling distribution will you use What are the degrees of freedom
(c) Find or estimate the P -value of the sample test statistic.
(d) Based on your answers in parts (a)-(c), will you reject or fail to reject the null hypothesis that the population fits the specified distribution of categories
(e) Interpret your conclusion in the context of the application.
Ecology: Fish The Fish and Game Department stocked Lake Lulu with fish in the following proportions: 30% catfish, 15% bass, 40% bluegill, and 15% pike. Five years later it sampled the lake to see if the distribution of fish had changed. It found that the 500 fish in the sample were distributed as follows:
In the 5-year interval, did the distribution of fish change at the 0.05 level
Unlock Deck
Unlock for access to all 79 flashcards in this deck.
Unlock Deck
k this deck
38
For all Hypothesis tests, please provide the following information:
(i) What is the level of significance State the null and alternate hypotheses.
(ii) Check Requirements What sampling distribution will you use What assumptions are you making What is the value of the sample test statistic
(iii) Find (or estimate) the P -value. Sketch the sampling distribution and show the area corresponding to the P -value.
(iv) Based on your answers in parts (i)-(iii), will you reject or fail to reject the null hypothesis Are the data statistically significant at level
(v) Interpret your conclusion in the context of the application.
Inferences for Linear Regression Plate tectonics and the spread of the ocean floor are very important in modern studies of earthquakes and earth science in general. A random sample of islands in the Indian Ocean gave the following information, where x = age of a volcanic island in the Indian Ocean (units in 10 6 years) and y = distance of the island from the center of the midoceanic ridge (units in 100 km).
x = 415; y = 128; x 2 = 30,203 y 2 = 2558.5; xy = 8133.
(a) Verify that the standard error of estimate S e 6.50.
(b) Verify that the sample correlation coefficient r 6.50. Use a 5% level of significance to test that is positive.
(c) Verify that the equation of the least-squares line is
. Use a 5% level of significance to test that is positive.
(d) Given that the age of a volcanic island is 55 (units 10 6 years), predict how far the island is from the center of the midoceanic ridge (units in 100 km). Find an 85% confidence interval for the prediction.
(i) What is the level of significance State the null and alternate hypotheses.
(ii) Check Requirements What sampling distribution will you use What assumptions are you making What is the value of the sample test statistic
(iii) Find (or estimate) the P -value. Sketch the sampling distribution and show the area corresponding to the P -value.
(iv) Based on your answers in parts (i)-(iii), will you reject or fail to reject the null hypothesis Are the data statistically significant at level
(v) Interpret your conclusion in the context of the application.
Inferences for Linear Regression Plate tectonics and the spread of the ocean floor are very important in modern studies of earthquakes and earth science in general. A random sample of islands in the Indian Ocean gave the following information, where x = age of a volcanic island in the Indian Ocean (units in 10 6 years) and y = distance of the island from the center of the midoceanic ridge (units in 100 km).
x = 415; y = 128; x 2 = 30,203 y 2 = 2558.5; xy = 8133.
(a) Verify that the standard error of estimate S e 6.50.
(b) Verify that the sample correlation coefficient r 6.50. Use a 5% level of significance to test that is positive.
(c) Verify that the equation of the least-squares line is
. Use a 5% level of significance to test that is positive.(d) Given that the age of a volcanic island is 55 (units 10 6 years), predict how far the island is from the center of the midoceanic ridge (units in 100 km). Find an 85% confidence interval for the prediction.
Unlock Deck
Unlock for access to all 79 flashcards in this deck.
Unlock Deck
k this deck
39
Critical Thinking: Using Information in a Computer Display to Fine a Confidence interval Refer to the Minitab printout regarding prehistoric pottery.
(a) The standard error S c of the linear regression model is given in the printout as "S." What is the value of S c
(b) The standard error of the coefficient of the predictor variable is found under "SE Coef." Recall that the standard error for b is
From the Minitab display, what is the value of the standard error for the slope b
(a) The standard error S c of the linear regression model is given in the printout as "S." What is the value of S c
(b) The standard error of the coefficient of the predictor variable is found under "SE Coef." Recall that the standard error for b is
From the Minitab display, what is the value of the standard error for the slope b
Unlock Deck
Unlock for access to all 79 flashcards in this deck.
Unlock Deck
k this deck
40
Expand Your Knowledge: Time Series and Serial Correlation An Internet advertising agency is studying the number of "hits" on a certain website during an advertising compaign. It is hoped that as the compaign progresses, the number of hits on the website will also increase in a predictable way from one day to the next. For 10 days of the compaign, the number of hits × 10 5 is shown:
Original Time Series
(a) To construct a serial correlation, we use data pairs ( x , y ) where x = original data and y = original data shifted ahead by one time period. Verify that the data set ( x , y ) for serial correlation is shown here. (For discussion of serial correlation, see Problem15.)
(b) For the ( x , y ) data set of part (a), compute the equation of the sample least-squares line
. If the number of hits was 9.3 (×10 5 ) one day, what do you predict for the number of hits the next day
(c) Compute the sample correlation coefficient r and the coefficient of determination r 2. Test 0 at the 1% level of significance. Would you say the time series of website hits is relatively predictable from one day to the next Explain.
Original Time Series
(a) To construct a serial correlation, we use data pairs ( x , y ) where x = original data and y = original data shifted ahead by one time period. Verify that the data set ( x , y ) for serial correlation is shown here. (For discussion of serial correlation, see Problem15.)
(b) For the ( x , y ) data set of part (a), compute the equation of the sample least-squares line
. If the number of hits was 9.3 (×10 5 ) one day, what do you predict for the number of hits the next day(c) Compute the sample correlation coefficient r and the coefficient of determination r 2. Test 0 at the 1% level of significance. Would you say the time series of website hits is relatively predictable from one day to the next Explain.
Unlock Deck
Unlock for access to all 79 flashcards in this deck.
Unlock Deck
k this deck
41
For Problems 9-19, please provide the following information:
(a) What is the level of significance State the null and alternate hypotheses.
(b) Check Requirements Find the value of the chi-square statistic for the sample. Are all the expected frequencies greater than 5 What sampling distribution will you use What are the degrees of freedom
(c) Find or estimate the P -value of the sample test statistic.
(d) Based on your answers in parts (a)-(c), will you reject or fail to reject the null hypothesis of independence
(e) Interpret your conclusion in the context of the application.
Use the expected values E to the hundredths place.
Sociology: Movie Preference Mr. Acosta, a sociologist, is doing a study to see if there is a relationship between the age of a young adult (18 to 35 years old) and the type of movie preferred. A random sample of 93 adults revealed the following data. Test whether age and type of movie preferred are independent at the 0.05 level.
Unlock Deck
Unlock for access to all 79 flashcards in this deck.
Unlock Deck
k this deck
42
For Problems 5-14, please provide the following information.
(a) What is the level of significance State the null and alternate hypotheses.
(b) Find the value of the chi-square statistic for the sample. Are all the expected frequencies greater than 5 What sampling distribution will you use What are the degrees of freedom
(c) Find or estimate the P -value of the sample test statistic.
(d) Based on your answers in parts (a)-(c), will you reject or fail to reject the null hypothesis that the population fits the specified distribution of categories
(e) Interpret your conclusion in the context of the application.
Library: Book Circulation The director of library services at Fairmont College did a survey of types of books (by subject) in the circulation library. Then she used library records to take a random sample of 888 books checked out last term and classified the books in the sample by subject. The results are shown below.
Using a 5% level of significance, test the claim that the subject distribution of books in the library fits the distribution of books checked out by students.
Unlock Deck
Unlock for access to all 79 flashcards in this deck.
Unlock Deck
k this deck
43
Statistical Literacy What is the symbol used for the population correlation coefficient
Unlock Deck
Unlock for access to all 79 flashcards in this deck.
Unlock Deck
k this deck
44
Teacher Ratings: Grades Professor Stone complains that student teacher rating depends on the grade the student receives. In other words, according to Professor Stone, a teacher who gives good grades gets good ratings, and a teacher who gives bad grades gets bad ratings. To test this claim, the Student Assembly took a random sample of 300 teacher ratings on which the student's grade for the course also was indicated. The results are given in the following table. Test the hypothesis that teacher ratings and student grades are independent at the 0.01 level of significance.
Unlock Deck
Unlock for access to all 79 flashcards in this deck.
Unlock Deck
k this deck
45
Expand Your Knowledge: Time Series and Serial Correlation A company that produces and markets video games wants to estimate the predictability of per capita consumer spending on video games in the United States. For the most recent seven years, the amount of annual spending per person per year in shown here (Reference: Statistical Abstract of the United States , 128 th edition):
(a) To construct a serial correlation, we use data pairs ( x , y ) where x = original data and y = original data shifted ahead by one time period. Verify that the data set ( x , y ) for serial correlation is shown here. (For discussion of serial correlation, see Problem 15.)
(b) For the ( x , y ) data set of part (a), compute the equation of the sample least-squares line
. If the per capita spending was x = $42 one year, what do you predict for the spending the next year
(c) Compute the sample correlation coefficient r and the coefficient of determination r 2. Test 0 at the 1% level of significance. Would you say the time series of per capita spending on video games is relatively predictable from one year to the next Explain.
(a) To construct a serial correlation, we use data pairs ( x , y ) where x = original data and y = original data shifted ahead by one time period. Verify that the data set ( x , y ) for serial correlation is shown here. (For discussion of serial correlation, see Problem 15.)
(b) For the ( x , y ) data set of part (a), compute the equation of the sample least-squares line
. If the per capita spending was x = $42 one year, what do you predict for the spending the next year(c) Compute the sample correlation coefficient r and the coefficient of determination r 2. Test 0 at the 1% level of significance. Would you say the time series of per capita spending on video games is relatively predictable from one year to the next Explain.
Unlock Deck
Unlock for access to all 79 flashcards in this deck.
Unlock Deck
k this deck
46
For Problems 9-19, please provide the following information:
(a) What is the level of significance State the null and alternate hypotheses.
(b) Check Requirements Find the value of the chi-square statistic for the sample. Are all the expected frequencies greater than 5 What sampling distribution will you use What are the degrees of freedom
(c) Find or estimate the P -value of the sample test statistic.
(d) Based on your answers in parts (a)-(c), will you reject or fail to reject the null hypothesis of independence
(e) Interpret your conclusion in the context of the application.
Use the expected values E to the hundredths place.
Sociology: Ethnic Groups After a large fund drive to help the Boston City Library, the following information was obtained from a random sample of contributors to the library fund. Using a 1% level of significance, test the claim that the amount contributed to the library fund is independent of ethnic group.
Unlock Deck
Unlock for access to all 79 flashcards in this deck.
Unlock Deck
k this deck
47
For Problems 5-14, please provide the following information.
(a) What is the level of significance State the null and alternate hypotheses.
(b) Find the value of the chi-square statistic for the sample. Are all the expected frequencies greater than 5 What sampling distribution will you use What are the degrees of freedom
(c) Find or estimate the P -value of the sample test statistic.
(d) Based on your answers in parts (a)-(c), will you reject or fail to reject the null hypothesis that the population fits the specified distribution of categories
(e) Interpret your conclusion in the context of the application.
Census: California The accuracy of a census report on a city in southern California was questioned by some government officials. A random sample of 1215 people living in the city was used to check the report, and the results are shown next:
Using a 1% level of significance, test the claim that the census distribution and the sample distribution agree.
Unlock Deck
Unlock for access to all 79 flashcards in this deck.
Unlock Deck
k this deck
48
Statistical Literacy Of the following probability distributions, which are always symmetrical: normal. Student's t , chi-squares
Unlock Deck
Unlock for access to all 79 flashcards in this deck.
Unlock Deck
k this deck
49
For all Hypothesis tests, please provide the following information:
(i) What is the level of significance State the null and alternate hypotheses.
(ii) Check Requirements What sampling distribution will you use What assumptions are you making What is the value of the sample test statistic
(iii) Find (or estimate) the P -value. Sketch the sampling distribution and show the area corresponding to the P -value.
(iv) Based on your answers in parts (i)-(iii), will you reject or fail to reject the null hypothesis Are the data statistically significant at level
(v) Interpret your conclusion in the context of the application.
Testing and Estimating a Difference of Proportions p 1 p 2 How often do you go out dancing This question was asked by a professional survey group on behalf of the National Arts Survey. A random sample of n 1 = 95 single men showed that r 1 = 23 went out dancing occasionally. Another random sample of n 2 = 92 single women showed that r 2 = 19 went out dancing occasionally.
(a) Do these data indicate that the proportion of single men who go out dancing occasionally is higher than the proportion of single women Use a 5% level of significance. List the assumptions you made in solving this problem. Do you think these assumptions are realistic
(b) Compare a 90% confidence interval for the population difference of proportions p 1 p 2 of single men and single women who occasionally go out dancing.
Unlock Deck
Unlock for access to all 79 flashcards in this deck.
Unlock Deck
k this deck
50
Statistical Literacy In general, are chi-square distributions symmetrical or skewed If skewed, are they skewed right or left
Unlock Deck
Unlock for access to all 79 flashcards in this deck.
Unlock Deck
k this deck
51
For Problems 9-19, please provide the following information:
(a) What is the level of significance State the null and alternate hypotheses.
(b) Check Requirements Find the value of the chi-square statistic for the sample. Are all the expected frequencies greater than 5 What sampling distribution will you use What are the degrees of freedom
(c) Find or estimate the P -value of the sample test statistic.
(d) Based on your answers in parts (a)-(c), will you reject or fail to reject the null hypothesis of independence
(e) Interpret your conclusion in the context of the application.
Use the expected values E to the hundredths place.
Focus Problem: Archaeology The Focus Problem at the beginning of the chapter refers to excavations at Burnt Mesa Pueblo in Bandelier National Monument. One question the archaeologists asked was: Is the raw material used by prehistoric Indians for stone tool manufacture independent of the archaeological excavation site Two different excavation sites at Burnt Mesa Pueblo gave the information in the following table. Use a chi-square test with 5% level of significance to test the claim that the raw material used for construction of stone tools and the excavation site are independent.
Unlock Deck
Unlock for access to all 79 flashcards in this deck.
Unlock Deck
k this deck
52
For Problems 5-14, please provide the following information.
(a) What is the level of significance State the null and alternate hypotheses.
(b) Find the value of the chi-square statistic for the sample. Are all the expected frequencies greater than 5 What sampling distribution will you use What are the degrees of freedom
(c) Find or estimate the P -value of the sample test statistic.
(d) Based on your answers in parts (a)-(c), will you reject or fail to reject the null hypothesis that the population fits the specified distribution of categories
(e) Interpret your conclusion in the context of the application.
Accounting Records: Benford's Law Benford's Law states that the first nonzero digits of numbers drawn at random from a large complex data file have the following probability distribution (Reference: American Statistical Association, Chance , Vol. 12, No. 3, pp. 27-31; see also the Focus Problem of Chapter 9):
Suppose that n = 275 numerical entries were drawn at random from a large accounting file of a major corporation. The first nonzero digits were recorded for the sample.
Use a 1% level of significance to test the claim that the distribution of first nonzero digits in this accounting file follows Benford's Law.
Unlock Deck
Unlock for access to all 79 flashcards in this deck.
Unlock Deck
k this deck
53
For all Hypothesis tests, please provide the following information:
(i) What is the level of significance State the null and alternate hypotheses.
(ii) Check Requirements What sampling distribution will you use What assumptions are you making What is the value of the sample test statistic
(iii) Find (or estimate) the P -value. Sketch the sampling distribution and show the area corresponding to the P -value.
(iv) Based on your answers in parts (i)-(iii), will you reject or fail to reject the null hypothesis Are the data statistically significant at level
(v) Interpret your conclusion in the context of the application.
Goodness of Fit A recent national study gave the following information about declared major of undergraduate college students: humanities, 15%; science, 23%; business, 29%; education, 11%; social science, 10%; all other fields, 12% (Reference: Statistical Abstract of the United States ). A random sample of 215 college students in Colorado gave the following counts regarding college major: humanities, 24; science, 54; business, 70; education, 16; social science, 30; all other fields, 21. Does this information indicate that the distribution of college majors for Colorado students is different from the national distribution
Unlock Deck
Unlock for access to all 79 flashcards in this deck.
Unlock Deck
k this deck
54
In Problems 7-12, parts (a) and (b) relate to testing . Part (c) requests the value of S c. Part (e) relates to confidence intervals for prediction. Part (f) relates to testing . Answers may very due to rounding.
Basketball: Free Throws and Field Goals Let x be a random variable that represents the percentage of successful free throws a professional basketball players makes in a season. Let y be a random variable that represents the percentage of successful field goals a professional basketball player makes in a season. A random sample of n = 6 professional basketball players gave the following information (Reference: The Official NBA Basketball Encyclopedia , Villard Books):
(a) Verify that x = 439, y = 280, x 2 = 32,393, y 2 = 13,142, xy = 20,599, and r 0.784.
(b) Use a 5% level of significance to test the claim that p 0.
(c) Verify that S c 2.6964, a 16.542, and b 0.4117.
(d) Find the predicted percentage
of successful field goals for a player with x = 70% successful free throws.
(e) Fine a 90% confidence interval for y when x = 70.
(f) Use a 5% level of significance to test the claim that 0.
Basketball: Free Throws and Field Goals Let x be a random variable that represents the percentage of successful free throws a professional basketball players makes in a season. Let y be a random variable that represents the percentage of successful field goals a professional basketball player makes in a season. A random sample of n = 6 professional basketball players gave the following information (Reference: The Official NBA Basketball Encyclopedia , Villard Books):
(a) Verify that x = 439, y = 280, x 2 = 32,393, y 2 = 13,142, xy = 20,599, and r 0.784.
(b) Use a 5% level of significance to test the claim that p 0.
(c) Verify that S c 2.6964, a 16.542, and b 0.4117.
(d) Find the predicted percentage
of successful field goals for a player with x = 70% successful free throws.(e) Fine a 90% confidence interval for y when x = 70.
(f) Use a 5% level of significance to test the claim that 0.
Unlock Deck
Unlock for access to all 79 flashcards in this deck.
Unlock Deck
k this deck
55
Statistical Literacy For chi-square distributions, as the number of degrees of freedom increases, does any skewness increase or decrease Do chi-square distributions become more symmetrical (and normal) as the number of degrees of freedom becomes larger and larger
Unlock Deck
Unlock for access to all 79 flashcards in this deck.
Unlock Deck
k this deck
56
For Problems 9-19, please provide the following information:
(a) What is the level of significance State the null and alternate hypotheses.
(b) Check Requirements Find the value of the chi-square statistic for the sample. Are all the expected frequencies greater than 5 What sampling distribution will you use What are the degrees of freedom
(c) Find or estimate the P -value of the sample test statistic.
(d) Based on your answers in parts (a)-(c), will you reject or fail to reject the null hypothesis of independence
(e) Interpret your conclusion in the context of the application.
Use the expected values E to the hundredths place.
Political Affiliation: Spending Two random samples were drawn from members of the U.S. Congress. One sample was taken from members who are Democrats and the other from members who are Republicans. For each sample, the number of dollars spent on federal projects in each congressperson's home district was recorded.
(i) Make a cluster bar graph showing the percentage of Congress members from each party who spent each designated amount in their respective home districts.
(ii) Use a 1% level of significance to test whether congressional members of each political party spent designated amounts in the same proportions.
Unlock Deck
Unlock for access to all 79 flashcards in this deck.
Unlock Deck
k this deck
57
Statistical Literacy Does the x distribution need to be normal in order to use a chi-square distribution to test the variance Is it acceptable to use the chi-square distribution to test the variance if the x distribution is simply mound-shaped and more or less symmetrical
Unlock Deck
Unlock for access to all 79 flashcards in this deck.
Unlock Deck
k this deck
58
Statistical Literacy What is the symbol used for the slope of the population least-squares line
Unlock Deck
Unlock for access to all 79 flashcards in this deck.
Unlock Deck
k this deck
59
Sociology: Age Distribution A sociologist is studying the age of the population in Blue Valley. Ten years ago, the population was such that 20% were under 20 years old, 15% were in the 20-35 year old bracket, 30% were between 36 and 50, 25% were between 51 and 65, and 10% were over 65. A study done this year used a random sample of 210 residents. This sample showed.
At the 0.01 level of significance, has the age distribution of the population of Blue Valley changed
At the 0.01 level of significance, has the age distribution of the population of Blue Valley changed
Unlock Deck
Unlock for access to all 79 flashcards in this deck.
Unlock Deck
k this deck
60
Statistical Literacy For chi-square tests of independence and of homogeneity, do we use a right-tailed, left-tailed, or two-tailed test
Unlock Deck
Unlock for access to all 79 flashcards in this deck.
Unlock Deck
k this deck
61
For Problems 9-19, please provide the following information:
(a) What is the level of significance State the null and alternate hypotheses.
(b) Check Requirements Find the value of the chi-square statistic for the sample. Are all the expected frequencies greater than 5 What sampling distribution will you use What are the degrees of freedom
(c) Find or estimate the P -value of the sample test statistic.
(d) Based on your answers in parts (a)-(c), will you reject or fail to reject the null hypothesis of independence
(e) Interpret your conclusion in the context of the application.
Use the expected values E to the hundredths place.
Sociology: Methods of Communication Random samples of people aged 15-24 and of people aged 25-34 were asked about their preferred method of (remote) communication with friends. The respondents were asked to select one of the methods from the following list: cell phone, instant message, e-mail, or other.
(i) Make a cluster bar graph showing the percentages in each age group who selected each method.
(ii) Test whether the two populations share the same proportions of preferences for each type of communication method. Use = 0.05.
Unlock Deck
Unlock for access to all 79 flashcards in this deck.
Unlock Deck
k this deck
62
Critical Thinking The x distribution must be normal in order to use a chi-square distribution to test the variance. What are some methods you can use to assess whether the x distribution is normal Hint : See Chapter 7 and goodness-of-fit tests.
Unlock Deck
Unlock for access to all 79 flashcards in this deck.
Unlock Deck
k this deck
63
Critical Thinking Suppose you took random samples from three distinct age groups. Through a survey, you determined how many respondents from each age group preferred to get news from TV, newspaper, the Internet, or another source (respondents could select only one mode). What type of test would be appropriate to determine if there is sufficient statistical evidence to claim that the proportions of each age group preferring the different modes of obtaining news are not the same Select from tests of independence, homogeneity, and goodness-of-fit.
Before you solve Problems 4-8, first classify the problem as one of the following:
Chi-square test of independence or homogeneity
Chi-square goodness-of-fit
Chi-square for testing 2 or
Then, in each of the problems when a test is to be performed, do the following:
(i) Give the value of the level of significance. State the null and alternate hypotheses.
(ii) Find the sample test statistic.
(iii) Find or estimate the P -value of the sample test statistic.
(iv) Conclude the test.
(v) interpret the conclusion in the context of the application.
Unlock Deck
Unlock for access to all 79 flashcards in this deck.
Unlock Deck
k this deck
64
In Problems 7-12, parts (a) and (b) relate to testing . Part (c) requests the value of S c. Part (e) relates to confidence intervals for prediction. Part (f) relates to testing . Answers may very due to rounding.
Baseball: Batting Average and Strikeouts Let x be a random variable that represents the batting average of a professional baseball player. Let y be a random variable that represents the percentage of strikeouts of a professional baseball player. A random sample of n = 6 professional baseball players gave the following information (Reference: The Baseball Encyclopedia , Macmillan):
(a) Verify that x = 1.842, y = 37.6, x 2 = 0.575838, y 2 = 290.78, xy = 10.87, and r 0.891.
(b) Use a 5% level of significance to test the claim that 0.
(c) Verify that S e 1.6838, a 26.247, and b 65.081.
(d) Find the predicted percentage of strikeouts for a player with an x = 0.300 batting average.
(e) Find a 80% confidence interval for y when x = 0.300.
(f) Use a 5% level of significance to test the claim that 0.
Unlock Deck
Unlock for access to all 79 flashcards in this deck.
Unlock Deck
k this deck
65
Critical Thinking In general, how do the hypotheses for chi-square tests of independence differ from those for chi-square tests of homogeneity Explain.
Unlock Deck
Unlock for access to all 79 flashcards in this deck.
Unlock Deck
k this deck
66
Statistical Literacy For a chi-square goodness-of-fit test, how are the degrees of freedom computed
Unlock Deck
Unlock for access to all 79 flashcards in this deck.
Unlock Deck
k this deck
67
For Problems 3-11, please provide the following information:
(a) What is the level of significance State the null and alternate hypotheses.
(b) Find the value of the chi-square statistic for the sample. What are the degrees of freedom Check Requirements What assumptions are you making about the original distribution
(c) Find or estimate the P -value of the sample test statistic.
(d) Based on your answers in parts (a)-(c), will you reject or fail to reject the null hypothesis of independence
(e) Interpret your conclusion in the context of the application.
In each of the following problems, assume a normal population distribution.
Archaeology: Chaco Canyon The following problem is based on information from Archaeological Surveys of Chaco Canyon , New Mexico , by A. Hayes, D. Brugge, and W. Judge, University of New Mexico Press. A transect is an archaeological study area that is 1/5 mile wide and 1 mile long. A site in a transect is the location of a significant archaeological find. Let x represent the number of sites per transect. In a section of Chaco Canyon, a large number of transects showed that x has a population variance 2 = 42.3. In a different section of Chaco Canyon, a random sample of 23 transects gave a sample variance s 2 = 46.1 for the number of sites per transect. Use a 5% level of significance to test the claim that the variance in the new section is greater than 42.3.
Unlock Deck
Unlock for access to all 79 flashcards in this deck.
Unlock Deck
k this deck
68
For all Hypothesis tests, please provide the following information:
(i) What is the level of significance State the null and alternate hypotheses.
(ii) Check Requirements What sampling distribution will you use What assumptions are you making What is the value of the sample test statistic
(iii) Find (or estimate) the P -value. Sketch the sampling distribution and show the area corresponding to the P -value.
(iv) Based on your answers in parts (i)-(iii), will you reject or fail to reject the null hypothesis Are the data statistically significant at level
(v) Interpret your conclusion in the context of the application.
Test of Independence: Agriculture Three types of fertilizer were used on 132 identical plots of maize. Each plot was harvested and the yield (in kg) was recorded (Reference: Caribbean Agricultural Research and Development Institute).
Use a 5% level of significance to test the hypothesis that type of fertilizer and yield of maize are independent. Interpret the results.
Unlock Deck
Unlock for access to all 79 flashcards in this deck.
Unlock Deck
k this deck
69
Statistical Literacy What does it mean to say that the sample correlation coefficient r is significant
Unlock Deck
Unlock for access to all 79 flashcards in this deck.
Unlock Deck
k this deck
70
Critical Thinking Zane is interested in the proportion of people who recycle each of three distinct products: paper, plastic, and electronics. He wants to test the hypothesis that the proportion of people recycling each type of product differs by age group: 12-18 years old, 19-30 years old, 31-40 years old, and over 40 years old. Describe the sampling method appropriate for a test of homogeneity regarding recycled products and age.
Unlock Deck
Unlock for access to all 79 flashcards in this deck.
Unlock Deck
k this deck
71
Statistical Literacy How are expected frequencies computed for goodness-of-fit tests
Unlock Deck
Unlock for access to all 79 flashcards in this deck.
Unlock Deck
k this deck
72
For Problems 3-11, please provide the following information:
(a) What is the level of significance State the null and alternate hypotheses.
(b) Find the value of the chi-square statistic for the sample. What are the degrees of freedom Check Requirements What assumptions are you making about the original distribution
(c) Find or estimate the P -value of the sample test statistic.
(d) Based on your answers in parts (a)-(c), will you reject or fail to reject the null hypothesis of independence
(e) Interpret your conclusion in the context of the application.
In each of the following problems, assume a normal population distribution.
Sociology: Marriage The following problem is based on information from an article by N. Keyfitz in The American Journal of Sociology (Vol. 53, pp. 470-480). Let x = age in years of a rural Quebec woman at the time of her first marriage. In the year 1941, the population variance of x was approximately 2 = 5.1. Suppose a recent study of age at first marriage for a random sample of 41 women in rural Quebec gave a sample variance s 2 = 3.3. Use a 5% level of significance to test the claim that the current variance is less than 5.1.
Unlock Deck
Unlock for access to all 79 flashcards in this deck.
Unlock Deck
k this deck
73
Statistical Literacy For a fixed confidence level, how does the length of the confidence interval for predicted values of y change as the corresponding x values become farther away from
Unlock Deck
Unlock for access to all 79 flashcards in this deck.
Unlock Deck
k this deck
74
In Problems 7-12, parts (a) and (b) relate to testing . Part (c) requests the value of S c. Part (e) relates to confidence intervals for prediction. Part (f) relates to testing . Answers may very due to rounding.
Scuba Diving: Depth What is the optimal time for a scuba diver to be on the bottom of the ocean That depends on the depth of the dive. The U.S. navy has done a lot of research on this topic. The Navy defines the "optimal time" to be the time at each depth for the best balance between length of work period and decompression time after surfacing. Let x = depth of dive in meters, and let y = optimal time in hours. A random sample of divers gave the following data (based on information taken from Textbook of Medical Physiology by A. C. Guyton, M.D):
(a) Verify that x = 201.4, y = 12.6, x 2 = 6735.46, y 2 = 25.607, xy = 311.292, and r 0.976.
(b) Use a 1% level of significance to test the claim that 0.
(c) Verify that S e 0.1660, a 3.366, and b 0.0544.
(d) Find the predicted optimal time in hours for a dive depth of x = 18 meters.
(e) Find an 80% confidence interval for y when x = 18 meters.
(f) Use a 1% level of significance to test the claim that 0.
Unlock Deck
Unlock for access to all 79 flashcards in this deck.
Unlock Deck
k this deck
75
Critical Thinking Charlotte is doing a study on fraud and identity theft based both on source (checks, credit cards, debit cards, online banking/finance sites, other) and on gender of the victim. Describe the sampling method appropriate for a test of independence regarding source of fraud and gender.
Unlock Deck
Unlock for access to all 79 flashcards in this deck.
Unlock Deck
k this deck
76
Statistical Literacy Explain why goodness-of-fit tests are always right-tailed tests.
Unlock Deck
Unlock for access to all 79 flashcards in this deck.
Unlock Deck
k this deck
77
For Problems 3-11, please provide the following information:
(a) What is the level of significance State the null and alternate hypotheses.
(b) Find the value of the chi-square statistic for the sample. What are the degrees of freedom Check Requirements What assumptions are you making about the original distribution
(c) Find or estimate the P -value of the sample test statistic.
(d) Based on your answers in parts (a)-(c), will you reject or fail to reject the null hypothesis of independence
(e) Interpret your conclusion in the context of the application.
In each of the following problems, assume a normal population distribution.
Mountain Climbing: Accidents The following problem is based on information taken from Accidents in North American Mountaineering (jointly published by the American Alpine Club and The Alpine Club of Canada). Let x represent the number of mountain climbers killed each year. The long-term variance of x is approximately 2 = 136.2. Suppose that for the past 8 years, the variance has been s 2 = 115.1. Use a 1% level of significance to test the claim that the recent variance for number of mountain-climber deaths is less than 136.2.
Unlock Deck
Unlock for access to all 79 flashcards in this deck.
Unlock Deck
k this deck
78
Education: Exams Professor Fair believes that extra time does not improve grades on exams. He randomly divided a group of 300 students into two groups and gave them all the same test. One group had exactly 1 hour in which to finish the test, and the other group could stay as long as desired. The results follow. Test at the 0.01 level of significance that time to do a test and test results are independent.
Unlock Deck
Unlock for access to all 79 flashcards in this deck.
Unlock Deck
k this deck
79
Physiology: Children The following problem is based on information taken from the paediatrics section of The Merck Manual (a commonly used reference in medical schools and nursing programs). Let x be the body weight of a child (in kilograms), and let y be the metabolic rate of the child (in 100 kcal/24 h).
x = 100; y = 47.1; x 2 = 1552; y 2 = 327.83; xy = 710.3.
(a) Verify that S e 0.518.
(b) Verify that r 0.984. Test that is positive. Use = 0.01.
(c) Verify that b 0.402. Test that is positive. Use = 0.01.
(d) Verify that
. Find a 90% confidence interval for the predicted metabolic rate for a child weighing 10 kg.
x = 100; y = 47.1; x 2 = 1552; y 2 = 327.83; xy = 710.3.
(a) Verify that S e 0.518.
(b) Verify that r 0.984. Test that is positive. Use = 0.01.
(c) Verify that b 0.402. Test that is positive. Use = 0.01.
(d) Verify that
. Find a 90% confidence interval for the predicted metabolic rate for a child weighing 10 kg. Unlock Deck
Unlock for access to all 79 flashcards in this deck.
Unlock Deck
k this deck
Unlock Deck
Unlock for access to all 79 flashcards in this deck.


