Deck 4: Linear Functions and Inequalities in Two Variables
Full screen (f)
Question
Graph the ordered pairs below. 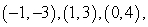 and
and 
A)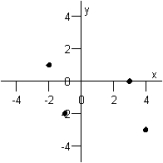
B)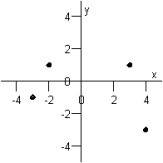
C)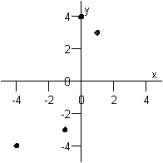
D)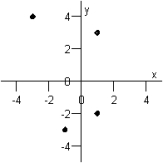
E)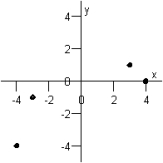
and A)
B)
C)
D)
E)
Question
Find the coordinates of the point below. 
A)
B)
C)
D)
E)
A)
B)
C)
D)
E)
Question
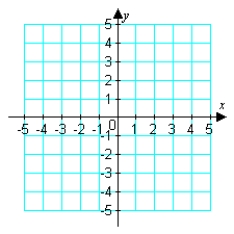
Graph: 
A)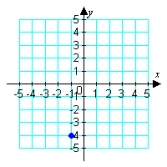
B)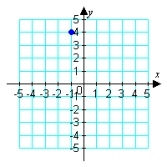
C)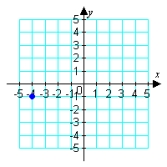
D)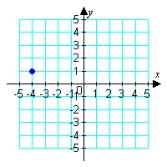
E)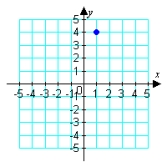
A)
B)
C)
D)
E)
Question
Graph the ordered pairs below. 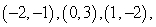 and
and 
A)
B)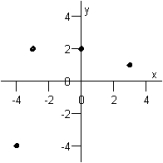
C)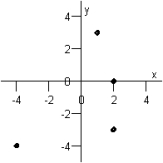
D)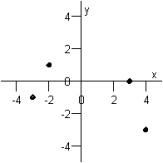
E)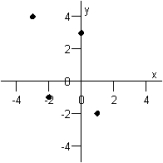
and A)
B)
C)
D)
E)
Question
Find the coordinates of the point below. 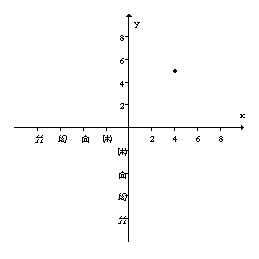
A)
B)
C)
D)
E)
A)
B)
C)
D)
E)
Question
The number of years of previous work experience and the monthly salary of a person who completes a bachelor's degree in economics are recorded in the following table. Graph the scatter diagram of these data. 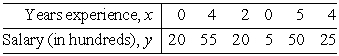
A)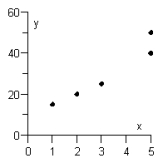
B)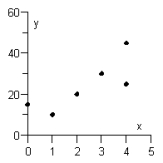
C)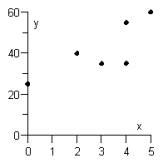
D)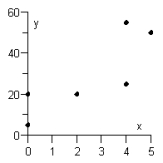
E)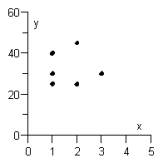
A)
B)
C)
D)
E)
Question
Name the abscissa of the point shown below. 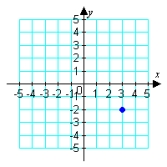
A) 3
B) -3
C) -2
D) 2
E)
A) 3
B) -3
C) -2
D) 2
E)
Question
Sherlock Holmes solved a crime by recognizing a relationship between the length, in inches, of a person's stride and the height of that person in inches. The data for six people are recorded in the table below. Graph the scatter diagram of these data. 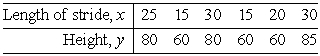
A)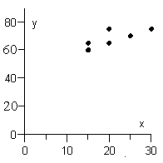
B)
C)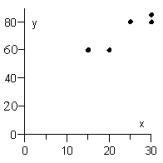
D)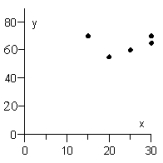
E)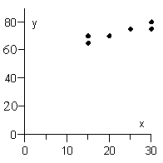
A)
B)
C)
D)
E)
Question
Is (-3, 2) a solution of  ?
?
A) No
B) Yes
?A) No
B) Yes
Question
Find the domain and range of the following function. 
A) D: {-3, -2, 3, 6, 7}; R: {3, 6, 7}
B) D: R:
R: 
C) D: {3, 6, 7}; R: {3, 6, 7}
D) D: {3, 6, 7}; R: {-3, -2, 3, 6, 7}
E) D: {-3, -2, 3, 6, 7}; R: {-3, -2, 3, 6, 7}
A) D: {-3, -2, 3, 6, 7}; R: {3, 6, 7}
B) D:
R: C) D: {3, 6, 7}; R: {3, 6, 7}
D) D: {3, 6, 7}; R: {-3, -2, 3, 6, 7}
E) D: {-3, -2, 3, 6, 7}; R: {-3, -2, 3, 6, 7}
Question
Graph the ordered pairs below.  and
and 
A)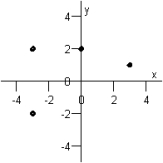
B)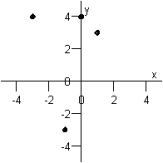
C)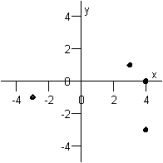
D)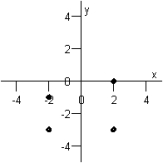
E)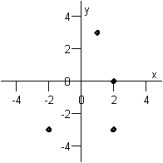
and A)
B)
C)
D)
E)
Question
Name the abscissa of the point below. 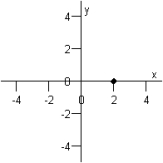
A) 1
B) -1
C) 2
D) -2
E) 0
A) 1
B) -1
C) 2
D) -2
E) 0
Question
Name the ordinate of the point below. 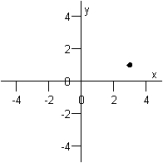
A) -2
B) 2
C) -1
D) 3
E) 1
A) -2
B) 2
C) -1
D) 3
E) 1
Question
Is (-2, -10) a solution of  ?
?
A) Yes
B) No
?A) Yes
B) No
Question
In which quadrant does the given point lie? 
A) Quadrant II
B) Quadrant III
C) Quadrant IV
D) Quadrant I
E) None of these
A) Quadrant II
B) Quadrant III
C) Quadrant IV
D) Quadrant I
E) None of these
Question
Find the coordinates of the point below. 
A)
B)
C)
D)
E)
A)
B)
C)
D)
E)
Question
The scatter diagram below shows the record times for races of different lengths at a junior high school track meet, where x is the length of the race in meters and y is the time of race in seconds. Suppose the school adds a 500-meter race. How will that change the scatter plot? Will the graph have the same number of points or an additional point? 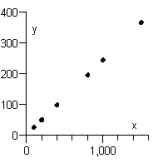
A) The point will be graphed with an x-coordinate of 500 and a y-coordinate equal to the record time for the 500-meter race. The graph will not have an additional point.
B) The point will be graphed with an x-coordinate of 500 and a y-coordinate equal to the record time for the 500-meter race. The graph will have an additional point.
C) The point will be graphed with an x-coordinate equal to the record time for the 500-meter race and a y-coordinate of 500. The graph will have an additional point.
D) The point will be graphed with an x-coordinate equal to the record time for the 500-meter race and a y-coordinate of 500. The graph will not have an additional point.
E) The point will be graphed with an x-coordinate of 500 and a y-coordinate of 500. The graph will not have an additional point.
Question
Find the coordinates of the point below. 
A)
B)
C)
D)
E)
A)
B)
C)
D)
E)
Question
In which quadrant does the given point lie? 
A) Quadrant II
B) Quadrant I
C) None of these
D) Quadrant IV
E) Quadrant III
A) Quadrant II
B) Quadrant I
C) None of these
D) Quadrant IV
E) Quadrant III
Question
The scatter diagram below pairs numbers of children with the number of households in a certain neighborhood who have that number of children. If the next household that moves in has 2 children, how will that change the scatter diagram? Will the graph have the same number of points or one additional point? 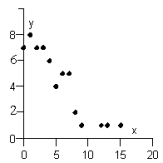
A) The point at x = 2 will move to
B) The point at x = 8 will move to
C) The graph will have a new point at
D) The graph will have a new point at
E) The point at x = 2 will move to
A) The point at x = 2 will move to
B) The point at x = 8 will move to
C) The graph will have a new point at
D) The graph will have a new point at
E) The point at x = 2 will move to
Question
A real estate appraiser charges a fee that depends on the estimated value, V, of the property. A table giving the fees charged for various estimated values of the real estate appears below. Value of Property
Appraisal Fee $350
$350  $525
$525  $950
$950 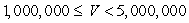 $2500
$2500  $3000
$3000
A. Evaluate this function when V = $437,000.
B. Evaluate this function when V = $9,000,000.
A) (a) $525; (b) $3000
B) (a) $3000; (b) $525
C) (a) $500,000; (b) $10,000,000
D) (a) $950; (b) $3500
E) (a) $525; (b) $525
Appraisal Fee
$350 $525 $950 $2500 $3000A. Evaluate this function when V = $437,000.
B. Evaluate this function when V = $9,000,000.
A) (a) $525; (b) $3000
B) (a) $3000; (b) $525
C) (a) $500,000; (b) $10,000,000
D) (a) $950; (b) $3500
E) (a) $525; (b) $525
Question
What values are excluded from the domain of the function  ?
?
A) 3, -3
B) 0, -3
C) -3
D) 0
E) 3
?A) 3, -3
B) 0, -3
C) -3
D) 0
E) 3
Question
Does the diagram below represent a function? 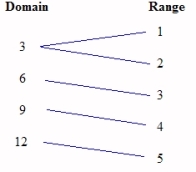
A) Insufficient information
B) Yes
C) No
A) Insufficient information
B) Yes
C) No
Question
What values are excluded from the domain of the function  ?
?
A) 5
B) 0
C)
D)
E) None
?A) 5
B) 0
C)
D)
E) None
Question
Graph: 
A)
B)
C)
A)
B)
C)
Question
Given the function 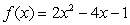 , find
A) 7
B) 29
C) 5
D) 30
E) 8
, find A) 7
B) 29
C) 5
D) 30
E) 8
Question
State whether the following relation is a function. 
A) Not a function
B) Insufficient information
C) Function
A) Not a function
B) Insufficient information
C) Function
Question
State whether the following relation is a function. 
A) Insufficient information
B) Function
C) Not a function
A) Insufficient information
B) Function
C) Not a function
Question
What values are excluded from the domain of the function  ?
?
A) 0, 4
B)
C) 9
D) 4
E) 4 , 9
?A) 0, 4
B)
C) 9
D) 4
E) 4 , 9
Question
Graph: 
A)
B)
C)
A)
B)
C)
Question
What values are excluded from the domain of the function  ?
?
A) 0, 2
B) 2
C) 1, 2
D) 0
E) 1
?A) 0, 2
B) 2
C) 1, 2
D) 0
E) 1
Question
Graph: 
A)
B)
C)
A)
B)
C)
Question
What values are excluded from the domain of the function  ?
?
A) 4
B) 4, -3
C) 4, -4
D) 0
E) -3
?A) 4
B) 4, -3
C) 4, -4
D) 0
E) -3
Question
Given 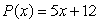 , write
 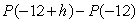 in simplest form.
A)
B)
C)
D)
E)
, write in simplest form.A)
B)
C)
D)
E)
Question
What values are excluded from the domain of the function 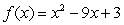 ?
?
A) 9
B) None
C) 3
D) 4.5
E) 0
?A) 9
B) None
C) 3
D) 4.5
E) 0
Question
Given the function 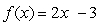 , find
A) 6
B) 9
C) 0
D) 3
E) -1
, find A) 6
B) 9
C) 0
D) 3
E) -1
Question
Find the range of the function defined by the equation and the given domain. 
A) {2}
B) all numbers
C) {-8, -4, 0, 8}
D) {(-8,146), (-4,42), (0,2), (8,114)}
E) {146, 42, 2, 114}
A) {2}
B) all numbers
C) {-8, -4, 0, 8}
D) {(-8,146), (-4,42), (0,2), (8,114)}
E) {146, 42, 2, 114}
Question
Graph: 
A)
B)
C)
A)
B)
C)
Question
What values are excluded from the domain of the function  ?
?
A)
B) 0
C) None
D)
E) 7
?A)
B) 0
C) None
D)
E) 7
Question
Does the diagram below represent a function? 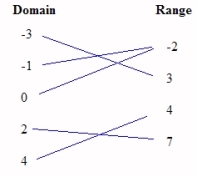
A) Insufficient information
B) Yes
C) No
A) Insufficient information
B) Yes
C) No
Question
The graph below shows how the amount of fuel in the tank of a car decreases as the car is driven. Find the slope of the line between the two points shown on the graph, namely (50, 15) and (150, 9). Write a sentence that states the meaning of the slope. 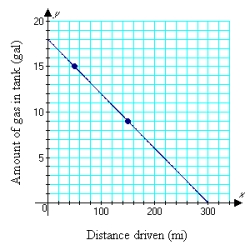
A) m = -0.06; For each 100 miles the car is driven, approximately 0.06 gal of fuel is used.
B) m = -0.06; For each mile the car is driven, approximately 0.06 gal of fuel is used.
C) m = -0.06; The car averages approximately 60 miles per gallon.
D) m = 0.06; For each mile the car is driven, approximately 0.06 gal of fuel is used.
E) m = -0.6; For each mile the car is driven, approximately 0.6 gal of fuel is used.
Question
Graph by using the slope and y-intercept: 
A)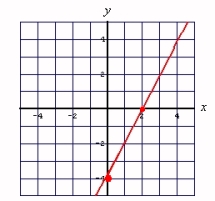
B)
C)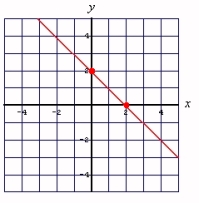
A)
B)
C)
Question
Find the slope of the line containing the given points. 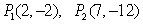
A)
B) 2
C) Undefined
D) -2
E) -10
A)
B) 2
C) Undefined
D) -2
E) -10
Question
Graph by using the slope and y-intercept: 
A)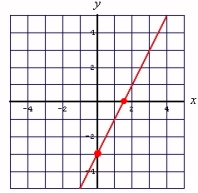
B)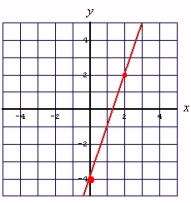
C)
A)
B)
C)
Question
The graph below shows the relationship between the distance traveled by a motorist and the time of travel. Find the slope of the line between the two points shown on the graph, namely (1, 80) and (3, 240). Write a sentence that states the meaning of the slope. 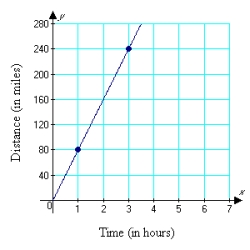
A) m = 80; The distance traveled by the motorist in 2 hours is 80 miles.
B) m = 240; The average speed of the motorist is 240 mph.
C) m = 80; The average speed of the motorist is 80 mph.
D) m = 160; The average speed of the motorist is 160 mph.
E) m = 60; The average speed of the motorist is 60 mph.
Question
The graph below shows the relationship between the temperature (degrees Fahrenheit) inside an oven and the time since the oven was turned off. Find the slope of the line between the two points shown on the graph, namely (20, 275) and (50, 125). Write a sentence that states the meaning of the slope. 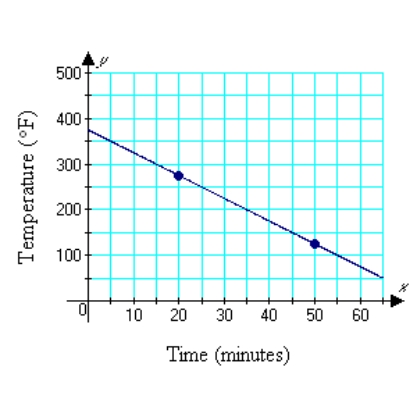
A) m = -5; The temperature of the oven decreases 5 °/min.
B) m = -6; The temperature of the oven decreases 6 °/min.
C) m = 5; The temperature of the oven increases 5 °/min.
D) m = -150; The temperature of the oven decreases 150 °/min.
E) m = 5; The temperature of the oven decreases 5 °/min.
A) m = -5; The temperature of the oven decreases 5 °/min.
B) m = -6; The temperature of the oven decreases 6 °/min.
C) m = 5; The temperature of the oven increases 5 °/min.
D) m = -150; The temperature of the oven decreases 150 °/min.
E) m = 5; The temperature of the oven decreases 5 °/min.
Question
Find the slope of the line containing the given points. 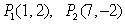
A)
B) -4
C)
D)
E)
A)
B) -4
C)
D)
E)
Question
Find the equation of the line that contains the given point and has the given slope. (5, 1) , m =  .
.
A)
B)
C)
D)
E)
.A)
B)
C)
D)
E)
Question
Find the equation of the line that contains the given point and has the given slope. (-2, -12) , m = 5.
A)
B)
C)
D)
E)
A)
B)
C)
D)
E)
Question
Graph by using the slope and y-intercept: 
A)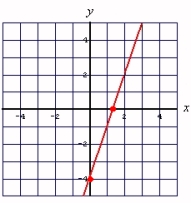
B)
C)
A)
B)
C)
Question
The graph below shows the number of gallons of water remaining in a pool x minutes after a pump is turned on to drain the pool. Find the slope of the line between the two points shown on the graph, namely (0, 32) and (25, 5). Write a sentence that states the meaning of the slope. 
A) m = -1.08; Each minute, 1080 gallons are being drained from the pool.
B) m = -1.08; Each minute, 1.08 gallons are being drained from the pool.
C) m = -0.93; Every 25 minutes, 930 gallons are being drained from the pool.
D) m = -1.08; Every 25 minutes, 1080 gallons are being drained from the pool.
E) m = -0.93; Each minute, 930 gallons are being drained from the pool.
Question
Graph: 
A)
B)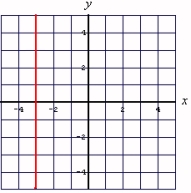
C)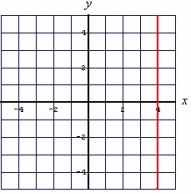
A)
B)
C)
Question
Graph: 
A)
B)
C)
A)
B)
C)
Question
A custom-illustrated sign or banner can be commissioned for a cost of $21.00 for the material and $11.90 per square foot for artwork. The equation that represents this cost is given by y = 11.90x + 21.00, where y is the cost and x is the number of square feet in the sign. When this equation is graphed for  , the ordered pair (13, 175.70) is discovered to lie on the graph. Write a sentence that describes the meaning of the ordered pair (13, 175.70).
A) It costs $175.70 for each additional square foot of sign area.
B) It costs $13 for a custom sign 175.70 ft2 in area.
C) It costs $13 for material and $175.70 for artwork.
D) It costs $175.70 for a custom sign 13 ft2 in area.
E) It costs $13 for each additional square foot of sign area.
, the ordered pair (13, 175.70) is discovered to lie on the graph. Write a sentence that describes the meaning of the ordered pair (13, 175.70).A) It costs $175.70 for each additional square foot of sign area.
B) It costs $13 for a custom sign 175.70 ft2 in area.
C) It costs $13 for material and $175.70 for artwork.
D) It costs $175.70 for a custom sign 13 ft2 in area.
E) It costs $13 for each additional square foot of sign area.
Question
Find the x- and y-intercepts of the line 
A) x-intercept: (9, 0), y-intercept: (0, -6)
B) x-intercept: (-9, 0), y-intercept: (0, 6)
C) x-intercept: (6, 0), y-intercept: (0, 9)
D) x-intercept: (9, 0), y-intercept: (0, 6)
E) x-intercept: (-9, 0), y-intercept: (0, -6)
A) x-intercept: (9, 0), y-intercept: (0, -6)
B) x-intercept: (-9, 0), y-intercept: (0, 6)
C) x-intercept: (6, 0), y-intercept: (0, 9)
D) x-intercept: (9, 0), y-intercept: (0, 6)
E) x-intercept: (-9, 0), y-intercept: (0, -6)
Question
Graph: 
A)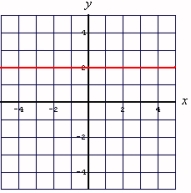
B)
C)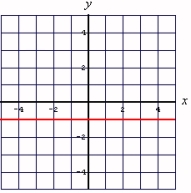
A)
B)
C)
Question
Graph by using the slope and y-intercept: 
A)
B)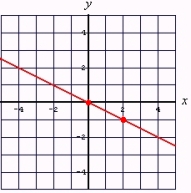
C)
A)
B)
C)
Question
Graph by using the slope and y-intercept: 
A)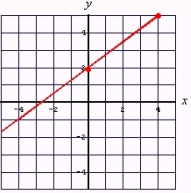
B)
C)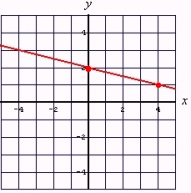
A)
B)
C)
Question
Find the equation of the line that contains the given point and has the given slope. (-4, 21) , m = -4.
A)
B)
C)
D)
E)
A)
B)
C)
D)
E)
Question
Graph by using the slope and y-intercept: 
A)
B)
C)
A)
B)
C)
Question
The slope of a line is  . What is the slope of any line perpendicular to this line?
A)
B)
C)
D)
E)
. What is the slope of any line perpendicular to this line?A)
B)
C)
D)
E)
Question
Let f be a linear function. If  and
and  , find
  .
.
A)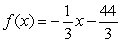
B)
C)
D)
E)
and , find .A)
B)
C)
D)
E)
Question
A Boeing 747 jet takes off from Boston's Logan Airport, which is at sea level, and climbs to a cruising altitude of 27,000 ft at a constant rate of 1100 ft/min.
A. Write a linear equation for the height of the plane in terms of the time after takeoff.
B. Use your equation to find the height of the plane 12 min after takeoff.
A) (a)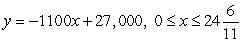 ; (b) 13,800 ft
B) (a) ; (b) 40,200 ft
C) (a) ; (b) 13,200 ft
D) (a) ; (b) 40,200 ft
E) (a) ; (b) 13,200 ft
A. Write a linear equation for the height of the plane in terms of the time after takeoff.
B. Use your equation to find the height of the plane 12 min after takeoff.
A) (a)
; (b) 13,800 ftB) (a)
; (b) 40,200 ftC) (a)
; (b) 13,200 ftD) (a)
; (b) 40,200 ftE) (a)
; (b) 13,200 ft Question
Find the equation of the line passing through the points whose coordinates are  .
.
A)
B)
C)
D)
E)
.A)
B)
C)
D)
E)
Question
Is the line  parallel to the line
  ?
?
A) Insufficient information
B) Yes
C) No
parallel to the line ?A) Insufficient information
B) Yes
C) No
Question
An account executive receives a base salary plus a commission. With $17,000 in monthly sales, the account executive receives $1700. On $45,000 in monthly sales, the account executive receives $2700.
A. Determine a linear function that will yield the compensation of the sales executive for a given amount of monthly sales. Round any numbers in your function to the nearest hundredth.
B. Use this model, with coefficients rounded to the nearest hundreth, to determine the account executive's compensation for $36,700 in monthly sales. Round to the nearest dollar.
A) (a) ; (b) $1468
B) (a) ; (b) $1093
C) (a) ; (b) $4763
D) (a) ; (b) $2561
E) (a) ; (b) $1468
A. Determine a linear function that will yield the compensation of the sales executive for a given amount of monthly sales. Round any numbers in your function to the nearest hundredth.
B. Use this model, with coefficients rounded to the nearest hundreth, to determine the account executive's compensation for $36,700 in monthly sales. Round to the nearest dollar.
A) (a)
; (b) $1468B) (a)
; (b) $1093C) (a)
; (b) $4763D) (a)
; (b) $2561E) (a)
; (b) $1468 Question
The gas tank of a certain car contains 17 gal of gas when the driver of the car begins a trip. Each mile driven by the driver decreases the amount of gas in the tank by 0.068 gal.
A. Write a linear function for the number of gallons of gas in the tank in terms of the number of miles driven.
B. Use your equation to find the number of gallons in the tank after driving 161 mi. Round your answer to the nearest tenth of a gallon.
A) (a) ; (b) 27.9 gal
B) (a) ; (b) 27.9 gal
C) (a) ; (b) 6.1 gal
D) (a)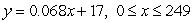 ; (b) 10.9 gal
E) (a)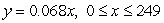 ; (b) 10.9 gal
A. Write a linear function for the number of gallons of gas in the tank in terms of the number of miles driven.
B. Use your equation to find the number of gallons in the tank after driving 161 mi. Round your answer to the nearest tenth of a gallon.
A) (a)
; (b) 27.9 galB) (a)
; (b) 27.9 galC) (a)
; (b) 6.1 galD) (a)
; (b) 10.9 galE) (a)
; (b) 10.9 gal Question
Find the equation of line that contains the point whose coordinates are (-7, -10) and whose slope is undefined.
A)
B)
C)
D)
E)
A)
B)
C)
D)
E)
Question
Find the equation of the line passing through the points whose coordinates are 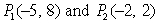 .
.
A)
B)
C)
D)
E)
.A)
B)
C)
D)
E)
Question
The slope of a line is  . What is the slope of any line parallel to this line?
A)
B)
C)
D)
E)
. What is the slope of any line parallel to this line?A)
B)
C)
D)
E)
Question
Find the equation of the line that contains the points P1(-2, -8) and P2(-2, 8).
A)
B)
C)
D)
E)
A)
B)
C)
D)
E)
Question
Is the line  perpendicular to the line
  ?
?
A) Insufficient information
B) Yes
C) No
perpendicular to the line ?A) Insufficient information
B) Yes
C) No
Question
Find the equation of the line that contains the given point and has the given slope. (-5, -6) , m = 
A)
B)
C)
D)
E)
A)
B)
C)
D)
E)
Question
Find the equation of the line that contains the points P1(-2, -4) and P2(3, -7).
A)
B)
C)
D)
E)
A)
B)
C)
D)
E)
Question
A cellular phone company offers several different service plans. One option, for people who plan on using the phone only in emergencies, costs the user $5.15 per month plus $0.60 per minute for each minute the phone is used.
A. Write a linear function for the monthly cost of the phone in terms of the number of minutes the phone is used.
B. Use your equation to find the cost of using the cellular phone for 14 minutes in 1 month.
A) (a) ; (b) $8.40
B) (a) ; (b) $19.15
C) (a) ; (b) $13.55
D) (a) ; (b) $5.15
E) (a) ; (b) $72.70
A. Write a linear function for the monthly cost of the phone in terms of the number of minutes the phone is used.
B. Use your equation to find the cost of using the cellular phone for 14 minutes in 1 month.
A) (a)
; (b) $8.40B) (a)
; (b) $19.15C) (a)
; (b) $13.55D) (a)
; (b) $5.15E) (a)
; (b) $72.70 Question
Find the equation of the line that contains the points P1(-3, -4) and P2(5, -4).
A)
B)
C)
D)
E)
A)
B)
C)
D)
E)
Question
A manufacturer of graphing calculators has determined that 12,000 calculators per week will be sold at a price of $110 each. At a price of $90, it is estimated that 15,000 calculators would be sold.
A. Determine a linear function that will predict the number of calculators that would be sold at a given price, x.
B. Use this model to predict the number of calculators that would be sold each week at a price of $75.
A) (a) ; (b) 13,500 calculators
B) (a) ; (b) 6750 calculators
C) (a) ; (b) 751 calculators
D) (a) ; (b) 17,250 calculators
E) (a) ; (b) 17,250 calculators
A. Determine a linear function that will predict the number of calculators that would be sold at a given price, x.
B. Use this model to predict the number of calculators that would be sold each week at a price of $75.
A) (a)
; (b) 13,500 calculatorsB) (a)
; (b) 6750 calculatorsC) (a)
; (b) 751 calculatorsD) (a)
; (b) 17,250 calculatorsE) (a)
; (b) 17,250 calculators Question
Find the equation of the line passing through the points whose coordinates are  .
.
A)
B)
C)
D)
E)
.A)
B)
C)
D)
E)
Question
Given that f is a linear function for which  and
and  , determine
  .
.
A) 1
B) 19
C) -3
D) 3
E) 5
and , determine .A) 1
B) 19
C) -3
D) 3
E) 5
Question
Find the equation of the line passing through the points whose coordinates are  .
.
A)
B)
C)
D)
E)
.A)
B)
C)
D)
E)

Unlock Deck
Sign up to unlock the cards in this deck!
Unlock Deck
Unlock Deck
1/92
Play
Full screen (f)
Deck 4: Linear Functions and Inequalities in Two Variables
1
Graph the ordered pairs below. and
A)
B)
C)
D)
E)
and A)
B)
C)
D)
E)
2
Find the coordinates of the point below.
A)
B)
C)
D)
E)
A)
B)
C)
D)
E)
3
Graph:
A)
B)
C)
D)
E)
A)
B)
C)
D)
E)
4
Graph the ordered pairs below. and
A)
B)
C)
D)
E)
and A)
B)
C)
D)
E)
Unlock Deck
Unlock for access to all 92 flashcards in this deck.
Unlock Deck
k this deck
5
Find the coordinates of the point below.
A)
B)
C)
D)
E)
A)
B)
C)
D)
E)
Unlock Deck
Unlock for access to all 92 flashcards in this deck.
Unlock Deck
k this deck
6
The number of years of previous work experience and the monthly salary of a person who completes a bachelor's degree in economics are recorded in the following table. Graph the scatter diagram of these data.
A)
B)
C)
D)
E)
A)
B)
C)
D)
E)
Unlock Deck
Unlock for access to all 92 flashcards in this deck.
Unlock Deck
k this deck
7
Name the abscissa of the point shown below.
A) 3
B) -3
C) -2
D) 2
E)
A) 3
B) -3
C) -2
D) 2
E)
Unlock Deck
Unlock for access to all 92 flashcards in this deck.
Unlock Deck
k this deck
8
Sherlock Holmes solved a crime by recognizing a relationship between the length, in inches, of a person's stride and the height of that person in inches. The data for six people are recorded in the table below. Graph the scatter diagram of these data.
A)
B)
C)
D)
E)
A)
B)
C)
D)
E)
Unlock Deck
Unlock for access to all 92 flashcards in this deck.
Unlock Deck
k this deck
9
Is (-3, 2) a solution of ?
A) No
B) Yes
?A) No
B) Yes
Unlock Deck
Unlock for access to all 92 flashcards in this deck.
Unlock Deck
k this deck
10
Find the domain and range of the following function.
A) D: {-3, -2, 3, 6, 7}; R: {3, 6, 7}
B) D: R:
C) D: {3, 6, 7}; R: {3, 6, 7}
D) D: {3, 6, 7}; R: {-3, -2, 3, 6, 7}
E) D: {-3, -2, 3, 6, 7}; R: {-3, -2, 3, 6, 7}
A) D: {-3, -2, 3, 6, 7}; R: {3, 6, 7}
B) D:
R: C) D: {3, 6, 7}; R: {3, 6, 7}
D) D: {3, 6, 7}; R: {-3, -2, 3, 6, 7}
E) D: {-3, -2, 3, 6, 7}; R: {-3, -2, 3, 6, 7}
Unlock Deck
Unlock for access to all 92 flashcards in this deck.
Unlock Deck
k this deck
11
Graph the ordered pairs below. and
A)
B)
C)
D)
E)
and A)
B)
C)
D)
E)
Unlock Deck
Unlock for access to all 92 flashcards in this deck.
Unlock Deck
k this deck
12
Name the abscissa of the point below.
A) 1
B) -1
C) 2
D) -2
E) 0
A) 1
B) -1
C) 2
D) -2
E) 0
Unlock Deck
Unlock for access to all 92 flashcards in this deck.
Unlock Deck
k this deck
13
Name the ordinate of the point below.
A) -2
B) 2
C) -1
D) 3
E) 1
A) -2
B) 2
C) -1
D) 3
E) 1
Unlock Deck
Unlock for access to all 92 flashcards in this deck.
Unlock Deck
k this deck
14
Is (-2, -10) a solution of ?
A) Yes
B) No
?A) Yes
B) No
Unlock Deck
Unlock for access to all 92 flashcards in this deck.
Unlock Deck
k this deck
15
In which quadrant does the given point lie?
A) Quadrant II
B) Quadrant III
C) Quadrant IV
D) Quadrant I
E) None of these
A) Quadrant II
B) Quadrant III
C) Quadrant IV
D) Quadrant I
E) None of these
Unlock Deck
Unlock for access to all 92 flashcards in this deck.
Unlock Deck
k this deck
16
Find the coordinates of the point below.
A)
B)
C)
D)
E)
A)
B)
C)
D)
E)
Unlock Deck
Unlock for access to all 92 flashcards in this deck.
Unlock Deck
k this deck
17
The scatter diagram below shows the record times for races of different lengths at a junior high school track meet, where x is the length of the race in meters and y is the time of race in seconds. Suppose the school adds a 500-meter race. How will that change the scatter plot? Will the graph have the same number of points or an additional point?
A) The point will be graphed with an x-coordinate of 500 and a y-coordinate equal to the record time for the 500-meter race. The graph will not have an additional point.
B) The point will be graphed with an x-coordinate of 500 and a y-coordinate equal to the record time for the 500-meter race. The graph will have an additional point.
C) The point will be graphed with an x-coordinate equal to the record time for the 500-meter race and a y-coordinate of 500. The graph will have an additional point.
D) The point will be graphed with an x-coordinate equal to the record time for the 500-meter race and a y-coordinate of 500. The graph will not have an additional point.
E) The point will be graphed with an x-coordinate of 500 and a y-coordinate of 500. The graph will not have an additional point.
Unlock Deck
Unlock for access to all 92 flashcards in this deck.
Unlock Deck
k this deck
18
Find the coordinates of the point below.
A)
B)
C)
D)
E)
A)
B)
C)
D)
E)
Unlock Deck
Unlock for access to all 92 flashcards in this deck.
Unlock Deck
k this deck
19
In which quadrant does the given point lie?
A) Quadrant II
B) Quadrant I
C) None of these
D) Quadrant IV
E) Quadrant III
A) Quadrant II
B) Quadrant I
C) None of these
D) Quadrant IV
E) Quadrant III
Unlock Deck
Unlock for access to all 92 flashcards in this deck.
Unlock Deck
k this deck
20
The scatter diagram below pairs numbers of children with the number of households in a certain neighborhood who have that number of children. If the next household that moves in has 2 children, how will that change the scatter diagram? Will the graph have the same number of points or one additional point?
A) The point at x = 2 will move to
B) The point at x = 8 will move to
C) The graph will have a new point at
D) The graph will have a new point at
E) The point at x = 2 will move to
A) The point at x = 2 will move to
B) The point at x = 8 will move to
C) The graph will have a new point at
D) The graph will have a new point at
E) The point at x = 2 will move to
Unlock Deck
Unlock for access to all 92 flashcards in this deck.
Unlock Deck
k this deck
21
A real estate appraiser charges a fee that depends on the estimated value, V, of the property. A table giving the fees charged for various estimated values of the real estate appears below. Value of Property
Appraisal Fee $350 $525 $950 $2500 $3000
A. Evaluate this function when V = $437,000.
B. Evaluate this function when V = $9,000,000.
A) (a) $525; (b) $3000
B) (a) $3000; (b) $525
C) (a) $500,000; (b) $10,000,000
D) (a) $950; (b) $3500
E) (a) $525; (b) $525
Appraisal Fee
$350 $525 $950 $2500 $3000A. Evaluate this function when V = $437,000.
B. Evaluate this function when V = $9,000,000.
A) (a) $525; (b) $3000
B) (a) $3000; (b) $525
C) (a) $500,000; (b) $10,000,000
D) (a) $950; (b) $3500
E) (a) $525; (b) $525
Unlock Deck
Unlock for access to all 92 flashcards in this deck.
Unlock Deck
k this deck
22
What values are excluded from the domain of the function ?
A) 3, -3
B) 0, -3
C) -3
D) 0
E) 3
?A) 3, -3
B) 0, -3
C) -3
D) 0
E) 3
Unlock Deck
Unlock for access to all 92 flashcards in this deck.
Unlock Deck
k this deck
23
Does the diagram below represent a function?
A) Insufficient information
B) Yes
C) No
A) Insufficient information
B) Yes
C) No
Unlock Deck
Unlock for access to all 92 flashcards in this deck.
Unlock Deck
k this deck
24
What values are excluded from the domain of the function ?
A) 5
B) 0
C)
D)
E) None
?A) 5
B) 0
C)
D)
E) None
Unlock Deck
Unlock for access to all 92 flashcards in this deck.
Unlock Deck
k this deck
25
Graph:
A)
B)
C)
A)
B)
C)
Unlock Deck
Unlock for access to all 92 flashcards in this deck.
Unlock Deck
k this deck
26
Given the function , find
A) 7
B) 29
C) 5
D) 30
E) 8
, find A) 7
B) 29
C) 5
D) 30
E) 8
Unlock Deck
Unlock for access to all 92 flashcards in this deck.
Unlock Deck
k this deck
27
State whether the following relation is a function.
A) Not a function
B) Insufficient information
C) Function
A) Not a function
B) Insufficient information
C) Function
Unlock Deck
Unlock for access to all 92 flashcards in this deck.
Unlock Deck
k this deck
28
State whether the following relation is a function.
A) Insufficient information
B) Function
C) Not a function
A) Insufficient information
B) Function
C) Not a function
Unlock Deck
Unlock for access to all 92 flashcards in this deck.
Unlock Deck
k this deck
29
What values are excluded from the domain of the function ?
A) 0, 4
B)
C) 9
D) 4
E) 4 , 9
?A) 0, 4
B)
C) 9
D) 4
E) 4 , 9
Unlock Deck
Unlock for access to all 92 flashcards in this deck.
Unlock Deck
k this deck
30
Graph:
A)
B)
C)
A)
B)
C)
Unlock Deck
Unlock for access to all 92 flashcards in this deck.
Unlock Deck
k this deck
31
What values are excluded from the domain of the function ?
A) 0, 2
B) 2
C) 1, 2
D) 0
E) 1
?A) 0, 2
B) 2
C) 1, 2
D) 0
E) 1
Unlock Deck
Unlock for access to all 92 flashcards in this deck.
Unlock Deck
k this deck
32
Graph:
A)
B)
C)
A)
B)
C)
Unlock Deck
Unlock for access to all 92 flashcards in this deck.
Unlock Deck
k this deck
33
What values are excluded from the domain of the function ?
A) 4
B) 4, -3
C) 4, -4
D) 0
E) -3
?A) 4
B) 4, -3
C) 4, -4
D) 0
E) -3
Unlock Deck
Unlock for access to all 92 flashcards in this deck.
Unlock Deck
k this deck
34
Given , write in simplest form.
A)
B)
C)
D)
E)
, write in simplest form.A)
B)
C)
D)
E)
Unlock Deck
Unlock for access to all 92 flashcards in this deck.
Unlock Deck
k this deck
35
What values are excluded from the domain of the function ?
A) 9
B) None
C) 3
D) 4.5
E) 0
?A) 9
B) None
C) 3
D) 4.5
E) 0
Unlock Deck
Unlock for access to all 92 flashcards in this deck.
Unlock Deck
k this deck
36
Given the function , find
A) 6
B) 9
C) 0
D) 3
E) -1
, find A) 6
B) 9
C) 0
D) 3
E) -1
Unlock Deck
Unlock for access to all 92 flashcards in this deck.
Unlock Deck
k this deck
37
Find the range of the function defined by the equation and the given domain.
A) {2}
B) all numbers
C) {-8, -4, 0, 8}
D) {(-8,146), (-4,42), (0,2), (8,114)}
E) {146, 42, 2, 114}
A) {2}
B) all numbers
C) {-8, -4, 0, 8}
D) {(-8,146), (-4,42), (0,2), (8,114)}
E) {146, 42, 2, 114}
Unlock Deck
Unlock for access to all 92 flashcards in this deck.
Unlock Deck
k this deck
38
Graph:
A)
B)
C)
A)
B)
C)
Unlock Deck
Unlock for access to all 92 flashcards in this deck.
Unlock Deck
k this deck
39
What values are excluded from the domain of the function ?
A)
B) 0
C) None
D)
E) 7
?A)
B) 0
C) None
D)
E) 7
Unlock Deck
Unlock for access to all 92 flashcards in this deck.
Unlock Deck
k this deck
40
Does the diagram below represent a function?
A) Insufficient information
B) Yes
C) No
A) Insufficient information
B) Yes
C) No
Unlock Deck
Unlock for access to all 92 flashcards in this deck.
Unlock Deck
k this deck
41
The graph below shows how the amount of fuel in the tank of a car decreases as the car is driven. Find the slope of the line between the two points shown on the graph, namely (50, 15) and (150, 9). Write a sentence that states the meaning of the slope.
A) m = -0.06; For each 100 miles the car is driven, approximately 0.06 gal of fuel is used.
B) m = -0.06; For each mile the car is driven, approximately 0.06 gal of fuel is used.
C) m = -0.06; The car averages approximately 60 miles per gallon.
D) m = 0.06; For each mile the car is driven, approximately 0.06 gal of fuel is used.
E) m = -0.6; For each mile the car is driven, approximately 0.6 gal of fuel is used.
Unlock Deck
Unlock for access to all 92 flashcards in this deck.
Unlock Deck
k this deck
42
Graph by using the slope and y-intercept:
A)
B)
C)
A)
B)
C)
Unlock Deck
Unlock for access to all 92 flashcards in this deck.
Unlock Deck
k this deck
43
Find the slope of the line containing the given points.
A)
B) 2
C) Undefined
D) -2
E) -10
A)
B) 2
C) Undefined
D) -2
E) -10
Unlock Deck
Unlock for access to all 92 flashcards in this deck.
Unlock Deck
k this deck
44
Graph by using the slope and y-intercept:
A)
B)
C)
A)
B)
C)
Unlock Deck
Unlock for access to all 92 flashcards in this deck.
Unlock Deck
k this deck
45
The graph below shows the relationship between the distance traveled by a motorist and the time of travel. Find the slope of the line between the two points shown on the graph, namely (1, 80) and (3, 240). Write a sentence that states the meaning of the slope.
A) m = 80; The distance traveled by the motorist in 2 hours is 80 miles.
B) m = 240; The average speed of the motorist is 240 mph.
C) m = 80; The average speed of the motorist is 80 mph.
D) m = 160; The average speed of the motorist is 160 mph.
E) m = 60; The average speed of the motorist is 60 mph.
Unlock Deck
Unlock for access to all 92 flashcards in this deck.
Unlock Deck
k this deck
46
The graph below shows the relationship between the temperature (degrees Fahrenheit) inside an oven and the time since the oven was turned off. Find the slope of the line between the two points shown on the graph, namely (20, 275) and (50, 125). Write a sentence that states the meaning of the slope.
A) m = -5; The temperature of the oven decreases 5 °/min.
B) m = -6; The temperature of the oven decreases 6 °/min.
C) m = 5; The temperature of the oven increases 5 °/min.
D) m = -150; The temperature of the oven decreases 150 °/min.
E) m = 5; The temperature of the oven decreases 5 °/min.
A) m = -5; The temperature of the oven decreases 5 °/min.
B) m = -6; The temperature of the oven decreases 6 °/min.
C) m = 5; The temperature of the oven increases 5 °/min.
D) m = -150; The temperature of the oven decreases 150 °/min.
E) m = 5; The temperature of the oven decreases 5 °/min.
Unlock Deck
Unlock for access to all 92 flashcards in this deck.
Unlock Deck
k this deck
47
Find the slope of the line containing the given points.
A)
B) -4
C)
D)
E)
A)
B) -4
C)
D)
E)
Unlock Deck
Unlock for access to all 92 flashcards in this deck.
Unlock Deck
k this deck
48
Find the equation of the line that contains the given point and has the given slope. (5, 1) , m = .
A)
B)
C)
D)
E)
.A)
B)
C)
D)
E)
Unlock Deck
Unlock for access to all 92 flashcards in this deck.
Unlock Deck
k this deck
49
Find the equation of the line that contains the given point and has the given slope. (-2, -12) , m = 5.
A)
B)
C)
D)
E)
A)
B)
C)
D)
E)
Unlock Deck
Unlock for access to all 92 flashcards in this deck.
Unlock Deck
k this deck
50
Graph by using the slope and y-intercept:
A)
B)
C)
A)
B)
C)
Unlock Deck
Unlock for access to all 92 flashcards in this deck.
Unlock Deck
k this deck
51
The graph below shows the number of gallons of water remaining in a pool x minutes after a pump is turned on to drain the pool. Find the slope of the line between the two points shown on the graph, namely (0, 32) and (25, 5). Write a sentence that states the meaning of the slope.
A) m = -1.08; Each minute, 1080 gallons are being drained from the pool.
B) m = -1.08; Each minute, 1.08 gallons are being drained from the pool.
C) m = -0.93; Every 25 minutes, 930 gallons are being drained from the pool.
D) m = -1.08; Every 25 minutes, 1080 gallons are being drained from the pool.
E) m = -0.93; Each minute, 930 gallons are being drained from the pool.
Unlock Deck
Unlock for access to all 92 flashcards in this deck.
Unlock Deck
k this deck
52
Graph:
A)
B)
C)
A)
B)
C)
Unlock Deck
Unlock for access to all 92 flashcards in this deck.
Unlock Deck
k this deck
53
Graph:
A)
B)
C)
A)
B)
C)
Unlock Deck
Unlock for access to all 92 flashcards in this deck.
Unlock Deck
k this deck
54
A custom-illustrated sign or banner can be commissioned for a cost of $21.00 for the material and $11.90 per square foot for artwork. The equation that represents this cost is given by y = 11.90x + 21.00, where y is the cost and x is the number of square feet in the sign. When this equation is graphed for , the ordered pair (13, 175.70) is discovered to lie on the graph. Write a sentence that describes the meaning of the ordered pair (13, 175.70).
A) It costs $175.70 for each additional square foot of sign area.
B) It costs $13 for a custom sign 175.70 ft2 in area.
C) It costs $13 for material and $175.70 for artwork.
D) It costs $175.70 for a custom sign 13 ft2 in area.
E) It costs $13 for each additional square foot of sign area.
, the ordered pair (13, 175.70) is discovered to lie on the graph. Write a sentence that describes the meaning of the ordered pair (13, 175.70).A) It costs $175.70 for each additional square foot of sign area.
B) It costs $13 for a custom sign 175.70 ft2 in area.
C) It costs $13 for material and $175.70 for artwork.
D) It costs $175.70 for a custom sign 13 ft2 in area.
E) It costs $13 for each additional square foot of sign area.
Unlock Deck
Unlock for access to all 92 flashcards in this deck.
Unlock Deck
k this deck
55
Find the x- and y-intercepts of the line
A) x-intercept: (9, 0), y-intercept: (0, -6)
B) x-intercept: (-9, 0), y-intercept: (0, 6)
C) x-intercept: (6, 0), y-intercept: (0, 9)
D) x-intercept: (9, 0), y-intercept: (0, 6)
E) x-intercept: (-9, 0), y-intercept: (0, -6)
A) x-intercept: (9, 0), y-intercept: (0, -6)
B) x-intercept: (-9, 0), y-intercept: (0, 6)
C) x-intercept: (6, 0), y-intercept: (0, 9)
D) x-intercept: (9, 0), y-intercept: (0, 6)
E) x-intercept: (-9, 0), y-intercept: (0, -6)
Unlock Deck
Unlock for access to all 92 flashcards in this deck.
Unlock Deck
k this deck
56
Graph:
A)
B)
C)
A)
B)
C)
Unlock Deck
Unlock for access to all 92 flashcards in this deck.
Unlock Deck
k this deck
57
Graph by using the slope and y-intercept:
A)
B)
C)
A)
B)
C)
Unlock Deck
Unlock for access to all 92 flashcards in this deck.
Unlock Deck
k this deck
58
Graph by using the slope and y-intercept:
A)
B)
C)
A)
B)
C)
Unlock Deck
Unlock for access to all 92 flashcards in this deck.
Unlock Deck
k this deck
59
Find the equation of the line that contains the given point and has the given slope. (-4, 21) , m = -4.
A)
B)
C)
D)
E)
A)
B)
C)
D)
E)
Unlock Deck
Unlock for access to all 92 flashcards in this deck.
Unlock Deck
k this deck
60
Graph by using the slope and y-intercept:
A)
B)
C)
A)
B)
C)
Unlock Deck
Unlock for access to all 92 flashcards in this deck.
Unlock Deck
k this deck
61
The slope of a line is . What is the slope of any line perpendicular to this line?
A)
B)
C)
D)
E)
. What is the slope of any line perpendicular to this line?A)
B)
C)
D)
E)
Unlock Deck
Unlock for access to all 92 flashcards in this deck.
Unlock Deck
k this deck
62
Let f be a linear function. If and , find .
A)
B)
C)
D)
E)
and , find .A)
B)
C)
D)
E)
Unlock Deck
Unlock for access to all 92 flashcards in this deck.
Unlock Deck
k this deck
63
A Boeing 747 jet takes off from Boston's Logan Airport, which is at sea level, and climbs to a cruising altitude of 27,000 ft at a constant rate of 1100 ft/min.
A. Write a linear equation for the height of the plane in terms of the time after takeoff.
B. Use your equation to find the height of the plane 12 min after takeoff.
A) (a) ; (b) 13,800 ft
B) (a) ; (b) 40,200 ft
C) (a) ; (b) 13,200 ft
D) (a) ; (b) 40,200 ft
E) (a) ; (b) 13,200 ft
A. Write a linear equation for the height of the plane in terms of the time after takeoff.
B. Use your equation to find the height of the plane 12 min after takeoff.
A) (a)
; (b) 13,800 ftB) (a)
; (b) 40,200 ftC) (a)
; (b) 13,200 ftD) (a)
; (b) 40,200 ftE) (a)
; (b) 13,200 ft Unlock Deck
Unlock for access to all 92 flashcards in this deck.
Unlock Deck
k this deck
64
Find the equation of the line passing through the points whose coordinates are .
A)
B)
C)
D)
E)
.A)
B)
C)
D)
E)
Unlock Deck
Unlock for access to all 92 flashcards in this deck.
Unlock Deck
k this deck
65
Is the line parallel to the line ?
A) Insufficient information
B) Yes
C) No
parallel to the line ?A) Insufficient information
B) Yes
C) No
Unlock Deck
Unlock for access to all 92 flashcards in this deck.
Unlock Deck
k this deck
66
An account executive receives a base salary plus a commission. With $17,000 in monthly sales, the account executive receives $1700. On $45,000 in monthly sales, the account executive receives $2700.
A. Determine a linear function that will yield the compensation of the sales executive for a given amount of monthly sales. Round any numbers in your function to the nearest hundredth.
B. Use this model, with coefficients rounded to the nearest hundreth, to determine the account executive's compensation for $36,700 in monthly sales. Round to the nearest dollar.
A) (a) ; (b) $1468
B) (a) ; (b) $1093
C) (a) ; (b) $4763
D) (a) ; (b) $2561
E) (a) ; (b) $1468
A. Determine a linear function that will yield the compensation of the sales executive for a given amount of monthly sales. Round any numbers in your function to the nearest hundredth.
B. Use this model, with coefficients rounded to the nearest hundreth, to determine the account executive's compensation for $36,700 in monthly sales. Round to the nearest dollar.
A) (a)
; (b) $1468B) (a)
; (b) $1093C) (a)
; (b) $4763D) (a)
; (b) $2561E) (a)
; (b) $1468 Unlock Deck
Unlock for access to all 92 flashcards in this deck.
Unlock Deck
k this deck
67
The gas tank of a certain car contains 17 gal of gas when the driver of the car begins a trip. Each mile driven by the driver decreases the amount of gas in the tank by 0.068 gal.
A. Write a linear function for the number of gallons of gas in the tank in terms of the number of miles driven.
B. Use your equation to find the number of gallons in the tank after driving 161 mi. Round your answer to the nearest tenth of a gallon.
A) (a) ; (b) 27.9 gal
B) (a) ; (b) 27.9 gal
C) (a) ; (b) 6.1 gal
D) (a) ; (b) 10.9 gal
E) (a) ; (b) 10.9 gal
A. Write a linear function for the number of gallons of gas in the tank in terms of the number of miles driven.
B. Use your equation to find the number of gallons in the tank after driving 161 mi. Round your answer to the nearest tenth of a gallon.
A) (a)
; (b) 27.9 galB) (a)
; (b) 27.9 galC) (a)
; (b) 6.1 galD) (a)
; (b) 10.9 galE) (a)
; (b) 10.9 gal Unlock Deck
Unlock for access to all 92 flashcards in this deck.
Unlock Deck
k this deck
68
Find the equation of line that contains the point whose coordinates are (-7, -10) and whose slope is undefined.
A)
B)
C)
D)
E)
A)
B)
C)
D)
E)
Unlock Deck
Unlock for access to all 92 flashcards in this deck.
Unlock Deck
k this deck
69
Find the equation of the line passing through the points whose coordinates are .
A)
B)
C)
D)
E)
.A)
B)
C)
D)
E)
Unlock Deck
Unlock for access to all 92 flashcards in this deck.
Unlock Deck
k this deck
70
The slope of a line is . What is the slope of any line parallel to this line?
A)
B)
C)
D)
E)
. What is the slope of any line parallel to this line?A)
B)
C)
D)
E)
Unlock Deck
Unlock for access to all 92 flashcards in this deck.
Unlock Deck
k this deck
71
Find the equation of the line that contains the points P1(-2, -8) and P2(-2, 8).
A)
B)
C)
D)
E)
A)
B)
C)
D)
E)
Unlock Deck
Unlock for access to all 92 flashcards in this deck.
Unlock Deck
k this deck
72
Is the line perpendicular to the line ?
A) Insufficient information
B) Yes
C) No
perpendicular to the line ?A) Insufficient information
B) Yes
C) No
Unlock Deck
Unlock for access to all 92 flashcards in this deck.
Unlock Deck
k this deck
73
Find the equation of the line that contains the given point and has the given slope. (-5, -6) , m =
A)
B)
C)
D)
E)
A)
B)
C)
D)
E)
Unlock Deck
Unlock for access to all 92 flashcards in this deck.
Unlock Deck
k this deck
74
Find the equation of the line that contains the points P1(-2, -4) and P2(3, -7).
A)
B)
C)
D)
E)
A)
B)
C)
D)
E)
Unlock Deck
Unlock for access to all 92 flashcards in this deck.
Unlock Deck
k this deck
75
A cellular phone company offers several different service plans. One option, for people who plan on using the phone only in emergencies, costs the user $5.15 per month plus $0.60 per minute for each minute the phone is used.
A. Write a linear function for the monthly cost of the phone in terms of the number of minutes the phone is used.
B. Use your equation to find the cost of using the cellular phone for 14 minutes in 1 month.
A) (a) ; (b) $8.40
B) (a) ; (b) $19.15
C) (a) ; (b) $13.55
D) (a) ; (b) $5.15
E) (a) ; (b) $72.70
A. Write a linear function for the monthly cost of the phone in terms of the number of minutes the phone is used.
B. Use your equation to find the cost of using the cellular phone for 14 minutes in 1 month.
A) (a)
; (b) $8.40B) (a)
; (b) $19.15C) (a)
; (b) $13.55D) (a)
; (b) $5.15E) (a)
; (b) $72.70 Unlock Deck
Unlock for access to all 92 flashcards in this deck.
Unlock Deck
k this deck
76
Find the equation of the line that contains the points P1(-3, -4) and P2(5, -4).
A)
B)
C)
D)
E)
A)
B)
C)
D)
E)
Unlock Deck
Unlock for access to all 92 flashcards in this deck.
Unlock Deck
k this deck
77
A manufacturer of graphing calculators has determined that 12,000 calculators per week will be sold at a price of $110 each. At a price of $90, it is estimated that 15,000 calculators would be sold.
A. Determine a linear function that will predict the number of calculators that would be sold at a given price, x.
B. Use this model to predict the number of calculators that would be sold each week at a price of $75.
A) (a) ; (b) 13,500 calculators
B) (a) ; (b) 6750 calculators
C) (a) ; (b) 751 calculators
D) (a) ; (b) 17,250 calculators
E) (a) ; (b) 17,250 calculators
A. Determine a linear function that will predict the number of calculators that would be sold at a given price, x.
B. Use this model to predict the number of calculators that would be sold each week at a price of $75.
A) (a)
; (b) 13,500 calculatorsB) (a)
; (b) 6750 calculatorsC) (a)
; (b) 751 calculatorsD) (a)
; (b) 17,250 calculatorsE) (a)
; (b) 17,250 calculators Unlock Deck
Unlock for access to all 92 flashcards in this deck.
Unlock Deck
k this deck
78
Find the equation of the line passing through the points whose coordinates are .
A)
B)
C)
D)
E)
.A)
B)
C)
D)
E)
Unlock Deck
Unlock for access to all 92 flashcards in this deck.
Unlock Deck
k this deck
79
Given that f is a linear function for which and , determine .
A) 1
B) 19
C) -3
D) 3
E) 5
and , determine .A) 1
B) 19
C) -3
D) 3
E) 5
Unlock Deck
Unlock for access to all 92 flashcards in this deck.
Unlock Deck
k this deck
80
Find the equation of the line passing through the points whose coordinates are .
A)
B)
C)
D)
E)
.A)
B)
C)
D)
E)
Unlock Deck
Unlock for access to all 92 flashcards in this deck.
Unlock Deck
k this deck
Unlock Deck
Unlock for access to all 92 flashcards in this deck.


