Deck 12: Analysis of Variance
Full screen (f)
Question
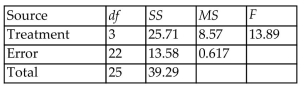
Fill in the missing entries in the following partially completed one-way ANOVA table. 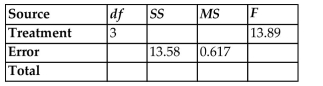
Question
Question
The data below represent the weight losses for people on three different exercise programs. 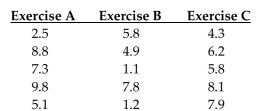 If we want to test the claim that the three size categories have the same means, why don't we use three separate
hypothesis tests for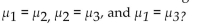
If we want to test the claim that the three size categories have the same means, why don't we use three separatehypothesis tests for
Question
Use the data in the given table and the corresponding Minitab display to test the hypothesis. The following table
entries are test scores for males and females at different times of day. Assuming no effect from the interaction
between gender and test time, test the claim that time of day does not affect test scores. Use a 0.05 significance
level.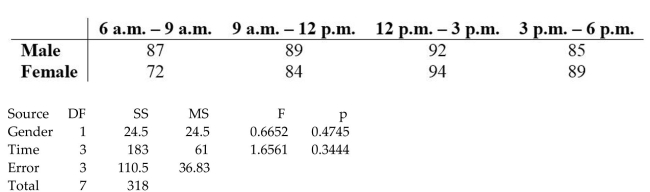
entries are test scores for males and females at different times of day. Assuming no effect from the interaction
between gender and test time, test the claim that time of day does not affect test scores. Use a 0.05 significance
level.
Question
The following data contains task completion times, in minutes, categorized according to the gender of the
machine operator and the machine used.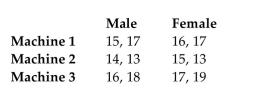 Assume that two-way ANOVA is used to analyze the data. How are the ANOVA results affected if 5 minutes is
added to each completion time?
machine operator and the machine used.
Assume that two-way ANOVA is used to analyze the data. How are the ANOVA results affected if 5 minutes isadded to each completion time?
Question
Question
Test the claim that the samples come from populations with the same mean. Assume that the populations are normally
distributed with the same variance.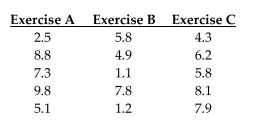 At the 1% significance level, does it appear that a difference exists in the true mean weight loss produced by the three
exercise programs?
distributed with the same variance.
At the 1% significance level, does it appear that a difference exists in the true mean weight loss produced by the threeexercise programs?
Question

Question
Use the Minitab display to test the indicated claim. A manager records the production output of three employees who
each work on three different machines for three different days. The sample results are given below and the Minitab
results follow.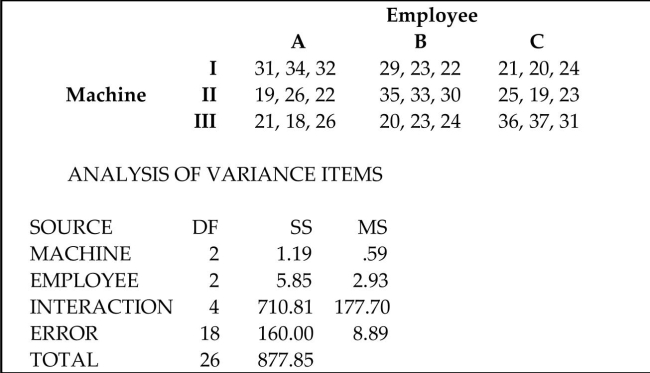 Using a 0.05 significance level, test the claim that the interaction between employee and machine has no effect on the
number of items produced.
each work on three different machines for three different days. The sample results are given below and the Minitab
results follow.
Using a 0.05 significance level, test the claim that the interaction between employee and machine has no effect on thenumber of items produced.
Question
The following data contains task completion times, in minutes, categorized according to the gender of the machine
operator and the machine used.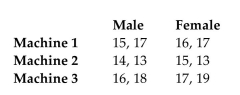 Assume that two-way ANOVA is used to analyze the data. How are the ANOVA results affected if the times are
converted to hours?
operator and the machine used.
Assume that two-way ANOVA is used to analyze the data. How are the ANOVA results affected if the times areconverted to hours?
Question
Use the data in the given table and the corresponding Minitab display to test the hypothesis. The following table
shows the mileage for four different cars and three different brands of gas. Assuming no effect from the
interaction between car and brand of gas, test the claim that the four cars have the same mean mileage. Use a
0.05 significance level.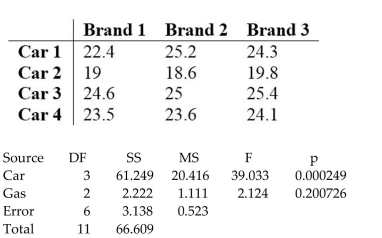
shows the mileage for four different cars and three different brands of gas. Assuming no effect from the
interaction between car and brand of gas, test the claim that the four cars have the same mean mileage. Use a
0.05 significance level.
Question
Use the Minitab display to test the indicated claim. A manager records the production output of three
employees who each work on three different machines for three different days. The sample results are given
below and the Minitab results follow.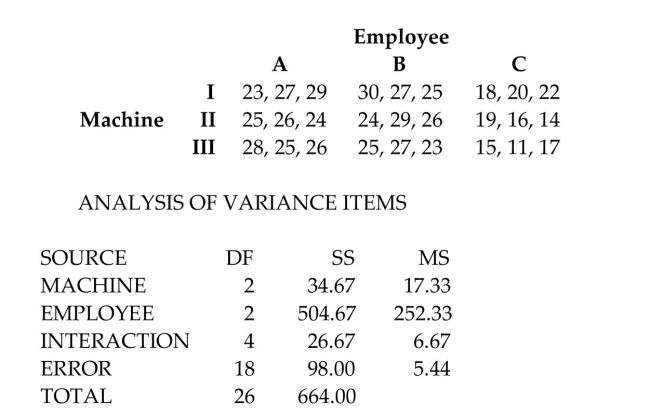 Assume that the number of items produced is not affected by an interaction between employee and machine. Using a
0.05 significance level, test the claim that the machine has no effect on the number of items produced.
employees who each work on three different machines for three different days. The sample results are given
below and the Minitab results follow.
Assume that the number of items produced is not affected by an interaction between employee and machine. Using a0.05 significance level, test the claim that the machine has no effect on the number of items produced.
Question
Test the claim that the samples come from populations with the same mean. Assume that the populations are
normally distributed with the same variance. At the 0.025 significance level, test the claim that the four brands
have the same mean if the following sample results have been obtained.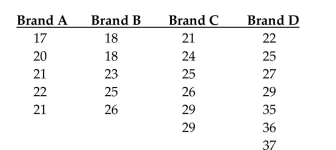
normally distributed with the same variance. At the 0.025 significance level, test the claim that the four brands
have the same mean if the following sample results have been obtained.
Question
Question
The following results are from a statistics software package in which all of the F values and P-values are given.
Is there a significant effect from the interaction? Should you test to see if there is a significant effect due to either
A or B? If the answer is yes, is there a significant effect due to either A or B?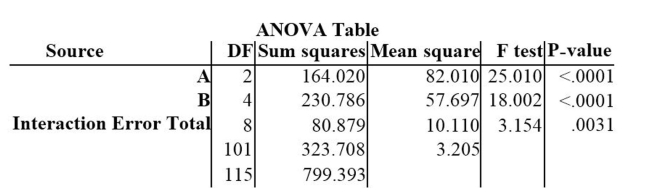
Is there a significant effect from the interaction? Should you test to see if there is a significant effect due to either
A or B? If the answer is yes, is there a significant effect due to either A or B?
Question
Question
The following data contains task completion times, in minutes, categorized according to the gender of the machine
operator and the machine used.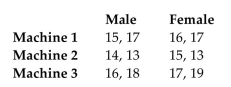 The ANOVA results lead us to conclude that the completion times are not affected by an interaction between machine
and gender, and the times are not affected by gender, but they are affected by the machine. Change the table entries so
that there is an effect from the interaction between machine and gender.
operator and the machine used.
The ANOVA results lead us to conclude that the completion times are not affected by an interaction between machineand gender, and the times are not affected by gender, but they are affected by the machine. Change the table entries so
that there is an effect from the interaction between machine and gender.
Question
The following data contains task completion times, in minutes, categorized according to the gender of the machine
operator and the machine used.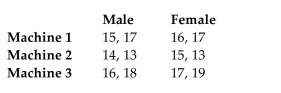 The ANOVA results lead us to conclude that the completion times are not affected by an interaction between machine
and gender, and the times are not affected by gender, but they are affected by the machine. Change the table entries so
that there is no effect from the interaction between machine and gender, but there is an effect from the gender of the
operator.
operator and the machine used.
The ANOVA results lead us to conclude that the completion times are not affected by an interaction between machineand gender, and the times are not affected by gender, but they are affected by the machine. Change the table entries so
that there is no effect from the interaction between machine and gender, but there is an effect from the gender of the
operator.
Question
Test the claim that the samples come from populations with the same mean. Assume that the populations are
normally distributed with the same variance. At the 0.025 significance level, test the claim that the three brands
have the same mean if the following sample results have been obtained.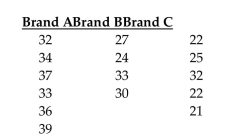
normally distributed with the same variance. At the 0.025 significance level, test the claim that the three brands
have the same mean if the following sample results have been obtained.
Question
Use the data in the given table and the corresponding Minitab display to test the hypothesis. The following table
shows the mileage for four different cars and three different brands of gas. Assuming no effect from the
interaction between car and brand of gas, test the claim that the three brands of gas provide the same mean gas
mileage. Use a 0.05 significance level.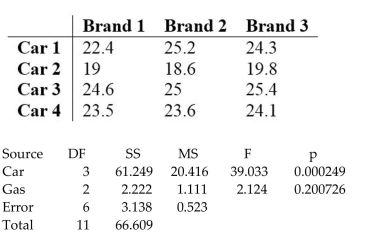
shows the mileage for four different cars and three different brands of gas. Assuming no effect from the
interaction between car and brand of gas, test the claim that the three brands of gas provide the same mean gas
mileage. Use a 0.05 significance level.
Question
Question
Question
Test the claim that the samples come from populations with the same mean. Assume that the populations are
normally distributed with the same variance. At the 0.025 significance level, test the claim that the four brands
have the same mean if the following sample results have been obtained.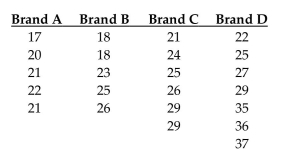
normally distributed with the same variance. At the 0.025 significance level, test the claim that the four brands
have the same mean if the following sample results have been obtained.
Question
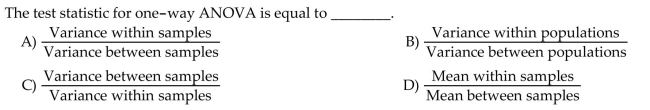
The test statistics for one-way ANOVA is 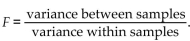 Describe variance within samples and
variance between samples. What relationship does variance within samples and variance between samples
would result in the conclusion that the value of F is significant?
Describe variance within samples andvariance between samples. What relationship does variance within samples and variance between samples
would result in the conclusion that the value of F is significant?
Question
The following data shows annual income, in thousands of dollars, categorized according to the two factors of
gender and level of education. Assume that incomes are not affected by an interaction between gender and level
of education, and test the null hypothesis that level of education has no effect on income. Use a 0.05 significance
level.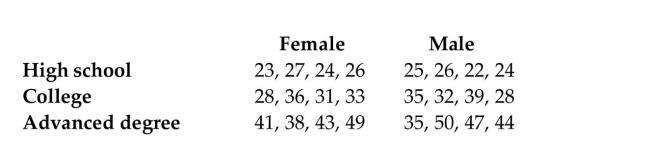
gender and level of education. Assume that incomes are not affected by an interaction between gender and level
of education, and test the null hypothesis that level of education has no effect on income. Use a 0.05 significance
level.
Question
Assume that the number of items produced is not affected by an interaction between employee and machine.
Using a 0.05 significance level, test the claim that the machine has no effect on the number of items produced.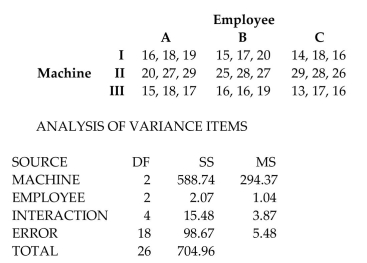 Using a 0.05 significance level, test the claim that the interaction between employee and machine has no effect on the
number of items produced.
Using a 0.05 significance level, test the claim that the machine has no effect on the number of items produced.
Using a 0.05 significance level, test the claim that the interaction between employee and machine has no effect on thenumber of items produced.
Question
The following data shows the yield, in bushels per acre, categorized according to three varieties of corn and
three different soil conditions. Assume that yields are not affected by an interaction between variety and soil
conditions, and test the null hypothesis that variety has no effect on yield. Use a 0.05 significance level.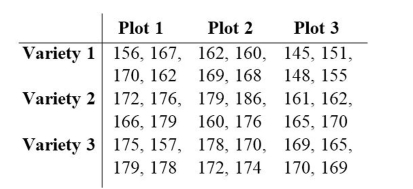
three different soil conditions. Assume that yields are not affected by an interaction between variety and soil
conditions, and test the null hypothesis that variety has no effect on yield. Use a 0.05 significance level.
Question
The data below represent the weight losses for people on three diets. 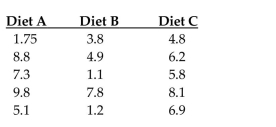 If we want to test the claim that the three size categories have the same means, why don't we use three separate
hypothesis tests for
If we want to test the claim that the three size categories have the same means, why don't we use three separatehypothesis tests for
Question
Test the claim that the samples come from populations with the same mean. Assume that the populations are
normally distributed with the same variance. Given the sample data below, test the claim that the populations
have the same mean. Use a significance level of 0.05.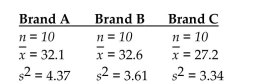
normally distributed with the same variance. Given the sample data below, test the claim that the populations
have the same mean. Use a significance level of 0.05.
Question
Test the claim that the samples come from populations with the same mean. Assume that the populations are
normally distributed with the same variance. At the 0.025 significance level, test the claim that the three brands
have the same mean if the following sample results have been obtained.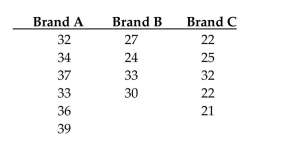
normally distributed with the same variance. At the 0.025 significance level, test the claim that the three brands
have the same mean if the following sample results have been obtained.
Question
Use the data in the given table and the corresponding Minitab display to test the hypothesis. The following
Minitab display results from a study in which three different teachers taught calculus classes of five different
sizes. The class average was recorded for each class. Assuming no effect from the interaction between teacher
and class size, test the claim that the teacher has no effect on the class average. Use a 0.05 significance level.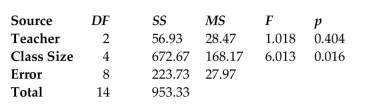
Question
Question
Given below are the analysis of variance results from a Minitab display. Assume that you want to use a 0.05 significance level in testing the null hypothesis that the different samples come from populations with the same
Mean. Identify the p-value.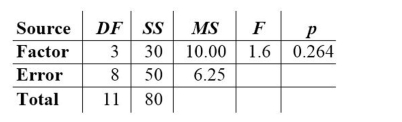
A) 6.25
B) 1.6
C) 10.00
D) 0.264
Mean. Identify the p-value.
A) 6.25
B) 1.6
C) 10.00
D) 0.264
Question
Use the data in the given table and the corresponding Minitab display to test the hypothesis. The following table shows
the mileage for four different cars and three different brands of gas. Assuming no effect from the interaction between
car and brand of gas, test the claim that the four cars have the same mean mileage. Use a 0.05 significance level.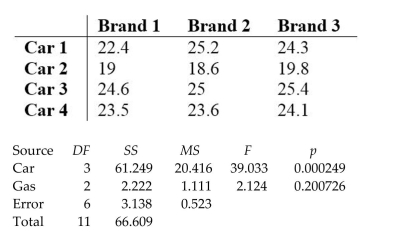
the mileage for four different cars and three different brands of gas. Assuming no effect from the interaction between
car and brand of gas, test the claim that the four cars have the same mean mileage. Use a 0.05 significance level.
Question
Fill in the missing entries in the following partially completed one-way ANOVA table. 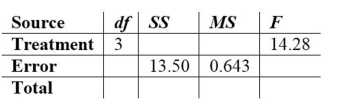
Question
Test the claim that the samples come from populations with the same mean. Assume that the populations are
normally distributed with the same variance. The data below represent the weight losses for people on three
different exercise programs.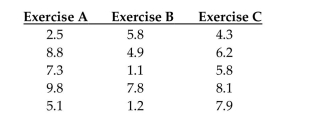 At the 1% significance level, does it appear that a difference exists in the true mean weight loss produced by the three
exercise programs?
normally distributed with the same variance. The data below represent the weight losses for people on three
different exercise programs.
At the 1% significance level, does it appear that a difference exists in the true mean weight loss produced by the threeexercise programs?
Question
Use the Minitab display to test the indicated claim. A manager records the production output of three
employees who each work on three different machines for three different days. The sample results are given
below and the Minitab results follow.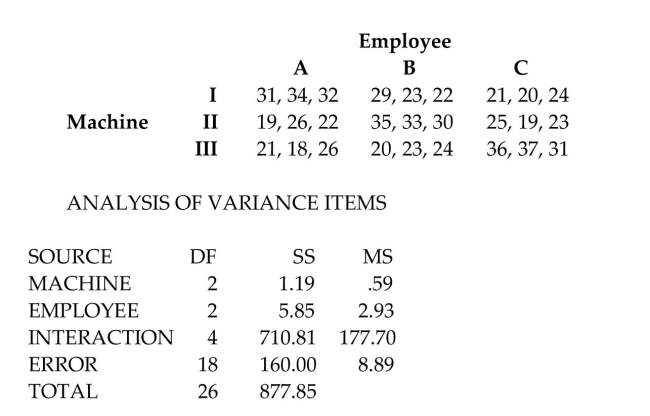 Assume that the number of items produced is not affected by an interaction between employee and machine.
Using a 0.05 significance level, test the claim that the machine has no effect on the number of items produced.
employees who each work on three different machines for three different days. The sample results are given
below and the Minitab results follow.
Assume that the number of items produced is not affected by an interaction between employee and machine.Using a 0.05 significance level, test the claim that the machine has no effect on the number of items produced.
Question
Use the Minitab display to test the indicated claim. A manager records the production output of three
employees who each work on three different machines for three different days. The sample results are given
below and the Minitab results follow.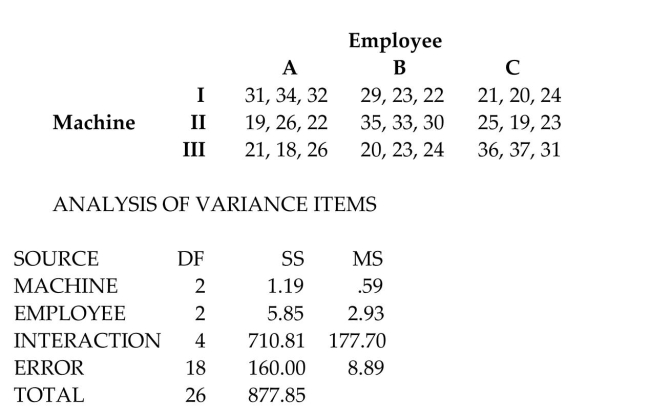 Assume that the number of items produced is not affected by an interaction between employee and machine. Using a
0.05 significance level, test the claim that the choice of employee has no effect on the number of items produced.
employees who each work on three different machines for three different days. The sample results are given
below and the Minitab results follow.
Assume that the number of items produced is not affected by an interaction between employee and machine. Using a0.05 significance level, test the claim that the choice of employee has no effect on the number of items produced.
Question
Question

Question
The data below represent the weight losses for people on three different exercise programs. 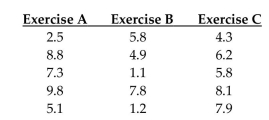 If we want to test the claim that the three size categories have the same means, why don't we use three separate hypothesis tests for
 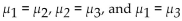 ?
?
A) Actually, we do want to use three separate hypothesis tests.
B) The risk of type II error increases and becomes too high.
C) A hypothesis test for comparing two means does not exist.
D) The risk of type I error increases and becomes too high.
If we want to test the claim that the three size categories have the same means, why don't we use three separate hypothesis tests for ?A) Actually, we do want to use three separate hypothesis tests.
B) The risk of type II error increases and becomes too high.
C) A hypothesis test for comparing two means does not exist.
D) The risk of type I error increases and becomes too high.
Question
Question
Given below are the analysis of variance results from a Minitab display. Assume that you want to use a 0.05 significance
level in testing the null hypothesis that the different samples come from populations with the same mean.
Identify the value of the test statistic.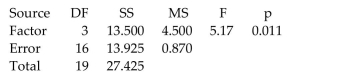
A) 5.17
B) 4.500
C) 13.500
D) 0.011
level in testing the null hypothesis that the different samples come from populations with the same mean.
Identify the value of the test statistic.
A) 5.17
B) 4.500
C) 13.500
D) 0.011
Question
Use the Minitab display to test the indicated claim. A manager records the production output of three employees who each work on three different machines for three different days. The sample results are given
Below and the Minitab results follow. Using a 0.05 significance level, test the claim that the interaction between employee and machine has no effect on the
Number of items produced. State your conclusion about the null hypothesis and the claim.
A) Fail to reject the null hypothesis. There appears to be an interaction effect.
B) Fail to reject the null hypothesis. There does not appear to be an interaction effect.
C) Reject the null hypothesis. There appears to be an interaction effect.
D) Reject the null hypothesis. There does not appear to be an interaction effect.
Below and the Minitab results follow.
Using a 0.05 significance level, test the claim that the interaction between employee and machine has no effect on theNumber of items produced. State your conclusion about the null hypothesis and the claim.
A) Fail to reject the null hypothesis. There appears to be an interaction effect.
B) Fail to reject the null hypothesis. There does not appear to be an interaction effect.
C) Reject the null hypothesis. There appears to be an interaction effect.
D) Reject the null hypothesis. There does not appear to be an interaction effect.
Question
Given below are the analysis of variance results from a Minitab display. Assume that you want to use a 0.05 significance level in testing the null hypothesis that the different samples come from populations with the same
Mean. Identify the P-value.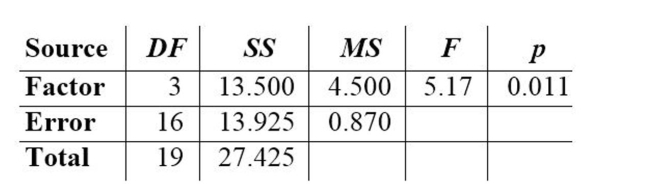
A) 0.011
B) 0.870
C) 5.17
D) 4.500
Mean. Identify the P-value.
A) 0.011
B) 0.870
C) 5.17
D) 4.500
Question
At the same time each day, a researcher records the temperature in each of three greenhouses. The table shows the temperatures in degrees Fahrenheit recorded for one week. 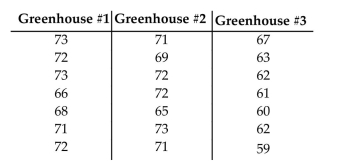 What type of test would you use to test the claim that the average temperature is the same in each greenhouse at a 0.05
Significance level?
A) Two-way ANOVA
B) Test of Independence
C) One-way ANOVA
D) Goodness-of-Fit
What type of test would you use to test the claim that the average temperature is the same in each greenhouse at a 0.05Significance level?
A) Two-way ANOVA
B) Test of Independence
C) One-way ANOVA
D) Goodness-of-Fit
Question
Given below are the analysis of variance results from a Minitab display. Assume that you want to use a 0.05 significance level in testing the null hypothesis that the different samples come from populations with the same
Mean. Identify the P-value.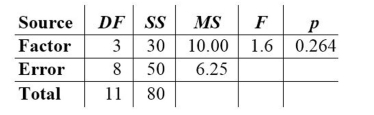
A) 10.00
B) 0.264
C) 1.6
D) 6.25
Mean. Identify the P-value.
A) 10.00
B) 0.264
C) 1.6
D) 6.25
Question
Question
Question
Given below are the analysis of variance results from a Minitab display. Assume that you want to use a 0.05 significance
level in testing the null hypothesis that the different samples come from populations with the same mean.
Find the critical value.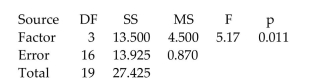
A) 5.42
B) 3.24
C) 3.06
D) 8.70
level in testing the null hypothesis that the different samples come from populations with the same mean.
Find the critical value.
A) 5.42
B) 3.24
C) 3.06
D) 8.70
Question
Question
Identify the value of the test statistic. 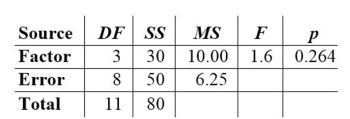
A) 10.00
B) 30
C) 0.264
D) 1.6
A) 10.00
B) 30
C) 0.264
D) 1.6
Question
Given below are the analysis of variance results from a Minitab display. Assume that you want to use a 0.05 significance level in testing the null hypothesis that the different samples come from populations with the same
Mean. What can you conclude about the equality of the population means?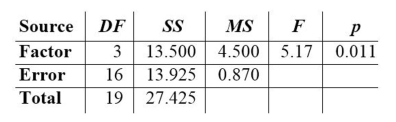
A) Accept the null hypothesis since the P-value is greater than the significance level.
B) Reject the null hypothesis since the P-value is greater than the significance level.
C) Accept the null hypothesis since the P-value is less than the significance level.
D) Reject the null hypothesis since the P-value is less than the significance level.
Question
Given below are the analysis of variance results from a Minitab display. Assume that you want to use a 0.05 significance level in testing the null hypothesis that the different samples come from populations with the same
Mean. Find the critical value.
A) 1.6
B) 4.07
C) 8.85
D) 7.59
Mean. Find the critical value.
A) 1.6
B) 4.07
C) 8.85
D) 7.59
Question
Select an appropriate null hypothesis for a one way analysis of variance test. 
Question
At the same time each day, a researcher records the temperature in each of three classrooms. The table shows the temperatures in degrees Fahrenheit recorded for one week. 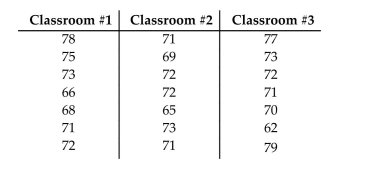 How are the analysis of variance results affected if the same constant is added to every one of the original sample
Values?
A) The test statistic is divided by the value of the constant.
B) The test statistic increases by a factor of the constant.
C) The test statistic increases by the value of the constant.
D) The results are not affected.
How are the analysis of variance results affected if the same constant is added to every one of the original sampleValues?
A) The test statistic is divided by the value of the constant.
B) The test statistic increases by a factor of the constant.
C) The test statistic increases by the value of the constant.
D) The results are not affected.
Question
Given below are the analysis of variance results from a Minitab display. Assume that you want to use a 0.05 significance
level in testing the null hypothesis that the different samples come from populations with the same mean.
Identify the p-value.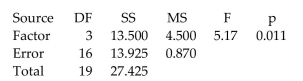
A) 5.17
B) 0.870
C) 4.500
D) 0.011
level in testing the null hypothesis that the different samples come from populations with the same mean.
Identify the p-value.
A) 5.17
B) 0.870
C) 4.500
D) 0.011
Question
Question
Use the Minitab display to test the indicated claim. A manager records the production output of three employees who each work on three different machines for three different days. The sample results are given
Below and the Minitab results follow.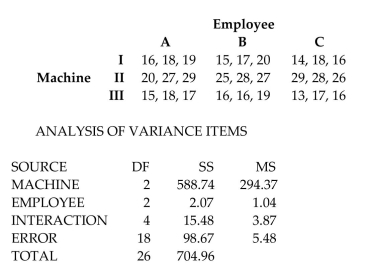 Assume that the number of items produced is not affected by an interaction between employee and machine. Using a
0)05 significance level, test the claim that the choice of employee has no effect on the number of items produced. What is
The value of the test statistic, F?
A) F = 0.1898
B) F = 5.2692
C) F = 0.2687
D) F = 53.7172
Below and the Minitab results follow.
Assume that the number of items produced is not affected by an interaction between employee and machine. Using a0)05 significance level, test the claim that the choice of employee has no effect on the number of items produced. What is
The value of the test statistic, F?
A) F = 0.1898
B) F = 5.2692
C) F = 0.2687
D) F = 53.7172
Question
Given below are the analysis of variance results from a Minitab display. Assume that you want to use a 0.05 significance level in testing the null hypothesis that the different samples come from populations with the same
Mean. Identify the value of the test statistic.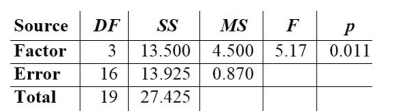
A) 5.17
B) 0.011
C) 4.500
D) 13.500
Mean. Identify the value of the test statistic.
A) 5.17
B) 0.011
C) 4.500
D) 13.500
Question
Given below are the analysis of variance results from a Minitab display. Assume that you want to use a 0.05 significance
level in testing the null hypothesis that the different samples come from populations with the same mean.
Identify the value of the test statistic.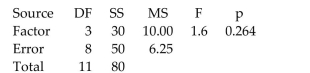
A) 30
B) 0.264
C) 1.6
D) 10.00
level in testing the null hypothesis that the different samples come from populations with the same mean.
Identify the value of the test statistic.
A) 30
B) 0.264
C) 1.6
D) 10.00
Question
At the same time each day, a researcher records the temperature in each of three greenhouses. The table shows
the temperatures in degrees Fahrenheit recorded for one week.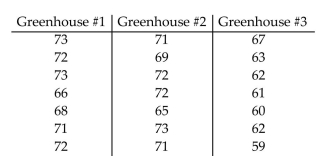 i) Use a 0.05 significance level to test the claim that the average temperature is the same in each greenhouse.
ii) How are the analysis of variance results affected if the same constant is added to every one of the original
sample values?
the temperatures in degrees Fahrenheit recorded for one week.
i) Use a 0.05 significance level to test the claim that the average temperature is the same in each greenhouse.ii) How are the analysis of variance results affected if the same constant is added to every one of the original
sample values?
Question
The data below represent the weight losses for people on three different exercise programs. 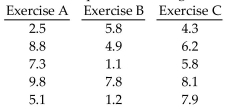 At the 1% significance level, does it appear that a difference exists in the true mean weight loss produced by the
three exercise programs?
At the 1% significance level, does it appear that a difference exists in the true mean weight loss produced by thethree exercise programs?
Question
Use the data given below to verify that the t test for independent samples and the ANOVA method are
equivalent.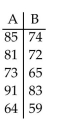 i) Use a t test with a 0.05 significance level to test the claim that the two samples come from populations with
the same means.
ii) Use the ANOVA method with a 0.05 significance level to test the same claim.
iii) Verify that the squares of the t test statistic and the critical value are equal to the F test statistic and critical
value.
equivalent.
i) Use a t test with a 0.05 significance level to test the claim that the two samples come from populations withthe same means.
ii) Use the ANOVA method with a 0.05 significance level to test the same claim.
iii) Verify that the squares of the t test statistic and the critical value are equal to the F test statistic and critical
value.
Question
Use the data given below to verify that the t test for independent samples and the ANOVA method are
equivalent.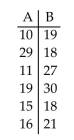 i) Use a t test with a 0.05 significance level to test the claim that the two samples come from populations with
the same means.
ii) Use the ANOVA method with a 0.05 significance level to test the same claim.
iii) Verify that the squares of the t test statistic and the critical value are equal to the F test statistic and critical
value.
equivalent.
i) Use a t test with a 0.05 significance level to test the claim that the two samples come from populations withthe same means.
ii) Use the ANOVA method with a 0.05 significance level to test the same claim.
iii) Verify that the squares of the t test statistic and the critical value are equal to the F test statistic and critical
value.
Question
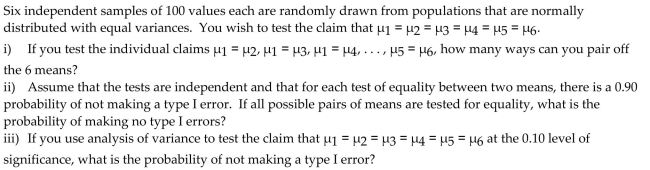
Four independent samples of 100 values each are randomly drawn from populations that are normally
distributed with equal variances. You wish to test the claim that i) If you test the individual claims
  , how many ways can you pair off
the 4 means?
ii) Assume that the tests are independent and that for each test of equality between two means, there is a 0.99
probability of not making a type I error. If all possible pairs of means are tested for equality, what is the
probability of making no type I errors?
iii) If you use analysis of variance to test the claim that at the 0.01 level of significance, what
is the probability of not making a type I error?
distributed with equal variances. You wish to test the claim that
i) If you test the individual claims , how many ways can you pair offthe 4 means?
ii) Assume that the tests are independent and that for each test of equality between two means, there is a 0.99
probability of not making a type I error. If all possible pairs of means are tested for equality, what is the
probability of making no type I errors?
iii) If you use analysis of variance to test the claim that
at the 0.01 level of significance, whatis the probability of not making a type I error?
Question
Given below are the analysis of variance results from a Minitab display. Assume that you want to use a 0.05 significance
level in testing the null hypothesis that the different samples come from populations with the same mean.
What can you conclude about the equality of the population means?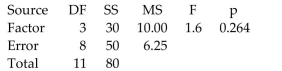
A) Accept the null hypothesis since the p-value is less than the significance level.
B) Accept the null hypothesis since the p-value is greater than the significance level.
C) Reject the null hypothesis since the p-value is less than the significance level.
D) Reject the null hypothesis since the p-value is greater than the significance level.
Question
Question
Given below are the analysis of variance results from a Minitab display. Assume that you want to use a 0.05 significance
level in testing the null hypothesis that the different samples come from populations with the same mean.
Identify the p-value.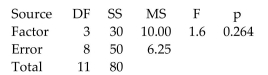
A) 0.264
B) 6.25
C) 10.00
D) 1.6
level in testing the null hypothesis that the different samples come from populations with the same mean.
Identify the p-value.
A) 0.264
B) 6.25
C) 10.00
D) 1.6
Question
A consumer magazine wants to compare the lifetimes of ballpoint pens of three different types. The magazine
takes a random sample of pens of each type in the following table.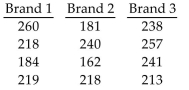 Do the data indicate that there is a difference in mean lifetime for the three brands of ballpoint pens? Use
takes a random sample of pens of each type in the following table.
Do the data indicate that there is a difference in mean lifetime for the three brands of ballpoint pens? Use Question
Given below are the analysis of variance results from a Minitab display. Assume that you want to use a 0.05 significance
level in testing the null hypothesis that the different samples come from populations with the same mean.
Find the critical value.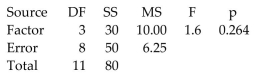
A) 8.85
B) 7.59
C) 4.07
D) 1.6
level in testing the null hypothesis that the different samples come from populations with the same mean.
Find the critical value.
A) 8.85
B) 7.59
C) 4.07
D) 1.6
Question
Fill in the missing entries in the following partially completed one-way ANOVA table. 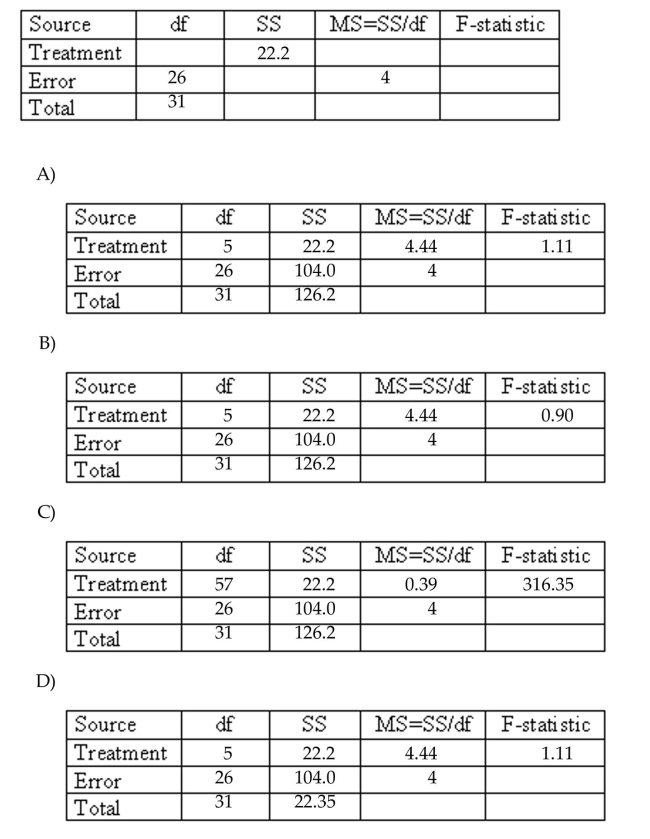
Question
At the 0.025 significance level, test the claim that the three brands have the same mean if the following sample
results have been obtained.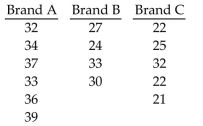
results have been obtained.
Question
Given the sample data below, test the claim that the populations have the same mean. Use a significance level of
0.05.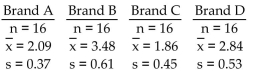
0.05.
Question
Random samples of four different models of cars were selected and the gas mileage of each car was measured.
The results are shown below.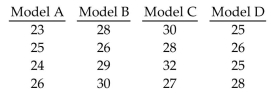 Test the claim that the four different models have the same population mean. Use a significance level of 0.05.
The results are shown below.
Test the claim that the four different models have the same population mean. Use a significance level of 0.05. Question
Fill in the missing entries in the following partially completed one-way ANOVA table. 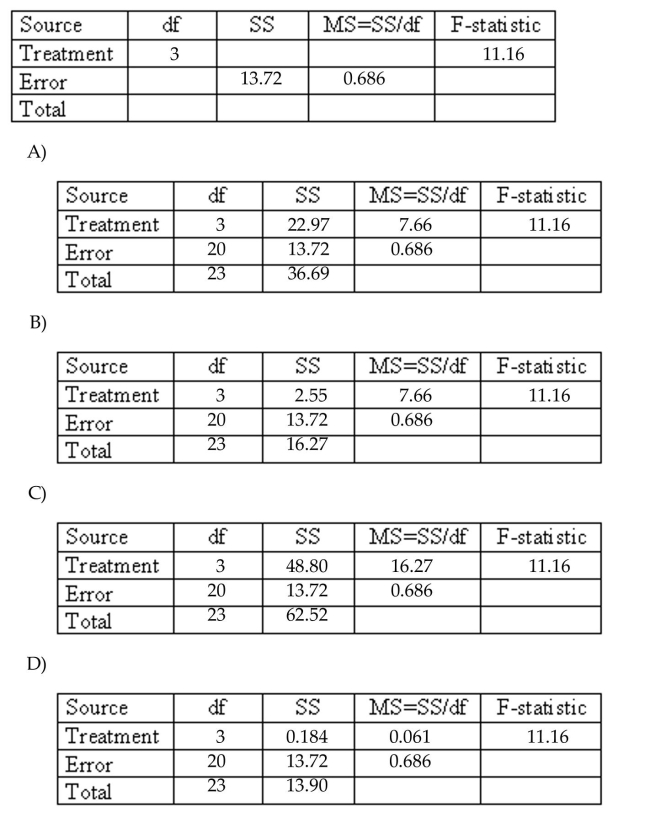
Question
At the 0.025 significance level, test the claim that the four brands have the same mean if the following sample
results have been obtained.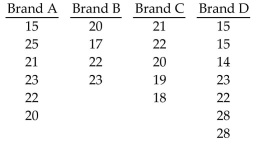
results have been obtained.
Question
At the 0.025 significance level, test the claim that the four brands have the same mean if the following sample
results have been obtained.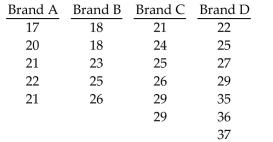
results have been obtained.
Question
Given the sample data below, test the claim that the populations have the same mean. Use a significance level of
0.05.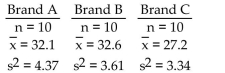
0.05.
Question
Given below are the analysis of variance results from a Minitab display. Assume that you want to use a 0.05 significance
level in testing the null hypothesis that the different samples come from populations with the same mean.
What can you conclude about the equality of the population means?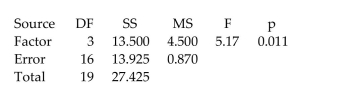
A) Reject the null hypothesis since the p-value is less than the significance level.
B) Accept the null hypothesis since the p-value is greater than the significance level.
C) Reject the null hypothesis since the p-value is greater than the significance level.
D) Accept the null hypothesis since the p-value is less than the significance level.

Unlock Deck
Sign up to unlock the cards in this deck!
Unlock Deck
Unlock Deck
1/113
Play
Full screen (f)
Deck 12: Analysis of Variance
1
Fill in the missing entries in the following partially completed one-way ANOVA table.
2
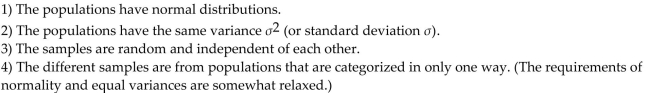
List the assumptions for testing hypotheses that three or more means are equivalent.
3
The data below represent the weight losses for people on three different exercise programs. If we want to test the claim that the three size categories have the same means, why don't we use three separate
hypothesis tests for
If we want to test the claim that the three size categories have the same means, why don't we use three separatehypothesis tests for
As we increase the number of individual tests of significance, we increase the risk of finding a difference
by chance alone. That is, the risk of a type I error is too high.
by chance alone. That is, the risk of a type I error is too high.
4
Use the data in the given table and the corresponding Minitab display to test the hypothesis. The following table
entries are test scores for males and females at different times of day. Assuming no effect from the interaction
between gender and test time, test the claim that time of day does not affect test scores. Use a 0.05 significance
level.
entries are test scores for males and females at different times of day. Assuming no effect from the interaction
between gender and test time, test the claim that time of day does not affect test scores. Use a 0.05 significance
level.
Unlock Deck
Unlock for access to all 113 flashcards in this deck.
Unlock Deck
k this deck
5
The following data contains task completion times, in minutes, categorized according to the gender of the
machine operator and the machine used. Assume that two-way ANOVA is used to analyze the data. How are the ANOVA results affected if 5 minutes is
added to each completion time?
machine operator and the machine used.
Assume that two-way ANOVA is used to analyze the data. How are the ANOVA results affected if 5 minutes isadded to each completion time?
Unlock Deck
Unlock for access to all 113 flashcards in this deck.
Unlock Deck
k this deck
6
Why do researchers concentrate on explaining an interaction in a two-way ANOVA rather than the effects of
each factor separately?
each factor separately?
Unlock Deck
Unlock for access to all 113 flashcards in this deck.
Unlock Deck
k this deck
7
Test the claim that the samples come from populations with the same mean. Assume that the populations are normally
distributed with the same variance. At the 1% significance level, does it appear that a difference exists in the true mean weight loss produced by the three
exercise programs?
distributed with the same variance.
At the 1% significance level, does it appear that a difference exists in the true mean weight loss produced by the threeexercise programs?
Unlock Deck
Unlock for access to all 113 flashcards in this deck.
Unlock Deck
k this deck
8
Unlock Deck
Unlock for access to all 113 flashcards in this deck.
Unlock Deck
k this deck
9
Use the Minitab display to test the indicated claim. A manager records the production output of three employees who
each work on three different machines for three different days. The sample results are given below and the Minitab
results follow. Using a 0.05 significance level, test the claim that the interaction between employee and machine has no effect on the
number of items produced.
each work on three different machines for three different days. The sample results are given below and the Minitab
results follow.
Using a 0.05 significance level, test the claim that the interaction between employee and machine has no effect on thenumber of items produced.
Unlock Deck
Unlock for access to all 113 flashcards in this deck.
Unlock Deck
k this deck
10
The following data contains task completion times, in minutes, categorized according to the gender of the machine
operator and the machine used. Assume that two-way ANOVA is used to analyze the data. How are the ANOVA results affected if the times are
converted to hours?
operator and the machine used.
Assume that two-way ANOVA is used to analyze the data. How are the ANOVA results affected if the times areconverted to hours?
Unlock Deck
Unlock for access to all 113 flashcards in this deck.
Unlock Deck
k this deck
11
Use the data in the given table and the corresponding Minitab display to test the hypothesis. The following table
shows the mileage for four different cars and three different brands of gas. Assuming no effect from the
interaction between car and brand of gas, test the claim that the four cars have the same mean mileage. Use a
0.05 significance level.
shows the mileage for four different cars and three different brands of gas. Assuming no effect from the
interaction between car and brand of gas, test the claim that the four cars have the same mean mileage. Use a
0.05 significance level.
Unlock Deck
Unlock for access to all 113 flashcards in this deck.
Unlock Deck
k this deck
12
Use the Minitab display to test the indicated claim. A manager records the production output of three
employees who each work on three different machines for three different days. The sample results are given
below and the Minitab results follow. Assume that the number of items produced is not affected by an interaction between employee and machine. Using a
0.05 significance level, test the claim that the machine has no effect on the number of items produced.
employees who each work on three different machines for three different days. The sample results are given
below and the Minitab results follow.
Assume that the number of items produced is not affected by an interaction between employee and machine. Using a0.05 significance level, test the claim that the machine has no effect on the number of items produced.
Unlock Deck
Unlock for access to all 113 flashcards in this deck.
Unlock Deck
k this deck
13
Test the claim that the samples come from populations with the same mean. Assume that the populations are
normally distributed with the same variance. At the 0.025 significance level, test the claim that the four brands
have the same mean if the following sample results have been obtained.
normally distributed with the same variance. At the 0.025 significance level, test the claim that the four brands
have the same mean if the following sample results have been obtained.
Unlock Deck
Unlock for access to all 113 flashcards in this deck.
Unlock Deck
k this deck
14
Draw an example of an F distribution and list the characteristics of the F distribution.
Unlock Deck
Unlock for access to all 113 flashcards in this deck.
Unlock Deck
k this deck
15
The following results are from a statistics software package in which all of the F values and P-values are given.
Is there a significant effect from the interaction? Should you test to see if there is a significant effect due to either
A or B? If the answer is yes, is there a significant effect due to either A or B?
Is there a significant effect from the interaction? Should you test to see if there is a significant effect due to either
A or B? If the answer is yes, is there a significant effect due to either A or B?
Unlock Deck
Unlock for access to all 113 flashcards in this deck.
Unlock Deck
k this deck
16
Explain the procedure for two-way analysis of variance, and how it varies depending on whether there is an
interaction between the two factors or not.
interaction between the two factors or not.
Unlock Deck
Unlock for access to all 113 flashcards in this deck.
Unlock Deck
k this deck
17
The following data contains task completion times, in minutes, categorized according to the gender of the machine
operator and the machine used. The ANOVA results lead us to conclude that the completion times are not affected by an interaction between machine
and gender, and the times are not affected by gender, but they are affected by the machine. Change the table entries so
that there is an effect from the interaction between machine and gender.
operator and the machine used.
The ANOVA results lead us to conclude that the completion times are not affected by an interaction between machineand gender, and the times are not affected by gender, but they are affected by the machine. Change the table entries so
that there is an effect from the interaction between machine and gender.
Unlock Deck
Unlock for access to all 113 flashcards in this deck.
Unlock Deck
k this deck
18
The following data contains task completion times, in minutes, categorized according to the gender of the machine
operator and the machine used. The ANOVA results lead us to conclude that the completion times are not affected by an interaction between machine
and gender, and the times are not affected by gender, but they are affected by the machine. Change the table entries so
that there is no effect from the interaction between machine and gender, but there is an effect from the gender of the
operator.
operator and the machine used.
The ANOVA results lead us to conclude that the completion times are not affected by an interaction between machineand gender, and the times are not affected by gender, but they are affected by the machine. Change the table entries so
that there is no effect from the interaction between machine and gender, but there is an effect from the gender of the
operator.
Unlock Deck
Unlock for access to all 113 flashcards in this deck.
Unlock Deck
k this deck
19
Test the claim that the samples come from populations with the same mean. Assume that the populations are
normally distributed with the same variance. At the 0.025 significance level, test the claim that the three brands
have the same mean if the following sample results have been obtained.
normally distributed with the same variance. At the 0.025 significance level, test the claim that the three brands
have the same mean if the following sample results have been obtained.
Unlock Deck
Unlock for access to all 113 flashcards in this deck.
Unlock Deck
k this deck
20
Use the data in the given table and the corresponding Minitab display to test the hypothesis. The following table
shows the mileage for four different cars and three different brands of gas. Assuming no effect from the
interaction between car and brand of gas, test the claim that the three brands of gas provide the same mean gas
mileage. Use a 0.05 significance level.
shows the mileage for four different cars and three different brands of gas. Assuming no effect from the
interaction between car and brand of gas, test the claim that the three brands of gas provide the same mean gas
mileage. Use a 0.05 significance level.
Unlock Deck
Unlock for access to all 113 flashcards in this deck.
Unlock Deck
k this deck
21
List the assumptions for testing hypotheses that three or more means are equivalent.
Unlock Deck
Unlock for access to all 113 flashcards in this deck.
Unlock Deck
k this deck
22
Why is it unnecessary to conduct multiple comparison tests after a nonsignificant F test statistic results?
Unlock Deck
Unlock for access to all 113 flashcards in this deck.
Unlock Deck
k this deck
23
Test the claim that the samples come from populations with the same mean. Assume that the populations are
normally distributed with the same variance. At the 0.025 significance level, test the claim that the four brands
have the same mean if the following sample results have been obtained.
normally distributed with the same variance. At the 0.025 significance level, test the claim that the four brands
have the same mean if the following sample results have been obtained.
Unlock Deck
Unlock for access to all 113 flashcards in this deck.
Unlock Deck
k this deck
24
The test statistics for one-way ANOVA is Describe variance within samples and
variance between samples. What relationship does variance within samples and variance between samples
would result in the conclusion that the value of F is significant?
Describe variance within samples andvariance between samples. What relationship does variance within samples and variance between samples
would result in the conclusion that the value of F is significant?
Unlock Deck
Unlock for access to all 113 flashcards in this deck.
Unlock Deck
k this deck
25
The following data shows annual income, in thousands of dollars, categorized according to the two factors of
gender and level of education. Assume that incomes are not affected by an interaction between gender and level
of education, and test the null hypothesis that level of education has no effect on income. Use a 0.05 significance
level.
gender and level of education. Assume that incomes are not affected by an interaction between gender and level
of education, and test the null hypothesis that level of education has no effect on income. Use a 0.05 significance
level.
Unlock Deck
Unlock for access to all 113 flashcards in this deck.
Unlock Deck
k this deck
26
Assume that the number of items produced is not affected by an interaction between employee and machine.
Using a 0.05 significance level, test the claim that the machine has no effect on the number of items produced. Using a 0.05 significance level, test the claim that the interaction between employee and machine has no effect on the
number of items produced.
Using a 0.05 significance level, test the claim that the machine has no effect on the number of items produced.
Using a 0.05 significance level, test the claim that the interaction between employee and machine has no effect on thenumber of items produced.
Unlock Deck
Unlock for access to all 113 flashcards in this deck.
Unlock Deck
k this deck
27
The following data shows the yield, in bushels per acre, categorized according to three varieties of corn and
three different soil conditions. Assume that yields are not affected by an interaction between variety and soil
conditions, and test the null hypothesis that variety has no effect on yield. Use a 0.05 significance level.
three different soil conditions. Assume that yields are not affected by an interaction between variety and soil
conditions, and test the null hypothesis that variety has no effect on yield. Use a 0.05 significance level.
Unlock Deck
Unlock for access to all 113 flashcards in this deck.
Unlock Deck
k this deck
28
The data below represent the weight losses for people on three diets. If we want to test the claim that the three size categories have the same means, why don't we use three separate
hypothesis tests for
If we want to test the claim that the three size categories have the same means, why don't we use three separatehypothesis tests for
Unlock Deck
Unlock for access to all 113 flashcards in this deck.
Unlock Deck
k this deck
29
Test the claim that the samples come from populations with the same mean. Assume that the populations are
normally distributed with the same variance. Given the sample data below, test the claim that the populations
have the same mean. Use a significance level of 0.05.
normally distributed with the same variance. Given the sample data below, test the claim that the populations
have the same mean. Use a significance level of 0.05.
Unlock Deck
Unlock for access to all 113 flashcards in this deck.
Unlock Deck
k this deck
30
Test the claim that the samples come from populations with the same mean. Assume that the populations are
normally distributed with the same variance. At the 0.025 significance level, test the claim that the three brands
have the same mean if the following sample results have been obtained.
normally distributed with the same variance. At the 0.025 significance level, test the claim that the three brands
have the same mean if the following sample results have been obtained.
Unlock Deck
Unlock for access to all 113 flashcards in this deck.
Unlock Deck
k this deck
31
Use the data in the given table and the corresponding Minitab display to test the hypothesis. The following
Minitab display results from a study in which three different teachers taught calculus classes of five different
sizes. The class average was recorded for each class. Assuming no effect from the interaction between teacher
and class size, test the claim that the teacher has no effect on the class average. Use a 0.05 significance level.
Minitab display results from a study in which three different teachers taught calculus classes of five different
sizes. The class average was recorded for each class. Assuming no effect from the interaction between teacher
and class size, test the claim that the teacher has no effect on the class average. Use a 0.05 significance level.
Unlock Deck
Unlock for access to all 113 flashcards in this deck.
Unlock Deck
k this deck
32
Explain the procedure for two-way analysis of variance varies depending on whether there is an interaction
between the two factors or not.
between the two factors or not.
Unlock Deck
Unlock for access to all 113 flashcards in this deck.
Unlock Deck
k this deck
33
Given below are the analysis of variance results from a Minitab display. Assume that you want to use a 0.05 significance level in testing the null hypothesis that the different samples come from populations with the same
Mean. Identify the p-value.
A) 6.25
B) 1.6
C) 10.00
D) 0.264
Mean. Identify the p-value.
A) 6.25
B) 1.6
C) 10.00
D) 0.264
Unlock Deck
Unlock for access to all 113 flashcards in this deck.
Unlock Deck
k this deck
34
Use the data in the given table and the corresponding Minitab display to test the hypothesis. The following table shows
the mileage for four different cars and three different brands of gas. Assuming no effect from the interaction between
car and brand of gas, test the claim that the four cars have the same mean mileage. Use a 0.05 significance level.
the mileage for four different cars and three different brands of gas. Assuming no effect from the interaction between
car and brand of gas, test the claim that the four cars have the same mean mileage. Use a 0.05 significance level.
Unlock Deck
Unlock for access to all 113 flashcards in this deck.
Unlock Deck
k this deck
35
Fill in the missing entries in the following partially completed one-way ANOVA table.
Unlock Deck
Unlock for access to all 113 flashcards in this deck.
Unlock Deck
k this deck
36
Test the claim that the samples come from populations with the same mean. Assume that the populations are
normally distributed with the same variance. The data below represent the weight losses for people on three
different exercise programs. At the 1% significance level, does it appear that a difference exists in the true mean weight loss produced by the three
exercise programs?
normally distributed with the same variance. The data below represent the weight losses for people on three
different exercise programs.
At the 1% significance level, does it appear that a difference exists in the true mean weight loss produced by the threeexercise programs?
Unlock Deck
Unlock for access to all 113 flashcards in this deck.
Unlock Deck
k this deck
37
Use the Minitab display to test the indicated claim. A manager records the production output of three
employees who each work on three different machines for three different days. The sample results are given
below and the Minitab results follow. Assume that the number of items produced is not affected by an interaction between employee and machine.
Using a 0.05 significance level, test the claim that the machine has no effect on the number of items produced.
employees who each work on three different machines for three different days. The sample results are given
below and the Minitab results follow.
Assume that the number of items produced is not affected by an interaction between employee and machine.Using a 0.05 significance level, test the claim that the machine has no effect on the number of items produced.
Unlock Deck
Unlock for access to all 113 flashcards in this deck.
Unlock Deck
k this deck
38
Use the Minitab display to test the indicated claim. A manager records the production output of three
employees who each work on three different machines for three different days. The sample results are given
below and the Minitab results follow. Assume that the number of items produced is not affected by an interaction between employee and machine. Using a
0.05 significance level, test the claim that the choice of employee has no effect on the number of items produced.
employees who each work on three different machines for three different days. The sample results are given
below and the Minitab results follow.
Assume that the number of items produced is not affected by an interaction between employee and machine. Using a0.05 significance level, test the claim that the choice of employee has no effect on the number of items produced.
Unlock Deck
Unlock for access to all 113 flashcards in this deck.
Unlock Deck
k this deck
39
Why do researchers concentrate on explaining an interaction in a two-way ANOVA rather than the effects of
each factor separately?
each factor separately?
Unlock Deck
Unlock for access to all 113 flashcards in this deck.
Unlock Deck
k this deck
40
Unlock Deck
Unlock for access to all 113 flashcards in this deck.
Unlock Deck
k this deck
41
The data below represent the weight losses for people on three different exercise programs. If we want to test the claim that the three size categories have the same means, why don't we use three separate hypothesis tests for ?
A) Actually, we do want to use three separate hypothesis tests.
B) The risk of type II error increases and becomes too high.
C) A hypothesis test for comparing two means does not exist.
D) The risk of type I error increases and becomes too high.
If we want to test the claim that the three size categories have the same means, why don't we use three separate hypothesis tests for ?A) Actually, we do want to use three separate hypothesis tests.
B) The risk of type II error increases and becomes too high.
C) A hypothesis test for comparing two means does not exist.
D) The risk of type I error increases and becomes too high.
Unlock Deck
Unlock for access to all 113 flashcards in this deck.
Unlock Deck
k this deck
42
ANOVA requires usage of the ________ distribution.
A) F
B) normal
C) t
D) chi-square
A) F
B) normal
C) t
D) chi-square
Unlock Deck
Unlock for access to all 113 flashcards in this deck.
Unlock Deck
k this deck
43
Given below are the analysis of variance results from a Minitab display. Assume that you want to use a 0.05 significance
level in testing the null hypothesis that the different samples come from populations with the same mean.
Identify the value of the test statistic.
A) 5.17
B) 4.500
C) 13.500
D) 0.011
level in testing the null hypothesis that the different samples come from populations with the same mean.
Identify the value of the test statistic.
A) 5.17
B) 4.500
C) 13.500
D) 0.011
Unlock Deck
Unlock for access to all 113 flashcards in this deck.
Unlock Deck
k this deck
44
Use the Minitab display to test the indicated claim. A manager records the production output of three employees who each work on three different machines for three different days. The sample results are given
Below and the Minitab results follow. Using a 0.05 significance level, test the claim that the interaction between employee and machine has no effect on the
Number of items produced. State your conclusion about the null hypothesis and the claim.
A) Fail to reject the null hypothesis. There appears to be an interaction effect.
B) Fail to reject the null hypothesis. There does not appear to be an interaction effect.
C) Reject the null hypothesis. There appears to be an interaction effect.
D) Reject the null hypothesis. There does not appear to be an interaction effect.
Below and the Minitab results follow.
Using a 0.05 significance level, test the claim that the interaction between employee and machine has no effect on theNumber of items produced. State your conclusion about the null hypothesis and the claim.
A) Fail to reject the null hypothesis. There appears to be an interaction effect.
B) Fail to reject the null hypothesis. There does not appear to be an interaction effect.
C) Reject the null hypothesis. There appears to be an interaction effect.
D) Reject the null hypothesis. There does not appear to be an interaction effect.
Unlock Deck
Unlock for access to all 113 flashcards in this deck.
Unlock Deck
k this deck
45
Given below are the analysis of variance results from a Minitab display. Assume that you want to use a 0.05 significance level in testing the null hypothesis that the different samples come from populations with the same
Mean. Identify the P-value.
A) 0.011
B) 0.870
C) 5.17
D) 4.500
Mean. Identify the P-value.
A) 0.011
B) 0.870
C) 5.17
D) 4.500
Unlock Deck
Unlock for access to all 113 flashcards in this deck.
Unlock Deck
k this deck
46
At the same time each day, a researcher records the temperature in each of three greenhouses. The table shows the temperatures in degrees Fahrenheit recorded for one week. What type of test would you use to test the claim that the average temperature is the same in each greenhouse at a 0.05
Significance level?
A) Two-way ANOVA
B) Test of Independence
C) One-way ANOVA
D) Goodness-of-Fit
What type of test would you use to test the claim that the average temperature is the same in each greenhouse at a 0.05Significance level?
A) Two-way ANOVA
B) Test of Independence
C) One-way ANOVA
D) Goodness-of-Fit
Unlock Deck
Unlock for access to all 113 flashcards in this deck.
Unlock Deck
k this deck
47
Given below are the analysis of variance results from a Minitab display. Assume that you want to use a 0.05 significance level in testing the null hypothesis that the different samples come from populations with the same
Mean. Identify the P-value.
A) 10.00
B) 0.264
C) 1.6
D) 6.25
Mean. Identify the P-value.
A) 10.00
B) 0.264
C) 1.6
D) 6.25
Unlock Deck
Unlock for access to all 113 flashcards in this deck.
Unlock Deck
k this deck
48
There is a(n) ________ between two factors if the effect of one of the factors changes for different categories of the other factor.
A) variation
B) interaction
C) transformation
D) category effect
A) variation
B) interaction
C) transformation
D) category effect
Unlock Deck
Unlock for access to all 113 flashcards in this deck.
Unlock Deck
k this deck
49
Unlock Deck
Unlock for access to all 113 flashcards in this deck.
Unlock Deck
k this deck
50
Given below are the analysis of variance results from a Minitab display. Assume that you want to use a 0.05 significance
level in testing the null hypothesis that the different samples come from populations with the same mean.
Find the critical value.
A) 5.42
B) 3.24
C) 3.06
D) 8.70
level in testing the null hypothesis that the different samples come from populations with the same mean.
Find the critical value.
A) 5.42
B) 3.24
C) 3.06
D) 8.70
Unlock Deck
Unlock for access to all 113 flashcards in this deck.
Unlock Deck
k this deck
51
One way analysis of variance is used to test for ________.
A) equality of three of more population variances
B) equality of three or more population means
C) equality of three or more sample means
D) equality of three or more population proportions
A) equality of three of more population variances
B) equality of three or more population means
C) equality of three or more sample means
D) equality of three or more population proportions
Unlock Deck
Unlock for access to all 113 flashcards in this deck.
Unlock Deck
k this deck
52
Identify the value of the test statistic.
A) 10.00
B) 30
C) 0.264
D) 1.6
A) 10.00
B) 30
C) 0.264
D) 1.6
Unlock Deck
Unlock for access to all 113 flashcards in this deck.
Unlock Deck
k this deck
53
Given below are the analysis of variance results from a Minitab display. Assume that you want to use a 0.05 significance level in testing the null hypothesis that the different samples come from populations with the same
Mean. What can you conclude about the equality of the population means?
A) Accept the null hypothesis since the P-value is greater than the significance level.
B) Reject the null hypothesis since the P-value is greater than the significance level.
C) Accept the null hypothesis since the P-value is less than the significance level.
D) Reject the null hypothesis since the P-value is less than the significance level.
Unlock Deck
Unlock for access to all 113 flashcards in this deck.
Unlock Deck
k this deck
54
Given below are the analysis of variance results from a Minitab display. Assume that you want to use a 0.05 significance level in testing the null hypothesis that the different samples come from populations with the same
Mean. Find the critical value.
A) 1.6
B) 4.07
C) 8.85
D) 7.59
Mean. Find the critical value.
A) 1.6
B) 4.07
C) 8.85
D) 7.59
Unlock Deck
Unlock for access to all 113 flashcards in this deck.
Unlock Deck
k this deck
55
Select an appropriate null hypothesis for a one way analysis of variance test.
Unlock Deck
Unlock for access to all 113 flashcards in this deck.
Unlock Deck
k this deck
56
At the same time each day, a researcher records the temperature in each of three classrooms. The table shows the temperatures in degrees Fahrenheit recorded for one week. How are the analysis of variance results affected if the same constant is added to every one of the original sample
Values?
A) The test statistic is divided by the value of the constant.
B) The test statistic increases by a factor of the constant.
C) The test statistic increases by the value of the constant.
D) The results are not affected.
How are the analysis of variance results affected if the same constant is added to every one of the original sampleValues?
A) The test statistic is divided by the value of the constant.
B) The test statistic increases by a factor of the constant.
C) The test statistic increases by the value of the constant.
D) The results are not affected.
Unlock Deck
Unlock for access to all 113 flashcards in this deck.
Unlock Deck
k this deck
57
Given below are the analysis of variance results from a Minitab display. Assume that you want to use a 0.05 significance
level in testing the null hypothesis that the different samples come from populations with the same mean.
Identify the p-value.
A) 5.17
B) 0.870
C) 4.500
D) 0.011
level in testing the null hypothesis that the different samples come from populations with the same mean.
Identify the p-value.
A) 5.17
B) 0.870
C) 4.500
D) 0.011
Unlock Deck
Unlock for access to all 113 flashcards in this deck.
Unlock Deck
k this deck
58
Select a property of the F distribution.
A) The exact shape of the F distribution depends on two different degrees of freedom.
B) The total area under the curve is equal to 2.
C) Values of the F distribution can be negative.
D) It is symmetric.
A) The exact shape of the F distribution depends on two different degrees of freedom.
B) The total area under the curve is equal to 2.
C) Values of the F distribution can be negative.
D) It is symmetric.
Unlock Deck
Unlock for access to all 113 flashcards in this deck.
Unlock Deck
k this deck
59
Use the Minitab display to test the indicated claim. A manager records the production output of three employees who each work on three different machines for three different days. The sample results are given
Below and the Minitab results follow. Assume that the number of items produced is not affected by an interaction between employee and machine. Using a
0)05 significance level, test the claim that the choice of employee has no effect on the number of items produced. What is
The value of the test statistic, F?
A) F = 0.1898
B) F = 5.2692
C) F = 0.2687
D) F = 53.7172
Below and the Minitab results follow.
Assume that the number of items produced is not affected by an interaction between employee and machine. Using a0)05 significance level, test the claim that the choice of employee has no effect on the number of items produced. What is
The value of the test statistic, F?
A) F = 0.1898
B) F = 5.2692
C) F = 0.2687
D) F = 53.7172
Unlock Deck
Unlock for access to all 113 flashcards in this deck.
Unlock Deck
k this deck
60
Given below are the analysis of variance results from a Minitab display. Assume that you want to use a 0.05 significance level in testing the null hypothesis that the different samples come from populations with the same
Mean. Identify the value of the test statistic.
A) 5.17
B) 0.011
C) 4.500
D) 13.500
Mean. Identify the value of the test statistic.
A) 5.17
B) 0.011
C) 4.500
D) 13.500
Unlock Deck
Unlock for access to all 113 flashcards in this deck.
Unlock Deck
k this deck
61
Given below are the analysis of variance results from a Minitab display. Assume that you want to use a 0.05 significance
level in testing the null hypothesis that the different samples come from populations with the same mean.
Identify the value of the test statistic.
A) 30
B) 0.264
C) 1.6
D) 10.00
level in testing the null hypothesis that the different samples come from populations with the same mean.
Identify the value of the test statistic.
A) 30
B) 0.264
C) 1.6
D) 10.00
Unlock Deck
Unlock for access to all 113 flashcards in this deck.
Unlock Deck
k this deck
62
At the same time each day, a researcher records the temperature in each of three greenhouses. The table shows
the temperatures in degrees Fahrenheit recorded for one week. i) Use a 0.05 significance level to test the claim that the average temperature is the same in each greenhouse.
ii) How are the analysis of variance results affected if the same constant is added to every one of the original
sample values?
the temperatures in degrees Fahrenheit recorded for one week.
i) Use a 0.05 significance level to test the claim that the average temperature is the same in each greenhouse.ii) How are the analysis of variance results affected if the same constant is added to every one of the original
sample values?
Unlock Deck
Unlock for access to all 113 flashcards in this deck.
Unlock Deck
k this deck
63
The data below represent the weight losses for people on three different exercise programs. At the 1% significance level, does it appear that a difference exists in the true mean weight loss produced by the
three exercise programs?
At the 1% significance level, does it appear that a difference exists in the true mean weight loss produced by thethree exercise programs?
Unlock Deck
Unlock for access to all 113 flashcards in this deck.
Unlock Deck
k this deck
64
Use the data given below to verify that the t test for independent samples and the ANOVA method are
equivalent. i) Use a t test with a 0.05 significance level to test the claim that the two samples come from populations with
the same means.
ii) Use the ANOVA method with a 0.05 significance level to test the same claim.
iii) Verify that the squares of the t test statistic and the critical value are equal to the F test statistic and critical
value.
equivalent.
i) Use a t test with a 0.05 significance level to test the claim that the two samples come from populations withthe same means.
ii) Use the ANOVA method with a 0.05 significance level to test the same claim.
iii) Verify that the squares of the t test statistic and the critical value are equal to the F test statistic and critical
value.
Unlock Deck
Unlock for access to all 113 flashcards in this deck.
Unlock Deck
k this deck
65
Use the data given below to verify that the t test for independent samples and the ANOVA method are
equivalent. i) Use a t test with a 0.05 significance level to test the claim that the two samples come from populations with
the same means.
ii) Use the ANOVA method with a 0.05 significance level to test the same claim.
iii) Verify that the squares of the t test statistic and the critical value are equal to the F test statistic and critical
value.
equivalent.
i) Use a t test with a 0.05 significance level to test the claim that the two samples come from populations withthe same means.
ii) Use the ANOVA method with a 0.05 significance level to test the same claim.
iii) Verify that the squares of the t test statistic and the critical value are equal to the F test statistic and critical
value.
Unlock Deck
Unlock for access to all 113 flashcards in this deck.
Unlock Deck
k this deck
66
Four independent samples of 100 values each are randomly drawn from populations that are normally
distributed with equal variances. You wish to test the claim that i) If you test the individual claims , how many ways can you pair off
the 4 means?
ii) Assume that the tests are independent and that for each test of equality between two means, there is a 0.99
probability of not making a type I error. If all possible pairs of means are tested for equality, what is the
probability of making no type I errors?
iii) If you use analysis of variance to test the claim that at the 0.01 level of significance, what
is the probability of not making a type I error?
distributed with equal variances. You wish to test the claim that
i) If you test the individual claims , how many ways can you pair offthe 4 means?
ii) Assume that the tests are independent and that for each test of equality between two means, there is a 0.99
probability of not making a type I error. If all possible pairs of means are tested for equality, what is the
probability of making no type I errors?
iii) If you use analysis of variance to test the claim that
at the 0.01 level of significance, whatis the probability of not making a type I error?
Unlock Deck
Unlock for access to all 113 flashcards in this deck.
Unlock Deck
k this deck
67
Given below are the analysis of variance results from a Minitab display. Assume that you want to use a 0.05 significance
level in testing the null hypothesis that the different samples come from populations with the same mean.
What can you conclude about the equality of the population means?
A) Accept the null hypothesis since the p-value is less than the significance level.
B) Accept the null hypothesis since the p-value is greater than the significance level.
C) Reject the null hypothesis since the p-value is less than the significance level.
D) Reject the null hypothesis since the p-value is greater than the significance level.
Unlock Deck
Unlock for access to all 113 flashcards in this deck.
Unlock Deck
k this deck
68
Unlock Deck
Unlock for access to all 113 flashcards in this deck.
Unlock Deck
k this deck
69
Given below are the analysis of variance results from a Minitab display. Assume that you want to use a 0.05 significance
level in testing the null hypothesis that the different samples come from populations with the same mean.
Identify the p-value.
A) 0.264
B) 6.25
C) 10.00
D) 1.6
level in testing the null hypothesis that the different samples come from populations with the same mean.
Identify the p-value.
A) 0.264
B) 6.25
C) 10.00
D) 1.6
Unlock Deck
Unlock for access to all 113 flashcards in this deck.
Unlock Deck
k this deck
70
A consumer magazine wants to compare the lifetimes of ballpoint pens of three different types. The magazine
takes a random sample of pens of each type in the following table. Do the data indicate that there is a difference in mean lifetime for the three brands of ballpoint pens? Use
takes a random sample of pens of each type in the following table.
Do the data indicate that there is a difference in mean lifetime for the three brands of ballpoint pens? Use Unlock Deck
Unlock for access to all 113 flashcards in this deck.
Unlock Deck
k this deck
71
Given below are the analysis of variance results from a Minitab display. Assume that you want to use a 0.05 significance
level in testing the null hypothesis that the different samples come from populations with the same mean.
Find the critical value.
A) 8.85
B) 7.59
C) 4.07
D) 1.6
level in testing the null hypothesis that the different samples come from populations with the same mean.
Find the critical value.
A) 8.85
B) 7.59
C) 4.07
D) 1.6
Unlock Deck
Unlock for access to all 113 flashcards in this deck.
Unlock Deck
k this deck
72
Fill in the missing entries in the following partially completed one-way ANOVA table.
Unlock Deck
Unlock for access to all 113 flashcards in this deck.
Unlock Deck
k this deck
73
At the 0.025 significance level, test the claim that the three brands have the same mean if the following sample
results have been obtained.
results have been obtained.
Unlock Deck
Unlock for access to all 113 flashcards in this deck.
Unlock Deck
k this deck
74
Given the sample data below, test the claim that the populations have the same mean. Use a significance level of
0.05.
0.05.
Unlock Deck
Unlock for access to all 113 flashcards in this deck.
Unlock Deck
k this deck
75
Random samples of four different models of cars were selected and the gas mileage of each car was measured.
The results are shown below. Test the claim that the four different models have the same population mean. Use a significance level of 0.05.
The results are shown below.
Test the claim that the four different models have the same population mean. Use a significance level of 0.05. Unlock Deck
Unlock for access to all 113 flashcards in this deck.
Unlock Deck
k this deck
76
Fill in the missing entries in the following partially completed one-way ANOVA table.
Unlock Deck
Unlock for access to all 113 flashcards in this deck.
Unlock Deck
k this deck
77
At the 0.025 significance level, test the claim that the four brands have the same mean if the following sample
results have been obtained.
results have been obtained.
Unlock Deck
Unlock for access to all 113 flashcards in this deck.
Unlock Deck
k this deck
78
At the 0.025 significance level, test the claim that the four brands have the same mean if the following sample
results have been obtained.
results have been obtained.
Unlock Deck
Unlock for access to all 113 flashcards in this deck.
Unlock Deck
k this deck
79
Given the sample data below, test the claim that the populations have the same mean. Use a significance level of
0.05.
0.05.
Unlock Deck
Unlock for access to all 113 flashcards in this deck.
Unlock Deck
k this deck
80
Given below are the analysis of variance results from a Minitab display. Assume that you want to use a 0.05 significance
level in testing the null hypothesis that the different samples come from populations with the same mean.
What can you conclude about the equality of the population means?
A) Reject the null hypothesis since the p-value is less than the significance level.
B) Accept the null hypothesis since the p-value is greater than the significance level.
C) Reject the null hypothesis since the p-value is greater than the significance level.
D) Accept the null hypothesis since the p-value is less than the significance level.
Unlock Deck
Unlock for access to all 113 flashcards in this deck.
Unlock Deck
k this deck
Unlock Deck
Unlock for access to all 113 flashcards in this deck.


