Deck 3: Describing, Exploring, and Comparing Data
Full screen (f)
Question
Question
Question
When finding percentiles, if the locator L is not a whole number, one procedure is to interpolate so that a locator of 23.75, for example, leads to a value that is 3/4 of the way between the 23rd and 24th scores. Use this method
Of interpolation to find P75 for the set of test scores below.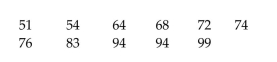
A) 88.5
B) 94
C) 83
D) 85.75
Of interpolation to find P75 for the set of test scores below.
A) 88.5
B) 94
C) 83
D) 85.75
Question
Find the variance for the given data. Round your answer to one more decimal place than the original data. To get the best deal on a microwave oven, Jeremy called six appliance stores and asked the cost of a specific model. The prices he
Was quoted are listed below: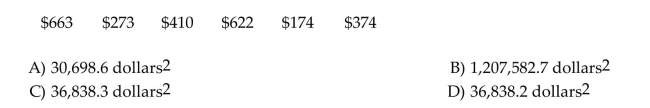
Was quoted are listed below:
Question
Question
Find the standard deviation for the given sample data. Round your answer to one more decimal place than is present in the original data. 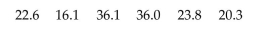
A) 4347.7
B) 36.1
C) 3999.0
D) 8.35
A) 4347.7
B) 36.1
C) 3999.0
D) 8.35
Question
Question
The test scores of 40 students are listed below. Find P56. 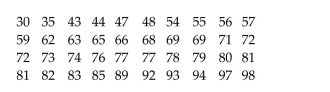
A) 73.5
B) 73
C) 74
D) 22.4
A) 73.5
B) 73
C) 74
D) 22.4
Question
Human body temperatures have a mean of 98.20° F and a standard deviation of 0.62° F. Sally's temperature can be described by z = -1.5. What is her temperature? Round your answer to the nearest hundredth. 
Question
Find the standard deviation for the given sample data. Round your answer to one more decimal place than the original data. 
A) 8.35
B) 4347.7
C) 3999.0
D) 36.1
A) 8.35
B) 4347.7
C) 3999.0
D) 36.1
Question
Find the variance for the given sample data. Round your answer to one more decimal place than the original data. 
A) 11.8
B) 6.2
C) 7.7
D) 7.8
A) 11.8
B) 6.2
C) 7.7
D) 7.8
Question
Question
Find the standard deviation for the given sample data. Round your answer to one more decimal place than the original data. 
A) 5.8
B) 1.6
C) 5.1
D) 5.4
A) 5.8
B) 1.6
C) 5.1
D) 5.4
Question
The customer service department of a phone company is experimenting with two different systems. On Monday they try the first system which is based on an automated menu system. On Tuesday they try the second
System in which each caller is immediately connected with a live agent. A quality control manager selects a
Sample of seven calls each day. He records the time for each customer to have his or her question answered. The
Times (in minutes) are listed below. Find the coefficient of variation for each of the two sets of data, then compare the
Variation. Round results to one decimal place.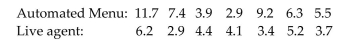
A) Automated Menu: 47.1% Live agent: 27.3% There is substantially more variation in the times for the automated menu system.
B) Automated Menu: 45.4% Live agent: 26.3% There is substantially more variation in the times for the automated menu system.
C) Automated Menu: 48.8% Live agent: 28.3% There is substantially more variation in the times for the automated menu system.
D) Automated Menu: 25.2% Live agent: 41.5% There is substantially more variation in the times for the live agent.
Question
Listed below are the amounts of time (in months) that the employees of a restaurant have been working at the restaurant. Find the mean for the given sample data. Round your answer to one more decimal place than the original
Data values.
A) 52.9 months
B) 56.7 months
C) 61.1 months
D) 31.5 months
Data values.
A) 52.9 months
B) 56.7 months
C) 61.1 months
D) 31.5 months
Question
Question
The number of vehicles passing through a bank drive -up line during each 15-minute period was recorded. The results are shown below. Find the median number of vehicles going through the line in a 15-minute period. 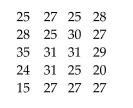
A) 26.85 vehicles
B) 27 vehicles
C) 28 vehicles
D) 31 vehicles
A) 26.85 vehicles
B) 27 vehicles
C) 28 vehicles
D) 31 vehicles
Question
A store manager kept track of the number of newspapers sold each week over a seven-week period. The results are shown below. 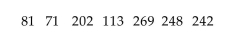 Find the median number of newspapers sold.
A) 202 newspapers
B) 242 newspapers
C) 113 newspapers
D) 175 newspapers
Find the median number of newspapers sold.A) 202 newspapers
B) 242 newspapers
C) 113 newspapers
D) 175 newspapers
Question
Construct a boxplot for the given data. Include values of the 5-number summary in all boxplots. The test scores of 40 students are listed below. 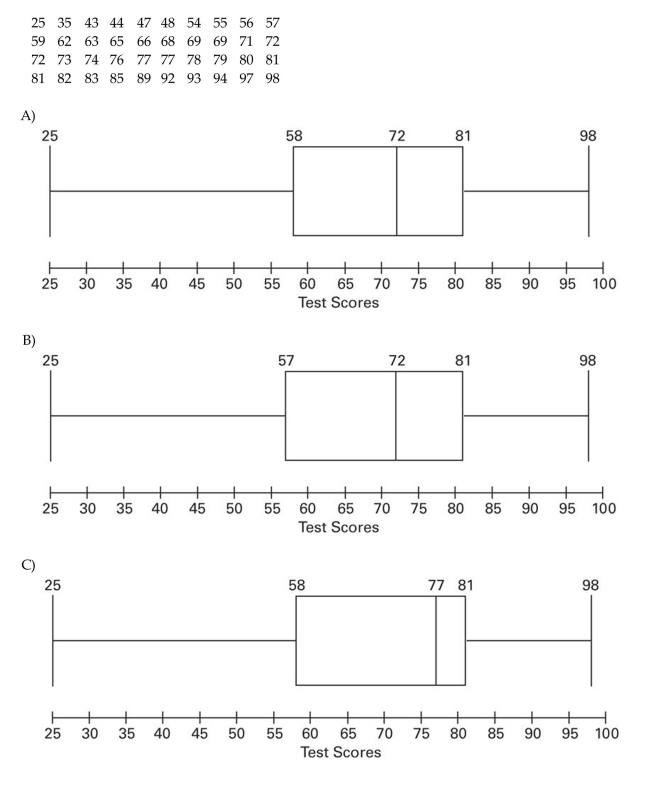
Question
The prices (in dollars) of 12 electric smooth top ranges are listed below. Find the range for the given sample data. 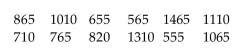
A) $900
B) $910
C) $920
D) $930
A) $900
B) $910
C) $920
D) $930
Question
Jorge has his own business as a painter. The amounts he made in the last five months are shown below: 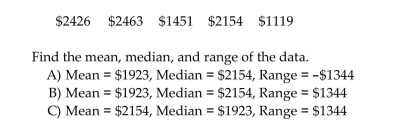
Question
Question
If your score on your next statistics test is converted to a z score, which of these z scores would you prefer? Explain
your answer.
your answer.
Question
Question
The owner of a manufacturing plant employs eighty people. As part of their personnel file, she asked each one to record to the nearest one-tenth of a mile the distance they travel one way from home to work. The distances for a
Random sample of six employees are listed below: Find the variance for the given data.
Random sample of six employees are listed below:
Find the variance for the given data. Question
A company had 80 employees whose salaries are summarized in the frequency distribution below. Find the standard deviation. 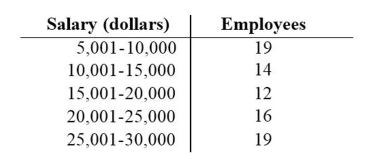
A) $8195.1
B) $8422.8
C) $7588.1
D) $7967.5
A) $8195.1
B) $8422.8
C) $7588.1
D) $7967.5
Question
Question
Question
Question
Question
Question
Find the variance for the given sample data. Round your answer to one more decimal place than the original data. 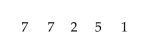
A) 6.2
B) 11.8
C) 7.7
D) 7.8
A) 6.2
B) 11.8
C) 7.7
D) 7.8
Question
Question
Listed below are the systolic blood pressures (in mm Hg) for a sample of men aged 20-29 years and for a sample of men aged 60-69 years. 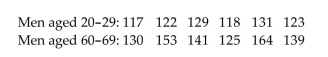 Find the coefficient of variation for each of the two sets of data, then compare the variation. Round results to one
Decimal place.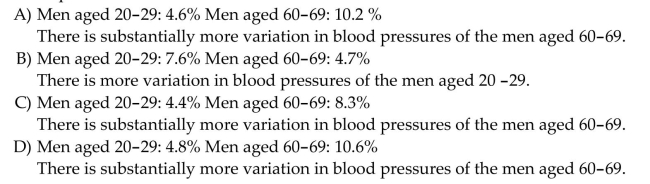
Find the coefficient of variation for each of the two sets of data, then compare the variation. Round results to oneDecimal place.
Question
Question
Question
The race speeds (in minutes) for the top eight cars in a 200-mile race are listed below. Use the range rule of thumb to estimate the standard deviation. Round results to the nearest tenth. 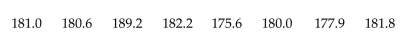
A) 7.5 minutes
B) 6.8 minutes
C) 3.4 minutes
D) 1.1 minutes
A) 7.5 minutes
B) 6.8 minutes
C) 3.4 minutes
D) 1.1 minutes
Question
The local Tupperware dealers earned these commissions last month: 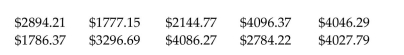 What was the mean commission earned? Round your answer to the nearest cent.
A) $3437.79
B) $3094.01
C) $3867.52
D) $3088.01
What was the mean commission earned? Round your answer to the nearest cent.A) $3437.79
B) $3094.01
C) $3867.52
D) $3088.01
Question
The test scores of 40 students are listed below. Find P85. 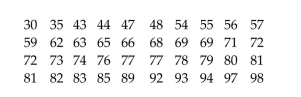
A) 85
B) 87
C) 34
D) 89
A) 85
B) 87
C) 34
D) 89
Question
Last year, nine employees of an electronics company retired. Their ages (in years) at retirement are listed below. Find the mode(s) for the given sample data. 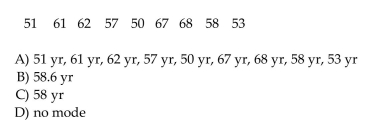
Question
Use the following duration times (seconds) of 24 eruptions of the Old Faithful geyser in Yellowstone National Park. The
duration times are sorted from lowest to highest.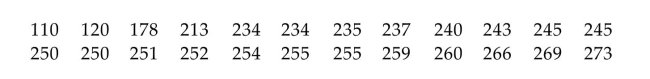 Describe how to calculate the limits to determine outliers for this data set? Identify any outliers.
duration times are sorted from lowest to highest.
Describe how to calculate the limits to determine outliers for this data set? Identify any outliers. Question
Question
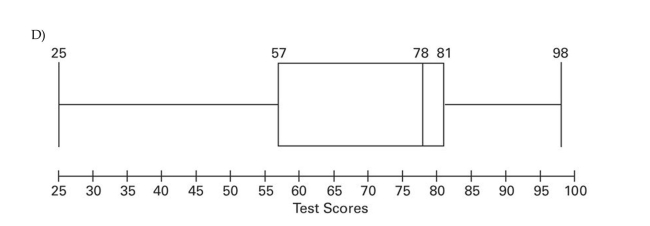
Describe any similarities or differences in the two distributions represented by the following boxplots. Assume
the two boxplots have the same scale.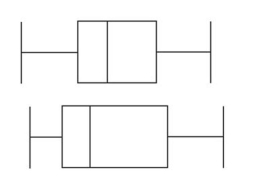
the two boxplots have the same scale.
Question
Listed below are the arrival delay times (in minutes) of randomly selected flights between New York's JFK
airport to Los Angeles (LAX). Negative values correspond to flights that arrive before their schedule time and
positive values represent delays. Calculate the range of the data and the standard deviation. Can the standard
deviation be negative?
airport to Los Angeles (LAX). Negative values correspond to flights that arrive before their schedule time and
positive values represent delays. Calculate the range of the data and the standard deviation. Can the standard
deviation be negative?
Question
Question
Question
Andrew asked seven of his friends how many cousins they had. The results are listed below. Find the mean number of cousins. 
A) 10.1 cousins
B) 10 cousins
C) 8.6 cousins
D) 8.1 cousins
A) 10.1 cousins
B) 10 cousins
C) 8.6 cousins
D) 8.1 cousins
Question
The following are interval times (minutes) between eruptions of the Old Faithful geyser in Yellowstone
National Park (based on U.S. National Park Service data). Identify the five number summary and construct a boxplot of these data.
National Park (based on U.S. National Park Service data).
Identify the five number summary and construct a boxplot of these data. Question
The weights (in pounds) of six dogs are listed below. Find the mean weight. 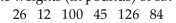
A) 78.6 lb
B) 65.5 lb
C) 65 lb
D) 66 lb
A) 78.6 lb
B) 65.5 lb
C) 65 lb
D) 66 lb
Question
Question
Question
Use the following duration times (seconds) of 24 eruptions of the Old Faithful geyser in Yellowstone National Park. The
duration times are sorted from lowest to highest.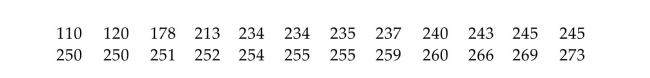
 here
here
duration times are sorted from lowest to highest.
here Question
A comparison is made between summer electric bills of those who have central air and those who have window
units. Find the mean and median for each of the two samples, then compare the two sets of results.
units. Find the mean and median for each of the two samples, then compare the two sets of results.
Question
Question
Question
An engineer is designing a machine to manufacture gloves and she obtains the following sample of hand
lengths (mm) of randomly selected adult males based on data gathered: Define this data set as discrete or continuous. The hand lengths is what type of level of measurement? Compare the
mean and median for this data set and if you can draw any conclusions from these values.
lengths (mm) of randomly selected adult males based on data gathered:
Define this data set as discrete or continuous. The hand lengths is what type of level of measurement? Compare themean and median for this data set and if you can draw any conclusions from these values.
Question
The table below provides a frequency distribution for the winner of the Davis Cup Tennis Competition during
the period 1977-1994.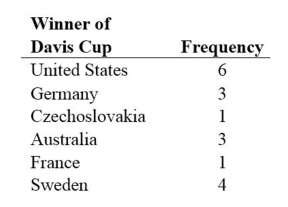 Which measure of center, the mean, the median, or the mode is most appropriate here? Why?
the period 1977-1994.
Which measure of center, the mean, the median, or the mode is most appropriate here? Why? Question
Describe any similarities or differences in the two distributions represented by the following boxplots. Assume the two
boxplots have the same scale.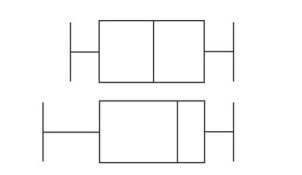
boxplots have the same scale.
Question
Question
Question
Find the median for the given sample data.
The temperatures (in degrees Fahrenheit) in 7 different cities on New Year's Day are listed below. Find the median temperature.
A) 64°F
B) 51°F
C) 53°F
D) 31°F
The temperatures (in degrees Fahrenheit) in 7 different cities on New Year's Day are listed below.
Find the median temperature.A) 64°F
B) 51°F
C) 53°F
D) 31°F
Question
Six college buddies bought each other Christmas gifts. They amounts they spent are shown below. 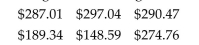 What was the mean amount spent? Round your answer to the nearest cent.
A) $247.87
B) $285.44
C) $297.44
D) $371.80
What was the mean amount spent? Round your answer to the nearest cent.A) $247.87
B) $285.44
C) $297.44
D) $371.80
Question
The normal monthly precipitation (in inches) for August is listed for 20 different U.S. cities. Find the mean monthly precipitation. 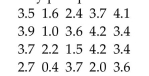
A) 3.27 in.
B) 2.80 in.
C) 3.09 in.
D) 2.94 in.
A) 3.27 in.
B) 2.80 in.
C) 3.09 in.
D) 2.94 in.
Question
Find the median for the given sample data.
The ages (in years) of the eight passengers on a bus are listed below. Find the median age.
A) 24.5 yr
B) 29 yr
C) 25.5 yr
D) 22 yr
The ages (in years) of the eight passengers on a bus are listed below.
Find the median age.A) 24.5 yr
B) 29 yr
C) 25.5 yr
D) 22 yr
Question
Find the median for the given sample data.
The weights (in ounces) of 21 cookies are shown. Find the median weight.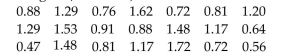
A) 0.64 oz
B) 0.91 oz
C) 1.29 oz
D) 0.78 oz
The weights (in ounces) of 21 cookies are shown. Find the median weight.
A) 0.64 oz
B) 0.91 oz
C) 1.29 oz
D) 0.78 oz
Question
The students in Hugh Logan's math class took the Scholastic Aptitude Test. Their math scores are shown below. Find the mean score. 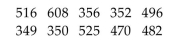
A) 459.6
B) 450.4
C) 476.0
D) 441.6
A) 459.6
B) 450.4
C) 476.0
D) 441.6
Question
Find the mode(s) for the given sample data.

Question
Listed below are the amounts of weight change (in pounds) for 12 women during their first year of work after graduating from college. Positive values correspond to women who gained weight and negative values
Correspond to women who lost weight. What is the mean weight change?
A) 3 lb
B) 8 lb
C) 2.8 lb
D) 3.1 lb
Correspond to women who lost weight. What is the mean weight change?
A) 3 lb
B) 8 lb
C) 2.8 lb
D) 3.1 lb
Question
Find the median for the given sample data.
The distances (in miles) driven in the past week by each of a company's sales representatives are listed below.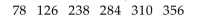 Find the median distance driven.
A) 238 mi
B) 284 mi
C) 198.50 mi
D) 261 mi
The distances (in miles) driven in the past week by each of a company's sales representatives are listed below.
Find the median distance driven.A) 238 mi
B) 284 mi
C) 198.50 mi
D) 261 mi
Question
Find the median for the given sample data.
Listed below are the amounts of weight change (in pounds) for 12 women during their first year of work after graduating from college. Positive values correspond to women who gained weight and negative values
Correspond to women who lost weight. What is the median weight change?
A) 3.6 lb
B) 4 lb
C) 3.9 lb
D) 3 lb
Question
Find the median for the given sample data.
A store manager kept track of the number of newspapers sold each week over a seven-week period. The results are shown below. Find the median number of newspapers sold.
A) 175 newspapers
B) 113 newspapers
C) 242 newspapers
D) 202 newspapers
A store manager kept track of the number of newspapers sold each week over a seven-week period. The results are shown below.
Find the median number of newspapers sold.A) 175 newspapers
B) 113 newspapers
C) 242 newspapers
D) 202 newspapers
Question
Find the median for the given sample data.
Listed below are the amounts of time (in months) that the employees of a restaurant have been working at the restaurant. Find the median.
A) 26.5 months
B) 19 months
C) 60.1 months
D) 55.8 months
Listed below are the amounts of time (in months) that the employees of a restaurant have been working at the restaurant. Find the median.
A) 26.5 months
B) 19 months
C) 60.1 months
D) 55.8 months
Question
Find the median for the given sample data.
The normal monthly precipitation (in inches) for August is listed for 20 different U.S. cities. Find the median of the data.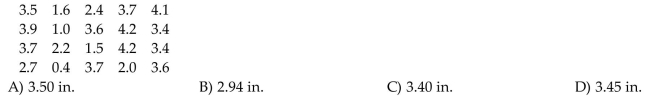
The normal monthly precipitation (in inches) for August is listed for 20 different U.S. cities. Find the median of the data.
Question
Listed below are the amounts of time (in months) that the employees of a restaurant have been working at the restaurant. Find the mean. 
A) 31.5 months
B) 56.7 months
C) 52.9 months
D) 61.1 months
A) 31.5 months
B) 56.7 months
C) 52.9 months
D) 61.1 months
Question
Last year, nine employees of an electronics company retired. Their ages at retirement are listed below. Find the mean retirement age. 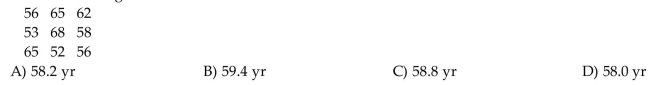
Question
The local Tupperware dealers earned these commissions last month: 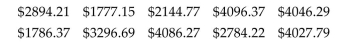 What was the mean commission earned? Round your answer to the nearest cent.
A) $3088.01
B) $3094.01
C) $3867.52
D) $3437.79
What was the mean commission earned? Round your answer to the nearest cent.A) $3088.01
B) $3094.01
C) $3867.52
D) $3437.79
Question
The amount of time (in hours) that Sam studied for an exam on each of the last five days is given below. Find the mean study time. 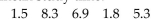
A) 4.96 hr
B) 23.80 hr
C) 4.76 hr
D) 5.45 hr
A) 4.96 hr
B) 23.80 hr
C) 4.76 hr
D) 5.45 hr
Question
Find the median for the given sample data.
The number of vehicles passing through a bank drive-up line during each 15-minute period was recorded. The results are shown below. Find the median number of vehicles going through the line in a fifteen-minute period.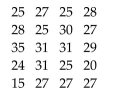
A) 28 vehicles
B) 26.85 vehicles
C) 31 vehicles
D) 27 vehicles
The number of vehicles passing through a bank drive-up line during each 15-minute period was recorded. The results are shown below. Find the median number of vehicles going through the line in a fifteen-minute period.
A) 28 vehicles
B) 26.85 vehicles
C) 31 vehicles
D) 27 vehicles
Question
Find the mode(s) for the given sample data.

Question
Find the mode(s) for the given sample data.


Unlock Deck
Sign up to unlock the cards in this deck!
Unlock Deck
Unlock Deck
1/225
Play
Full screen (f)
Deck 3: Describing, Exploring, and Comparing Data
1
A student earned grades of B, B, A, C, and D. Those courses had these corresponding numbers of credit hours: 4, 5, 1, 5, 4. The grading system assigns quality points to letter grades as follows: A = 4, B = 3, C = 2, D = 1, and F =
0) Compute the grade point average (GPA) and round the result to two decimal places.
A) 3.46
B) 9.00
C) 1.37
D) 2.37
0) Compute the grade point average (GPA) and round the result to two decimal places.
A) 3.46
B) 9.00
C) 1.37
D) 2.37
D
2
If the standard deviation for a set of data is 0, which of the following must be true?
A) All of the data values are negative.
B) All the data values equal 0.
C) All of the data values are identical.
D) None of the above must be true since standard deviation cannot be equal to 0.
A) All of the data values are negative.
B) All the data values equal 0.
C) All of the data values are identical.
D) None of the above must be true since standard deviation cannot be equal to 0.
C
3
When finding percentiles, if the locator L is not a whole number, one procedure is to interpolate so that a locator of 23.75, for example, leads to a value that is 3/4 of the way between the 23rd and 24th scores. Use this method
Of interpolation to find P75 for the set of test scores below.
A) 88.5
B) 94
C) 83
D) 85.75
Of interpolation to find P75 for the set of test scores below.
A) 88.5
B) 94
C) 83
D) 85.75
D
4
Find the variance for the given data. Round your answer to one more decimal place than the original data. To get the best deal on a microwave oven, Jeremy called six appliance stores and asked the cost of a specific model. The prices he
Was quoted are listed below:
Was quoted are listed below:
Unlock Deck
Unlock for access to all 225 flashcards in this deck.
Unlock Deck
k this deck
5
If your score on your next statistics test is converted to a z score, which of these z scores would you prefer?
A) 2.00
B) -1.00
C) 0
D) -2.00
A) 2.00
B) -1.00
C) 0
D) -2.00
Unlock Deck
Unlock for access to all 225 flashcards in this deck.
Unlock Deck
k this deck
6
Find the standard deviation for the given sample data. Round your answer to one more decimal place than is present in the original data.
A) 4347.7
B) 36.1
C) 3999.0
D) 8.35
A) 4347.7
B) 36.1
C) 3999.0
D) 8.35
Unlock Deck
Unlock for access to all 225 flashcards in this deck.
Unlock Deck
k this deck
7
A student earned grades of 84, 78, 84, and 72 on her four regular tests. She earned a grade of 78 on the final exam and 86 on her class projects. Her combined homework grade was 87. The four regular tests count for 40%
Of the course grade, the final exam counts for 30%, the project counts for 10%, and homework counts for 20%.
What is her weighted mean grade? Round to one decimal place.
A) 81.2
B) 82.1
C) 81.3
D) 80.2
Of the course grade, the final exam counts for 30%, the project counts for 10%, and homework counts for 20%.
What is her weighted mean grade? Round to one decimal place.
A) 81.2
B) 82.1
C) 81.3
D) 80.2
Unlock Deck
Unlock for access to all 225 flashcards in this deck.
Unlock Deck
k this deck
8
The test scores of 40 students are listed below. Find P56.
A) 73.5
B) 73
C) 74
D) 22.4
A) 73.5
B) 73
C) 74
D) 22.4
Unlock Deck
Unlock for access to all 225 flashcards in this deck.
Unlock Deck
k this deck
9
Human body temperatures have a mean of 98.20° F and a standard deviation of 0.62° F. Sally's temperature can be described by z = -1.5. What is her temperature? Round your answer to the nearest hundredth.
Unlock Deck
Unlock for access to all 225 flashcards in this deck.
Unlock Deck
k this deck
10
Find the standard deviation for the given sample data. Round your answer to one more decimal place than the original data.
A) 8.35
B) 4347.7
C) 3999.0
D) 36.1
A) 8.35
B) 4347.7
C) 3999.0
D) 36.1
Unlock Deck
Unlock for access to all 225 flashcards in this deck.
Unlock Deck
k this deck
11
Find the variance for the given sample data. Round your answer to one more decimal place than the original data.
A) 11.8
B) 6.2
C) 7.7
D) 7.8
A) 11.8
B) 6.2
C) 7.7
D) 7.8
Unlock Deck
Unlock for access to all 225 flashcards in this deck.
Unlock Deck
k this deck
12
Approximately what percentage of apple diameters is greater than the 66th percentile?
A) 3.4%
B) 17%
C) 34%
D) 66%
A) 3.4%
B) 17%
C) 34%
D) 66%
Unlock Deck
Unlock for access to all 225 flashcards in this deck.
Unlock Deck
k this deck
13
Find the standard deviation for the given sample data. Round your answer to one more decimal place than the original data.
A) 5.8
B) 1.6
C) 5.1
D) 5.4
A) 5.8
B) 1.6
C) 5.1
D) 5.4
Unlock Deck
Unlock for access to all 225 flashcards in this deck.
Unlock Deck
k this deck
14
The customer service department of a phone company is experimenting with two different systems. On Monday they try the first system which is based on an automated menu system. On Tuesday they try the second
System in which each caller is immediately connected with a live agent. A quality control manager selects a
Sample of seven calls each day. He records the time for each customer to have his or her question answered. The
Times (in minutes) are listed below. Find the coefficient of variation for each of the two sets of data, then compare the
Variation. Round results to one decimal place.
A) Automated Menu: 47.1% Live agent: 27.3% There is substantially more variation in the times for the automated menu system.
B) Automated Menu: 45.4% Live agent: 26.3% There is substantially more variation in the times for the automated menu system.
C) Automated Menu: 48.8% Live agent: 28.3% There is substantially more variation in the times for the automated menu system.
D) Automated Menu: 25.2% Live agent: 41.5% There is substantially more variation in the times for the live agent.
System in which each caller is immediately connected with a live agent. A quality control manager selects a
Sample of seven calls each day. He records the time for each customer to have his or her question answered. The
Times (in minutes) are listed below. Find the coefficient of variation for each of the two sets of data, then compare the
Variation. Round results to one decimal place.
A) Automated Menu: 47.1% Live agent: 27.3% There is substantially more variation in the times for the automated menu system.
B) Automated Menu: 45.4% Live agent: 26.3% There is substantially more variation in the times for the automated menu system.
C) Automated Menu: 48.8% Live agent: 28.3% There is substantially more variation in the times for the automated menu system.
D) Automated Menu: 25.2% Live agent: 41.5% There is substantially more variation in the times for the live agent.
Unlock Deck
Unlock for access to all 225 flashcards in this deck.
Unlock Deck
k this deck
15
Listed below are the amounts of time (in months) that the employees of a restaurant have been working at the restaurant. Find the mean for the given sample data. Round your answer to one more decimal place than the original
Data values.
A) 52.9 months
B) 56.7 months
C) 61.1 months
D) 31.5 months
Data values.
A) 52.9 months
B) 56.7 months
C) 61.1 months
D) 31.5 months
Unlock Deck
Unlock for access to all 225 flashcards in this deck.
Unlock Deck
k this deck
16
Scores on the SAT test have a mean of 1518 and a standard deviation of 325. Scores on the ACT test have a mean of 21.1 and a standard deviation of 4.8. Which of the following choices is not true?
A) The SAT score of 1490 is relatively better than the ACT score of 17.0.
B) An ACT score of 17.0 has a z score of -0.85.
C) The ACT score of 17.0 is relatively better than the SAT score of 1490.
D) An SAT score of 1490 has a z score of -0.09.
A) The SAT score of 1490 is relatively better than the ACT score of 17.0.
B) An ACT score of 17.0 has a z score of -0.85.
C) The ACT score of 17.0 is relatively better than the SAT score of 1490.
D) An SAT score of 1490 has a z score of -0.09.
Unlock Deck
Unlock for access to all 225 flashcards in this deck.
Unlock Deck
k this deck
17
The number of vehicles passing through a bank drive -up line during each 15-minute period was recorded. The results are shown below. Find the median number of vehicles going through the line in a 15-minute period.
A) 26.85 vehicles
B) 27 vehicles
C) 28 vehicles
D) 31 vehicles
A) 26.85 vehicles
B) 27 vehicles
C) 28 vehicles
D) 31 vehicles
Unlock Deck
Unlock for access to all 225 flashcards in this deck.
Unlock Deck
k this deck
18
A store manager kept track of the number of newspapers sold each week over a seven-week period. The results are shown below. Find the median number of newspapers sold.
A) 202 newspapers
B) 242 newspapers
C) 113 newspapers
D) 175 newspapers
Find the median number of newspapers sold.A) 202 newspapers
B) 242 newspapers
C) 113 newspapers
D) 175 newspapers
Unlock Deck
Unlock for access to all 225 flashcards in this deck.
Unlock Deck
k this deck
19
Construct a boxplot for the given data. Include values of the 5-number summary in all boxplots. The test scores of 40 students are listed below.
Unlock Deck
Unlock for access to all 225 flashcards in this deck.
Unlock Deck
k this deck
20
The prices (in dollars) of 12 electric smooth top ranges are listed below. Find the range for the given sample data.
A) $900
B) $910
C) $920
D) $930
A) $900
B) $910
C) $920
D) $930
Unlock Deck
Unlock for access to all 225 flashcards in this deck.
Unlock Deck
k this deck
21
Jorge has his own business as a painter. The amounts he made in the last five months are shown below:
Unlock Deck
Unlock for access to all 225 flashcards in this deck.
Unlock Deck
k this deck
22
Which of the following is not a property of variance?
A) The value of the variance is zero only when all of the data values are the same number.
B) The units of variance are the squares of the units of the original data.
C) The value of the variance is always positive or 0.
D) The sample variance is a biased estimator of the population variance.
A) The value of the variance is zero only when all of the data values are the same number.
B) The units of variance are the squares of the units of the original data.
C) The value of the variance is always positive or 0.
D) The sample variance is a biased estimator of the population variance.
Unlock Deck
Unlock for access to all 225 flashcards in this deck.
Unlock Deck
k this deck
23
If your score on your next statistics test is converted to a z score, which of these z scores would you prefer? Explain
your answer.
your answer.
Unlock Deck
Unlock for access to all 225 flashcards in this deck.
Unlock Deck
k this deck
24
How will a high outlier in a data set affect the mean and median?
A) Distribution skewed to the right, mean not effected, median skewed to the right
B) Distribution skewed to the left, mean pulled to the left, median not effected
C) Distribution skewed to the right, mean pulled to the right, median not effected
D) Distribution skewed to the right, mean not effected, median not effected
Unlock Deck
Unlock for access to all 225 flashcards in this deck.
Unlock Deck
k this deck
25
The owner of a manufacturing plant employs eighty people. As part of their personnel file, she asked each one to record to the nearest one-tenth of a mile the distance they travel one way from home to work. The distances for a
Random sample of six employees are listed below: Find the variance for the given data.
Random sample of six employees are listed below:
Find the variance for the given data. Unlock Deck
Unlock for access to all 225 flashcards in this deck.
Unlock Deck
k this deck
26
A company had 80 employees whose salaries are summarized in the frequency distribution below. Find the standard deviation.
A) $8195.1
B) $8422.8
C) $7588.1
D) $7967.5
A) $8195.1
B) $8422.8
C) $7588.1
D) $7967.5
Unlock Deck
Unlock for access to all 225 flashcards in this deck.
Unlock Deck
k this deck
27
A test score of 48.4 on a test having a mean of 66 and a standard deviation of 11. Find the z score corresponding to the given value and use the z score to determine whether the value is significant. Consider a score to be
Significant if its z score is less than -2.00 or greater than 2.00. Round the z score to the nearest tenth if necessary.
A) 1.6; not significant
B) -1.6; not significant
C) -17.6; significant
D) -1.6; significant
Significant if its z score is less than -2.00 or greater than 2.00. Round the z score to the nearest tenth if necessary.
A) 1.6; not significant
B) -1.6; not significant
C) -17.6; significant
D) -1.6; significant
Unlock Deck
Unlock for access to all 225 flashcards in this deck.
Unlock Deck
k this deck
28
Scores on a test have a mean of 66 and a standard deviation of 9. Michelle has a score of 57. Convert Michelle's score to a z score.
A) 1
B) -1
C) -9
D) 9
A) 1
B) -1
C) -9
D) 9
Unlock Deck
Unlock for access to all 225 flashcards in this deck.
Unlock Deck
k this deck
29
The mean of a set of data is 108.06 and its standard deviation is 115.45. Find the z score for a value of 489.67.
A) 3.31
B) 3.61
C) 3.64
D) 2.98
A) 3.31
B) 3.61
C) 3.64
D) 2.98
Unlock Deck
Unlock for access to all 225 flashcards in this deck.
Unlock Deck
k this deck
30
The heights of the adults in one town have a mean of 67.1 inches and a standard deviation of 3.5 inches. What can you conclude from Chebyshev's theorem about the percentage of adults in the town whose heights are
Between 60.1 and 74.1 inches?
A) The percentage is at least 75%.
B) The percentage is at most 95%.
C) The percentage is at least 95%.
D) The percentage is at most 75%.
Between 60.1 and 74.1 inches?
A) The percentage is at least 75%.
B) The percentage is at most 95%.
C) The percentage is at least 95%.
D) The percentage is at most 75%.
Unlock Deck
Unlock for access to all 225 flashcards in this deck.
Unlock Deck
k this deck
31
The mean height of a basketball team is 6 feet with a standard deviation of 0.2 feet. The team's center is 6.9 feet tall. Find the center's z score. Is his score unusual?
A) 4.5, yes
B) 3.83, no
C) 4.95, yes
D) 4, no
A) 4.5, yes
B) 3.83, no
C) 4.95, yes
D) 4, no
Unlock Deck
Unlock for access to all 225 flashcards in this deck.
Unlock Deck
k this deck
32
Find the variance for the given sample data. Round your answer to one more decimal place than the original data.
A) 6.2
B) 11.8
C) 7.7
D) 7.8
A) 6.2
B) 11.8
C) 7.7
D) 7.8
Unlock Deck
Unlock for access to all 225 flashcards in this deck.
Unlock Deck
k this deck
33
The number of hours per day a college student spends on homework has a mean of 6 hours and a standard deviation of 1.25 hours. Yesterday she spent 3 hours on homework. How many standard deviations from the
Mean is that? Round your answer to two decimal places.
A) 2.40 standard deviations below the mean
B) 1.20 standard deviations below the mean
C) 1.20 standard deviations above the mean
D) 2.40 standard deviations above the mean
Mean is that? Round your answer to two decimal places.
A) 2.40 standard deviations below the mean
B) 1.20 standard deviations below the mean
C) 1.20 standard deviations above the mean
D) 2.40 standard deviations above the mean
Unlock Deck
Unlock for access to all 225 flashcards in this deck.
Unlock Deck
k this deck
34
Listed below are the systolic blood pressures (in mm Hg) for a sample of men aged 20-29 years and for a sample of men aged 60-69 years. Find the coefficient of variation for each of the two sets of data, then compare the variation. Round results to one
Decimal place.
Find the coefficient of variation for each of the two sets of data, then compare the variation. Round results to oneDecimal place.
Unlock Deck
Unlock for access to all 225 flashcards in this deck.
Unlock Deck
k this deck
35
In a data set with a range of 55.4 to 105.4 and 400 observations, there are 276 observations with values less than 86. Find the percentile for 86.
A) P612
B) P69
C) P32
D) P122.56
A) P612
B) P69
C) P32
D) P122.56
Unlock Deck
Unlock for access to all 225 flashcards in this deck.
Unlock Deck
k this deck
36
Explain how two data sets could have equal means and modes but still differ greatly. Give an example with two
data sets to illustrate.
data sets to illustrate.
Unlock Deck
Unlock for access to all 225 flashcards in this deck.
Unlock Deck
k this deck
37
The race speeds (in minutes) for the top eight cars in a 200-mile race are listed below. Use the range rule of thumb to estimate the standard deviation. Round results to the nearest tenth.
A) 7.5 minutes
B) 6.8 minutes
C) 3.4 minutes
D) 1.1 minutes
A) 7.5 minutes
B) 6.8 minutes
C) 3.4 minutes
D) 1.1 minutes
Unlock Deck
Unlock for access to all 225 flashcards in this deck.
Unlock Deck
k this deck
38
The local Tupperware dealers earned these commissions last month: What was the mean commission earned? Round your answer to the nearest cent.
A) $3437.79
B) $3094.01
C) $3867.52
D) $3088.01
What was the mean commission earned? Round your answer to the nearest cent.A) $3437.79
B) $3094.01
C) $3867.52
D) $3088.01
Unlock Deck
Unlock for access to all 225 flashcards in this deck.
Unlock Deck
k this deck
39
The test scores of 40 students are listed below. Find P85.
A) 85
B) 87
C) 34
D) 89
A) 85
B) 87
C) 34
D) 89
Unlock Deck
Unlock for access to all 225 flashcards in this deck.
Unlock Deck
k this deck
40
Last year, nine employees of an electronics company retired. Their ages (in years) at retirement are listed below. Find the mode(s) for the given sample data.
Unlock Deck
Unlock for access to all 225 flashcards in this deck.
Unlock Deck
k this deck
41
Use the following duration times (seconds) of 24 eruptions of the Old Faithful geyser in Yellowstone National Park. The
duration times are sorted from lowest to highest. Describe how to calculate the limits to determine outliers for this data set? Identify any outliers.
duration times are sorted from lowest to highest.
Describe how to calculate the limits to determine outliers for this data set? Identify any outliers. Unlock Deck
Unlock for access to all 225 flashcards in this deck.
Unlock Deck
k this deck
42
Dave is a college student contemplating a possible career option. One factor that will influence his decision is
the amount of money he is likely to make. He decides to look up the average salary of graduates in that
profession. Which information would be more useful to him, the mean salary or the median salary. Why?
the amount of money he is likely to make. He decides to look up the average salary of graduates in that
profession. Which information would be more useful to him, the mean salary or the median salary. Why?
Unlock Deck
Unlock for access to all 225 flashcards in this deck.
Unlock Deck
k this deck
43
Describe any similarities or differences in the two distributions represented by the following boxplots. Assume
the two boxplots have the same scale.
the two boxplots have the same scale.
Unlock Deck
Unlock for access to all 225 flashcards in this deck.
Unlock Deck
k this deck
44
Listed below are the arrival delay times (in minutes) of randomly selected flights between New York's JFK
airport to Los Angeles (LAX). Negative values correspond to flights that arrive before their schedule time and
positive values represent delays. Calculate the range of the data and the standard deviation. Can the standard
deviation be negative?
airport to Los Angeles (LAX). Negative values correspond to flights that arrive before their schedule time and
positive values represent delays. Calculate the range of the data and the standard deviation. Can the standard
deviation be negative?
Unlock Deck
Unlock for access to all 225 flashcards in this deck.
Unlock Deck
k this deck
45
An online service ran a poll of its internet subscribers and asked whether they would re-elect the current
President. Among the 1,304,240 responses, 768,731 answered "yes", 286,756 answered "no", and 248,753 said it
was "too soon to decide". Given how large this sample is, can it be considered to be representative of the
population of the United States? Explain.
President. Among the 1,304,240 responses, 768,731 answered "yes", 286,756 answered "no", and 248,753 said it
was "too soon to decide". Given how large this sample is, can it be considered to be representative of the
population of the United States? Explain.
Unlock Deck
Unlock for access to all 225 flashcards in this deck.
Unlock Deck
k this deck
46
The tallest living man has a height of 247 cm and the tallest living woman is 236 cm tall. Heights of mean have a
mean of 175 cm and a standard deviation of 7 cm. Heights of women have a mean of 162 cm and a standard
deviation of 6 cm. Relative to the population of the same gender, determine who is taller by comparing z scores.
Include an explanation.
mean of 175 cm and a standard deviation of 7 cm. Heights of women have a mean of 162 cm and a standard
deviation of 6 cm. Relative to the population of the same gender, determine who is taller by comparing z scores.
Include an explanation.
Unlock Deck
Unlock for access to all 225 flashcards in this deck.
Unlock Deck
k this deck
47
Andrew asked seven of his friends how many cousins they had. The results are listed below. Find the mean number of cousins.
A) 10.1 cousins
B) 10 cousins
C) 8.6 cousins
D) 8.1 cousins
A) 10.1 cousins
B) 10 cousins
C) 8.6 cousins
D) 8.1 cousins
Unlock Deck
Unlock for access to all 225 flashcards in this deck.
Unlock Deck
k this deck
48
The following are interval times (minutes) between eruptions of the Old Faithful geyser in Yellowstone
National Park (based on U.S. National Park Service data). Identify the five number summary and construct a boxplot of these data.
National Park (based on U.S. National Park Service data).
Identify the five number summary and construct a boxplot of these data. Unlock Deck
Unlock for access to all 225 flashcards in this deck.
Unlock Deck
k this deck
49
The weights (in pounds) of six dogs are listed below. Find the mean weight.
A) 78.6 lb
B) 65.5 lb
C) 65 lb
D) 66 lb
A) 78.6 lb
B) 65.5 lb
C) 65 lb
D) 66 lb
Unlock Deck
Unlock for access to all 225 flashcards in this deck.
Unlock Deck
k this deck
50
A male student of the author has a measured pulse rate of 52 beats per minute. According to a National Center
for Health Statistics data set, males have a mean pulse rate of 67.3 beats per minute and a standard deviation of
10.3 beats per minute. Determine whether the student's pulse rate is significantly low or high by determining
the difference between the student's pulse rate and the mean pulse rate of males and how many standard
deviations that difference represents by calculating the z score. Consider usual pulse rates to be within 2
standard deviations of the mean.
Unlock Deck
Unlock for access to all 225 flashcards in this deck.
Unlock Deck
k this deck
51
An engineer is designing a machine to manufacture gloves and she obtains the following sample of hand
lengths (mm) of randomly selected adult males. A frequency distribution is created from the data. The
frequencies in order are 1, 8, 56, 237, 382, 228, 48, 4, 1. Does it appear that the sample is from a population with a
normal distribution? Explain.
lengths (mm) of randomly selected adult males. A frequency distribution is created from the data. The
frequencies in order are 1, 8, 56, 237, 382, 228, 48, 4, 1. Does it appear that the sample is from a population with a
normal distribution? Explain.
Unlock Deck
Unlock for access to all 225 flashcards in this deck.
Unlock Deck
k this deck
52
Use the following duration times (seconds) of 24 eruptions of the Old Faithful geyser in Yellowstone National Park. The
duration times are sorted from lowest to highest. here
duration times are sorted from lowest to highest.
here Unlock Deck
Unlock for access to all 225 flashcards in this deck.
Unlock Deck
k this deck
53
A comparison is made between summer electric bills of those who have central air and those who have window
units. Find the mean and median for each of the two samples, then compare the two sets of results.
units. Find the mean and median for each of the two samples, then compare the two sets of results.
Unlock Deck
Unlock for access to all 225 flashcards in this deck.
Unlock Deck
k this deck
54
Carbon monoxide is measured in one city for five different days. The mean of those values is 0.62 parts per
million. Four of the values (in parts per million) are 0.3, 0.4, 1.1, and 0.7. Find the missing value. If n is the
number of values, how many of the n values can be freely assigned before the remaining values are
determined? What is that called?
million. Four of the values (in parts per million) are 0.3, 0.4, 1.1, and 0.7. Find the missing value. If n is the
number of values, how many of the n values can be freely assigned before the remaining values are
determined? What is that called?
Unlock Deck
Unlock for access to all 225 flashcards in this deck.
Unlock Deck
k this deck
55
The textbook defines significantly low or high values as those data points with z scores less than z = -2.00 or z
scores greater than z = 200. Comment on this definition with respect to Chebyshev's theorem; refer specifically
to the percent of scores which would be defined as significant according to Chebyshev's theorem.
scores greater than z = 200. Comment on this definition with respect to Chebyshev's theorem; refer specifically
to the percent of scores which would be defined as significant according to Chebyshev's theorem.
Unlock Deck
Unlock for access to all 225 flashcards in this deck.
Unlock Deck
k this deck
56
An engineer is designing a machine to manufacture gloves and she obtains the following sample of hand
lengths (mm) of randomly selected adult males based on data gathered: Define this data set as discrete or continuous. The hand lengths is what type of level of measurement? Compare the
mean and median for this data set and if you can draw any conclusions from these values.
lengths (mm) of randomly selected adult males based on data gathered:
Define this data set as discrete or continuous. The hand lengths is what type of level of measurement? Compare themean and median for this data set and if you can draw any conclusions from these values.
Unlock Deck
Unlock for access to all 225 flashcards in this deck.
Unlock Deck
k this deck
57
The table below provides a frequency distribution for the winner of the Davis Cup Tennis Competition during
the period 1977-1994. Which measure of center, the mean, the median, or the mode is most appropriate here? Why?
the period 1977-1994.
Which measure of center, the mean, the median, or the mode is most appropriate here? Why? Unlock Deck
Unlock for access to all 225 flashcards in this deck.
Unlock Deck
k this deck
58
Describe any similarities or differences in the two distributions represented by the following boxplots. Assume the two
boxplots have the same scale.
boxplots have the same scale.
Unlock Deck
Unlock for access to all 225 flashcards in this deck.
Unlock Deck
k this deck
59
Which do you think has less variation: the IQ scores of students in your statistics class or the IQ scores of a
simple random sample taken from the general population? Why?
simple random sample taken from the general population? Why?
Unlock Deck
Unlock for access to all 225 flashcards in this deck.
Unlock Deck
k this deck
60
Construct a data set for which the range is misleading as a measure of variation. Explain why the range is
misleading and suggest an alternative measure of variation.
misleading and suggest an alternative measure of variation.
Unlock Deck
Unlock for access to all 225 flashcards in this deck.
Unlock Deck
k this deck
61
Find the median for the given sample data.
The temperatures (in degrees Fahrenheit) in 7 different cities on New Year's Day are listed below. Find the median temperature.
A) 64°F
B) 51°F
C) 53°F
D) 31°F
The temperatures (in degrees Fahrenheit) in 7 different cities on New Year's Day are listed below.
Find the median temperature.A) 64°F
B) 51°F
C) 53°F
D) 31°F
Unlock Deck
Unlock for access to all 225 flashcards in this deck.
Unlock Deck
k this deck
62
Six college buddies bought each other Christmas gifts. They amounts they spent are shown below. What was the mean amount spent? Round your answer to the nearest cent.
A) $247.87
B) $285.44
C) $297.44
D) $371.80
What was the mean amount spent? Round your answer to the nearest cent.A) $247.87
B) $285.44
C) $297.44
D) $371.80
Unlock Deck
Unlock for access to all 225 flashcards in this deck.
Unlock Deck
k this deck
63
The normal monthly precipitation (in inches) for August is listed for 20 different U.S. cities. Find the mean monthly precipitation.
A) 3.27 in.
B) 2.80 in.
C) 3.09 in.
D) 2.94 in.
A) 3.27 in.
B) 2.80 in.
C) 3.09 in.
D) 2.94 in.
Unlock Deck
Unlock for access to all 225 flashcards in this deck.
Unlock Deck
k this deck
64
Find the median for the given sample data.
The ages (in years) of the eight passengers on a bus are listed below. Find the median age.
A) 24.5 yr
B) 29 yr
C) 25.5 yr
D) 22 yr
The ages (in years) of the eight passengers on a bus are listed below.
Find the median age.A) 24.5 yr
B) 29 yr
C) 25.5 yr
D) 22 yr
Unlock Deck
Unlock for access to all 225 flashcards in this deck.
Unlock Deck
k this deck
65
Find the median for the given sample data.
The weights (in ounces) of 21 cookies are shown. Find the median weight.
A) 0.64 oz
B) 0.91 oz
C) 1.29 oz
D) 0.78 oz
The weights (in ounces) of 21 cookies are shown. Find the median weight.
A) 0.64 oz
B) 0.91 oz
C) 1.29 oz
D) 0.78 oz
Unlock Deck
Unlock for access to all 225 flashcards in this deck.
Unlock Deck
k this deck
66
The students in Hugh Logan's math class took the Scholastic Aptitude Test. Their math scores are shown below. Find the mean score.
A) 459.6
B) 450.4
C) 476.0
D) 441.6
A) 459.6
B) 450.4
C) 476.0
D) 441.6
Unlock Deck
Unlock for access to all 225 flashcards in this deck.
Unlock Deck
k this deck
67
Find the mode(s) for the given sample data.
Unlock Deck
Unlock for access to all 225 flashcards in this deck.
Unlock Deck
k this deck
68
Listed below are the amounts of weight change (in pounds) for 12 women during their first year of work after graduating from college. Positive values correspond to women who gained weight and negative values
Correspond to women who lost weight. What is the mean weight change?
A) 3 lb
B) 8 lb
C) 2.8 lb
D) 3.1 lb
Correspond to women who lost weight. What is the mean weight change?
A) 3 lb
B) 8 lb
C) 2.8 lb
D) 3.1 lb
Unlock Deck
Unlock for access to all 225 flashcards in this deck.
Unlock Deck
k this deck
69
Find the median for the given sample data.
The distances (in miles) driven in the past week by each of a company's sales representatives are listed below. Find the median distance driven.
A) 238 mi
B) 284 mi
C) 198.50 mi
D) 261 mi
The distances (in miles) driven in the past week by each of a company's sales representatives are listed below.
Find the median distance driven.A) 238 mi
B) 284 mi
C) 198.50 mi
D) 261 mi
Unlock Deck
Unlock for access to all 225 flashcards in this deck.
Unlock Deck
k this deck
70
Find the median for the given sample data.
Listed below are the amounts of weight change (in pounds) for 12 women during their first year of work after graduating from college. Positive values correspond to women who gained weight and negative values
Correspond to women who lost weight. What is the median weight change?
A) 3.6 lb
B) 4 lb
C) 3.9 lb
D) 3 lb
Unlock Deck
Unlock for access to all 225 flashcards in this deck.
Unlock Deck
k this deck
71
Find the median for the given sample data.
A store manager kept track of the number of newspapers sold each week over a seven-week period. The results are shown below. Find the median number of newspapers sold.
A) 175 newspapers
B) 113 newspapers
C) 242 newspapers
D) 202 newspapers
A store manager kept track of the number of newspapers sold each week over a seven-week period. The results are shown below.
Find the median number of newspapers sold.A) 175 newspapers
B) 113 newspapers
C) 242 newspapers
D) 202 newspapers
Unlock Deck
Unlock for access to all 225 flashcards in this deck.
Unlock Deck
k this deck
72
Find the median for the given sample data.
Listed below are the amounts of time (in months) that the employees of a restaurant have been working at the restaurant. Find the median.
A) 26.5 months
B) 19 months
C) 60.1 months
D) 55.8 months
Listed below are the amounts of time (in months) that the employees of a restaurant have been working at the restaurant. Find the median.
A) 26.5 months
B) 19 months
C) 60.1 months
D) 55.8 months
Unlock Deck
Unlock for access to all 225 flashcards in this deck.
Unlock Deck
k this deck
73
Find the median for the given sample data.
The normal monthly precipitation (in inches) for August is listed for 20 different U.S. cities. Find the median of the data.
The normal monthly precipitation (in inches) for August is listed for 20 different U.S. cities. Find the median of the data.
Unlock Deck
Unlock for access to all 225 flashcards in this deck.
Unlock Deck
k this deck
74
Listed below are the amounts of time (in months) that the employees of a restaurant have been working at the restaurant. Find the mean.
A) 31.5 months
B) 56.7 months
C) 52.9 months
D) 61.1 months
A) 31.5 months
B) 56.7 months
C) 52.9 months
D) 61.1 months
Unlock Deck
Unlock for access to all 225 flashcards in this deck.
Unlock Deck
k this deck
75
Last year, nine employees of an electronics company retired. Their ages at retirement are listed below. Find the mean retirement age.
Unlock Deck
Unlock for access to all 225 flashcards in this deck.
Unlock Deck
k this deck
76
The local Tupperware dealers earned these commissions last month: What was the mean commission earned? Round your answer to the nearest cent.
A) $3088.01
B) $3094.01
C) $3867.52
D) $3437.79
What was the mean commission earned? Round your answer to the nearest cent.A) $3088.01
B) $3094.01
C) $3867.52
D) $3437.79
Unlock Deck
Unlock for access to all 225 flashcards in this deck.
Unlock Deck
k this deck
77
The amount of time (in hours) that Sam studied for an exam on each of the last five days is given below. Find the mean study time.
A) 4.96 hr
B) 23.80 hr
C) 4.76 hr
D) 5.45 hr
A) 4.96 hr
B) 23.80 hr
C) 4.76 hr
D) 5.45 hr
Unlock Deck
Unlock for access to all 225 flashcards in this deck.
Unlock Deck
k this deck
78
Find the median for the given sample data.
The number of vehicles passing through a bank drive-up line during each 15-minute period was recorded. The results are shown below. Find the median number of vehicles going through the line in a fifteen-minute period.
A) 28 vehicles
B) 26.85 vehicles
C) 31 vehicles
D) 27 vehicles
The number of vehicles passing through a bank drive-up line during each 15-minute period was recorded. The results are shown below. Find the median number of vehicles going through the line in a fifteen-minute period.
A) 28 vehicles
B) 26.85 vehicles
C) 31 vehicles
D) 27 vehicles
Unlock Deck
Unlock for access to all 225 flashcards in this deck.
Unlock Deck
k this deck
79
Find the mode(s) for the given sample data.
Unlock Deck
Unlock for access to all 225 flashcards in this deck.
Unlock Deck
k this deck
80
Find the mode(s) for the given sample data.
Unlock Deck
Unlock for access to all 225 flashcards in this deck.
Unlock Deck
k this deck
Unlock Deck
Unlock for access to all 225 flashcards in this deck.


