Deck 8: Analysis of Variance
Full screen (f)
Question
The formula for dfwithin is:
A)
B)
C)
D)
A)
B)
C)
D)
Question
In an analysis of variance with three groups, the research hypothesis is:
A)
B)
C)
D)
A)
B)
C)
D)
Question
Question
Question
Question
Question
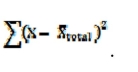
The formula for the total sum of squares, SStotal , is:
A)
B)
C)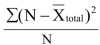
D)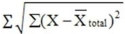
A)
B)
C)
D)
Question
Question
In an analysis of variance with three groups, the null hypothesis states:
A)
B)
C)
D)
A)
B)
C)
D)
Question
Question
Question
Question
Question
The formula for dfbetween is:
A)
B)
C)
D)
A)
B)
C)
D)
Question
Question
Question
Question
Question
Question
Question
The question below refers to the following situation:
A researcher is interested in the effects of family size on leisure time. He questions 16 families on the number of "free hours per week." He polls 4 families at each size, from 1 to 4 children. The data are as follows: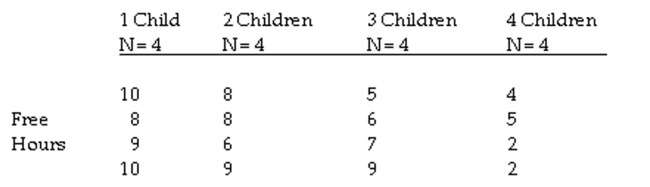
Calculate the total sum of squares.
A researcher is interested in the effects of family size on leisure time. He questions 16 families on the number of "free hours per week." He polls 4 families at each size, from 1 to 4 children. The data are as follows:
Calculate the total sum of squares.
Question
The question below refers to the following situation:
A social researcher is interested in studying the relationship between religious affiliation
and years of education. Here is the data she is working with: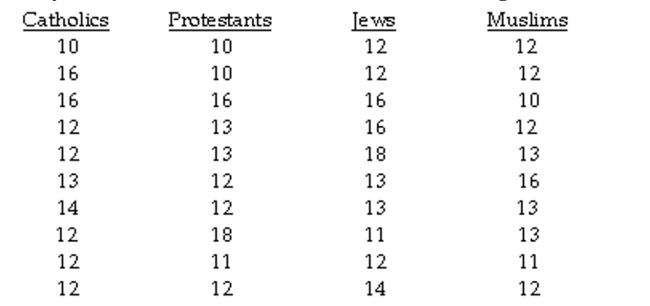
Calculate the total sum of squares.
A social researcher is interested in studying the relationship between religious affiliation
and years of education. Here is the data she is working with:
Calculate the total sum of squares.
Question

The __________ sum of squares is defined as
Question
Question
The question below refers to the following situation:
A social researcher is interested in studying the relationship between religious affiliation and years of education. Here is the data she is working with: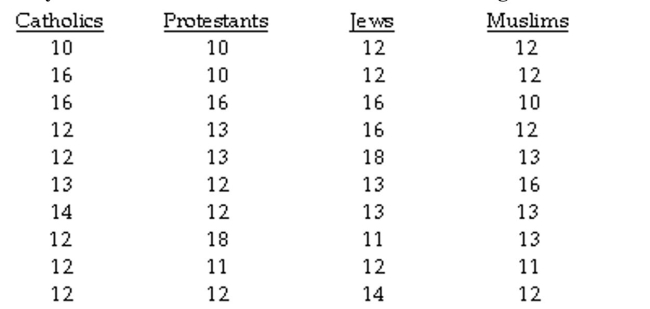
Calculate the mean square within groups (MSwithin).
A social researcher is interested in studying the relationship between religious affiliation and years of education. Here is the data she is working with:
Calculate the mean square within groups (MSwithin).
Question
Question
Question
The question below refers to the following situation:
A social researcher is interested in studying the relationship between religious affiliation and years of education. Here is the data she is working with: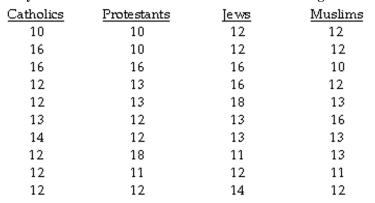
What are your conclusions about the null hypothesis?
A social researcher is interested in studying the relationship between religious affiliation and years of education. Here is the data she is working with:
What are your conclusions about the null hypothesis?
Question
The __________ sum of squares is defined as
Question
The question below refers to the following situation:
A social researcher is interested in studying the relationship between religious affiliation and years of education. Here is the data she is working with: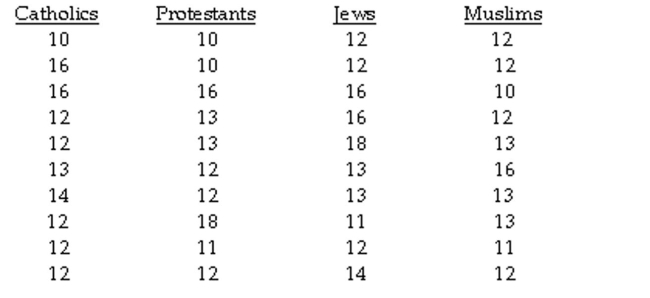
Calculate the within-group sum of squares.
A social researcher is interested in studying the relationship between religious affiliation and years of education. Here is the data she is working with:
Calculate the within-group sum of squares.
Question
Question
Question
The question below refers to the following situation:
A social researcher is interested in studying the relationship between religious affiliation and years of education. Here is the data she is working with: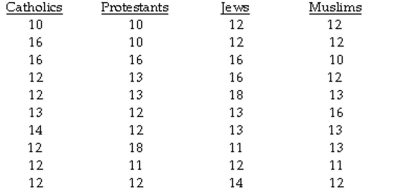
Calculate the mean square between groups (MSbetween).
A social researcher is interested in studying the relationship between religious affiliation and years of education. Here is the data she is working with:
Calculate the mean square between groups (MSbetween).
Question
Question
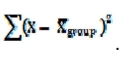
The __________ sum of squares is defined as
Question
The question below refers to the following situation:
A social researcher is interested in studying the relationship between religious affiliation and years of education. Here is the data she is working with: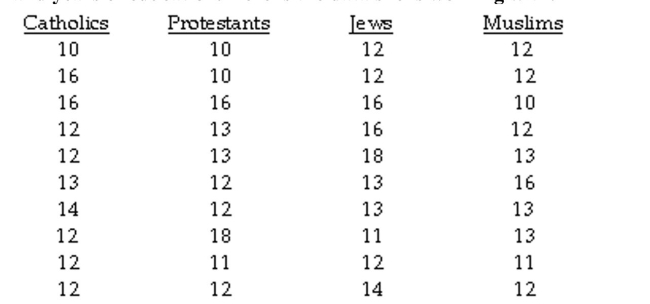
Calculate the between-group sum of squares.
A social researcher is interested in studying the relationship between religious affiliation and years of education. Here is the data she is working with:
Calculate the between-group sum of squares.
Question
Question
The question below refers to the following situation:
A social researcher is interested in studying the relationship between religious affiliation and years of education. Here is the data she is working with: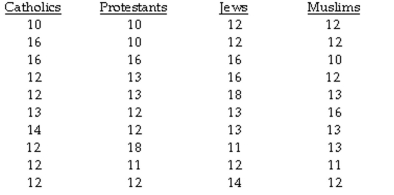
Calculate the F ratio.
A social researcher is interested in studying the relationship between religious affiliation and years of education. Here is the data she is working with:
Calculate the F ratio.
Question
Question
The question below refers to the following situation:
A social researcher is interested in studying the relationship between religious affiliation and years of education. Here is the data she is working with: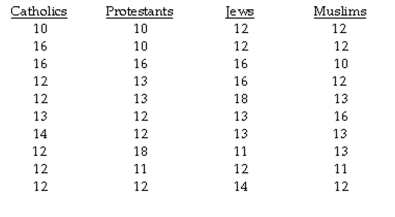
Are your results statistically significant, and if so, at what level?
A social researcher is interested in studying the relationship between religious affiliation and years of education. Here is the data she is working with:
Are your results statistically significant, and if so, at what level?
Question
The question below refers to the following situation:
A valet parking attendant is interested in whether daytime temperature affects the size of
tips. To study this question, she records the size of the tip given by her customers on 3
extremely hot summer days, 3 warm spring days, and 3 cold winter days. Complete an
analysis of variance to test the differences between mean tips with significance (α = .05), to
determine if the groups differ from each other.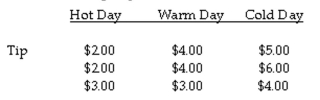
Calculate mean square within.
Question
The question below refers to the following situation:
A valet parking attendant is interested in whether daytime temperature affects the size of
tips. To study this question, she records the size of the tip given by her customers on 3
extremely hot summer days, 3 warm spring days, and 3 cold winter days. Complete an
analysis of variance to test the differences between mean tips with significance (α = .05), to
determine if the groups differ from each other.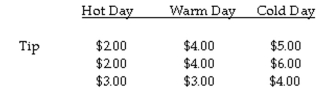
Calculate F.
Question
The question below refers to the following situation:
A valet parking attendant is interested in whether daytime temperature affects the size of tips. To study this question, she records the size of the tip given by her customers on 3 extremely hot summer days, 3 warm spring days, and 3 cold winter days. Complete an analysis of variance to test the differences between mean tips with significance (α = .05), to determine if the groups differ from each other.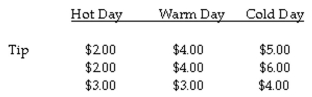
What are your conclusions about the null hypothesis?
Question
The question below refers to the following situation:
A valet parking attendant is interested in whether daytime temperature affects the size of
tips. To study this question, she records the size of the tip given by her customers on 3
extremely hot summer days, 3 warm spring days, and 3 cold winter days. Complete an
analysis of variance to test the differences between mean tips with significance (α = .05), to
determine if the groups differ from each other.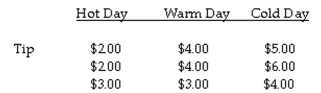
Calculate mean square between.
Question
The question below refers to the following situation:
A valet parking attendant is interested in whether daytime temperature affects the size of
tips. To study this question, she records the size of the tip given by her customers on 3
extremely hot summer days, 3 warm spring days, and 3 cold winter days. Complete an
analysis of variance to test the differences between mean tips with significance (α = .05), to
determine if the groups differ from each other.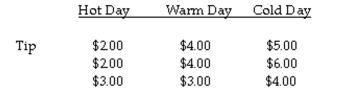
Calculate the within-group sum of squares.
Question
The question below refers to the following situation:
A valet parking attendant is interested in whether daytime temperature affects the size of tips. To study this question, she records the size of the tip given by her customers on 3 extremely hot summer days, 3 warm spring days, and 3 cold winter days. Complete an analysis of variance to test the differences between mean tips with significance (α = .05), to determine if the groups differ from each other.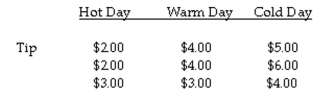
Calculate the between-group sum of squares.
Question
The question below refers to the following situation:
A valet parking attendant is interested in whether daytime temperature affects the size of tips. To study this question, she records the size of the tip given by her customers on 3 extremely hot summer days, 3 warm spring days, and 3 cold winter days. Complete an analysis of variance to test the differences between mean tips with significance (α = .05), to determine if the groups differ from each other.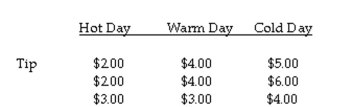
What is the research hypothesis?
Question
The question below refers to the following situation:
A valet parking attendant is interested in whether daytime temperature affects the size of tips. To study this question, she records the size of the tip given by her customers on 3 extremely hot summer days, 3 warm spring days, and 3 cold winter days. Complete an analysis of variance to test the differences between mean tips with significance (α = .05), to determine if the groups differ from each other.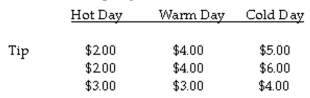
Calculate the total sum of squares.
Question
The question below refers to the following situation:
A valet parking attendant is interested in whether daytime temperature affects the size of tips. To study this question, she records the size of the tip given by her customers on 3 extremely hot summer days, 3 warm spring days, and 3 cold winter days. Complete an analysis of variance to test the differences between mean tips with significance (α = .05), to determine if the groups differ from each other.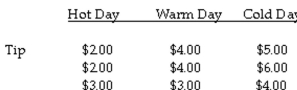
Are the results statistically significant and, if so, at what level?
Question
The question below refers to the following situation:
A researcher is interested in the effects of family size on leisure time. He questions 16 families on the number of "free hours per week." He polls 4 families at each size, from 1 to 4 children. The data are as follows: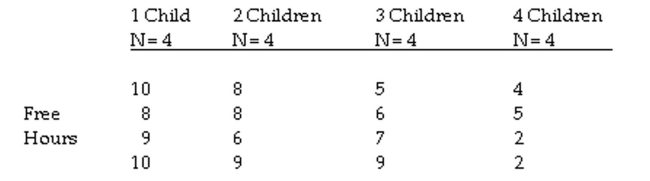
Calculate the mean square between groups.
A researcher is interested in the effects of family size on leisure time. He questions 16 families on the number of "free hours per week." He polls 4 families at each size, from 1 to 4 children. The data are as follows:
Calculate the mean square between groups.
Question
The question below refers to the following situation:
A valet parking attendant is interested in whether daytime temperature affects the size of tips. To study this question, she records the size of the tip given by her customers on 3 extremely hot summer days, 3 warm spring days, and 3 cold winter days. Complete an analysis of variance to test the differences between mean tips with significance (α = .05), to determine if the groups differ from each other.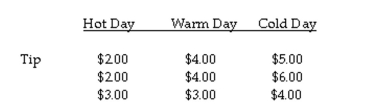
What is the null hypothesis?

Unlock Deck
Sign up to unlock the cards in this deck!
Unlock Deck
Unlock Deck
1/51
Play
Full screen (f)
Deck 8: Analysis of Variance
1
The formula for dfwithin is:
A)
B)
C)
D)
A)
B)
C)
D)
2
In an analysis of variance with three groups, the research hypothesis is:
A)
B)
C)
D)
A)
B)
C)
D)
3
The question below refers to the following situation:
In an analysis of variance with 4 groups, each containing 12 respondents:
Calculate the within-group degrees of freedom.
A)60
B)3
C)44
D)45
In an analysis of variance with 4 groups, each containing 12 respondents:
Calculate the within-group degrees of freedom.
A)60
B)3
C)44
D)45
44
4
Using the F ratio requires:
A)interval data.
B)ordinal data.
C)nominal data.
D)all of the above.
A)interval data.
B)ordinal data.
C)nominal data.
D)all of the above.
Unlock Deck
Unlock for access to all 51 flashcards in this deck.
Unlock Deck
k this deck
5
The larger the value of the calculated F ratio:
A)the more likely an observed difference is due to chance.
B)the larger the mean square within groups is compared to the mean square between groups.
C)the less likely an observed difference is due to chance.
D)the larger the sum of squares within groups is compared to the sum of squares between groups.
Unlock Deck
Unlock for access to all 51 flashcards in this deck.
Unlock Deck
k this deck
6
The distance or deviation of raw scores from their group mean is known as:
A)between-group variation.
B)variation within groups.
C)total variation.
D)none of the above
A)between-group variation.
B)variation within groups.
C)total variation.
D)none of the above
Unlock Deck
Unlock for access to all 51 flashcards in this deck.
Unlock Deck
k this deck
7
The formula for the total sum of squares, SStotal , is:
A)
B)
C)
D)
A)
B)
C)
D)
Unlock Deck
Unlock for access to all 51 flashcards in this deck.
Unlock Deck
k this deck
8
The sum of squares is the method for measuring variation:
A)within groups.
B)between groups.
C)for the total sample.
D)all of the above
A)within groups.
B)between groups.
C)for the total sample.
D)all of the above
Unlock Deck
Unlock for access to all 51 flashcards in this deck.
Unlock Deck
k this deck
9
In an analysis of variance with three groups, the null hypothesis states:
A)
B)
C)
D)
A)
B)
C)
D)
Unlock Deck
Unlock for access to all 51 flashcards in this deck.
Unlock Deck
k this deck
10
Which of the following is a requirement for computing the F ratio?
A)comparing two or more independent means
B)a normal distribution
C)random sampling
D)all of the above
A)comparing two or more independent means
B)a normal distribution
C)random sampling
D)all of the above
Unlock Deck
Unlock for access to all 51 flashcards in this deck.
Unlock Deck
k this deck
11
The normality assumption required for using an F ratio holds if
A)we draw small enough samples from each group.
B)the characteristic we are comparing between and within groups is biased.
C)we draw large enough samples from each group.
D)none of the above.
A)we draw small enough samples from each group.
B)the characteristic we are comparing between and within groups is biased.
C)we draw large enough samples from each group.
D)none of the above.
Unlock Deck
Unlock for access to all 51 flashcards in this deck.
Unlock Deck
k this deck
12
The question below refers to the following situation:
In an analysis of variance with 4 groups, each containing 12 respondents:
Calculate the between-group degrees of freedom.
A)20
B)44
C)3
D)47
In an analysis of variance with 4 groups, each containing 12 respondents:
Calculate the between-group degrees of freedom.
A)20
B)44
C)3
D)47
Unlock Deck
Unlock for access to all 51 flashcards in this deck.
Unlock Deck
k this deck
13
The distance or deviation of group means from one another is known as:
A)variation between groups.
B)within-group variation.
C)total variation.
D)none of the above
A)variation between groups.
B)within-group variation.
C)total variation.
D)none of the above
Unlock Deck
Unlock for access to all 51 flashcards in this deck.
Unlock Deck
k this deck
14
The formula for dfbetween is:
A)
B)
C)
D)
A)
B)
C)
D)
Unlock Deck
Unlock for access to all 51 flashcards in this deck.
Unlock Deck
k this deck
15
Which is NOT true of an analysis of variance?
A)The population variances are all assumed to be equal.
B)All samples must be selected randomly.
C)All data must be ordinal level data.
D )All of the above are untrue.
A)The population variances are all assumed to be equal.
B)All samples must be selected randomly.
C)All data must be ordinal level data.
D )All of the above are untrue.
Unlock Deck
Unlock for access to all 51 flashcards in this deck.
Unlock Deck
k this deck
16
The mean square is:
A)calculated by dividing the sum of squares within groups by the degrees of freedom within groups.
B)calculated by dividing the sum of squares between groups by the degrees of freedom between groups.
C)a method for assessing variation in conjunction with the sums of squares measures.
D)all of the above
Unlock Deck
Unlock for access to all 51 flashcards in this deck.
Unlock Deck
k this deck
17
The F ratio is calculated by:
A)dividing the degrees of freedom within by degrees of freedom between.
B)dividing the mean square between by the mean square within.
C)dividing the mean square within by the mean square between.
D)none of the above
A)dividing the degrees of freedom within by degrees of freedom between.
B)dividing the mean square between by the mean square within.
C)dividing the mean square within by the mean square between.
D)none of the above
Unlock Deck
Unlock for access to all 51 flashcards in this deck.
Unlock Deck
k this deck
18
The question below refers to the following situation:
In an analysis of variance with 4 groups, each containing 12 respondents:
Calculate the total degrees of freedom.
A)47
B)60
C)48
D)42
In an analysis of variance with 4 groups, each containing 12 respondents:
Calculate the total degrees of freedom.
A)47
B)60
C)48
D)42
Unlock Deck
Unlock for access to all 51 flashcards in this deck.
Unlock Deck
k this deck
19
In a one-way analysis of variance, the total variation is divisible into __________
Component(s).
A)1
B)2
C)3
D)4
Component(s).
A)1
B)2
C)3
D)4
Unlock Deck
Unlock for access to all 51 flashcards in this deck.
Unlock Deck
k this deck
20
We use the analysis of variance rather than the t ratio when more than two groups are Involved because:
A)it is less time consuming to make the necessary calculations.
B)it decreases the likelihood of making a Type 1 error.
C)the more statistical tests conducted, the more likely sampling error may cause statistically Significant findings.
D)all of the above
A)it is less time consuming to make the necessary calculations.
B)it decreases the likelihood of making a Type 1 error.
C)the more statistical tests conducted, the more likely sampling error may cause statistically Significant findings.
D)all of the above
Unlock Deck
Unlock for access to all 51 flashcards in this deck.
Unlock Deck
k this deck
21
The question below refers to the following situation:
A researcher is interested in the effects of family size on leisure time. He questions 16 families on the number of "free hours per week." He polls 4 families at each size, from 1 to 4 children. The data are as follows:
Calculate the total sum of squares.
A researcher is interested in the effects of family size on leisure time. He questions 16 families on the number of "free hours per week." He polls 4 families at each size, from 1 to 4 children. The data are as follows:
Calculate the total sum of squares.
Unlock Deck
Unlock for access to all 51 flashcards in this deck.
Unlock Deck
k this deck
22
The question below refers to the following situation:
A social researcher is interested in studying the relationship between religious affiliation
and years of education. Here is the data she is working with:
Calculate the total sum of squares.
A social researcher is interested in studying the relationship between religious affiliation
and years of education. Here is the data she is working with:
Calculate the total sum of squares.
Unlock Deck
Unlock for access to all 51 flashcards in this deck.
Unlock Deck
k this deck
23
The __________ sum of squares is defined as
Unlock Deck
Unlock for access to all 51 flashcards in this deck.
Unlock Deck
k this deck
24
Analysis of Variance is generally used to compare three or fewer groups.
Unlock Deck
Unlock for access to all 51 flashcards in this deck.
Unlock Deck
k this deck
25
The question below refers to the following situation:
A social researcher is interested in studying the relationship between religious affiliation and years of education. Here is the data she is working with:
Calculate the mean square within groups (MSwithin).
A social researcher is interested in studying the relationship between religious affiliation and years of education. Here is the data she is working with:
Calculate the mean square within groups (MSwithin).
Unlock Deck
Unlock for access to all 51 flashcards in this deck.
Unlock Deck
k this deck
26
In ANOVA, the dependent variable is measured at the interval level.
Unlock Deck
Unlock for access to all 51 flashcards in this deck.
Unlock Deck
k this deck
27
Analysis of variance should only be used on the __________ level of data.
Unlock Deck
Unlock for access to all 51 flashcards in this deck.
Unlock Deck
k this deck
28
The question below refers to the following situation:
A social researcher is interested in studying the relationship between religious affiliation and years of education. Here is the data she is working with:
What are your conclusions about the null hypothesis?
A social researcher is interested in studying the relationship between religious affiliation and years of education. Here is the data she is working with:
What are your conclusions about the null hypothesis?
Unlock Deck
Unlock for access to all 51 flashcards in this deck.
Unlock Deck
k this deck
29
The __________ sum of squares is defined as
Unlock Deck
Unlock for access to all 51 flashcards in this deck.
Unlock Deck
k this deck
30
The question below refers to the following situation:
A social researcher is interested in studying the relationship between religious affiliation and years of education. Here is the data she is working with:
Calculate the within-group sum of squares.
A social researcher is interested in studying the relationship between religious affiliation and years of education. Here is the data she is working with:
Calculate the within-group sum of squares.
Unlock Deck
Unlock for access to all 51 flashcards in this deck.
Unlock Deck
k this deck
31
Analysis of variance should be used on __________ or more independent means.
Unlock Deck
Unlock for access to all 51 flashcards in this deck.
Unlock Deck
k this deck
32
In Analysis of Variance if the F ratio is larger than the critical value the groups are the Same in the population.
Unlock Deck
Unlock for access to all 51 flashcards in this deck.
Unlock Deck
k this deck
33
The question below refers to the following situation:
A social researcher is interested in studying the relationship between religious affiliation and years of education. Here is the data she is working with:
Calculate the mean square between groups (MSbetween).
A social researcher is interested in studying the relationship between religious affiliation and years of education. Here is the data she is working with:
Calculate the mean square between groups (MSbetween).
Unlock Deck
Unlock for access to all 51 flashcards in this deck.
Unlock Deck
k this deck
34
In Analysis of Variance, the dependent variable is measured at the nominal level.
Unlock Deck
Unlock for access to all 51 flashcards in this deck.
Unlock Deck
k this deck
35
The __________ sum of squares is defined as
Unlock Deck
Unlock for access to all 51 flashcards in this deck.
Unlock Deck
k this deck
36
The question below refers to the following situation:
A social researcher is interested in studying the relationship between religious affiliation and years of education. Here is the data she is working with:
Calculate the between-group sum of squares.
A social researcher is interested in studying the relationship between religious affiliation and years of education. Here is the data she is working with:
Calculate the between-group sum of squares.
Unlock Deck
Unlock for access to all 51 flashcards in this deck.
Unlock Deck
k this deck
37
Groups in an analysis of variance are typically formed based on a __________ measure.
Unlock Deck
Unlock for access to all 51 flashcards in this deck.
Unlock Deck
k this deck
38
The question below refers to the following situation:
A social researcher is interested in studying the relationship between religious affiliation and years of education. Here is the data she is working with:
Calculate the F ratio.
A social researcher is interested in studying the relationship between religious affiliation and years of education. Here is the data she is working with:
Calculate the F ratio.
Unlock Deck
Unlock for access to all 51 flashcards in this deck.
Unlock Deck
k this deck
39
Analysis of variance yields a(n) __________ whose numerator represents variation between
groups being compared, and whose denominator contains an estimate of variation within
those groups.
groups being compared, and whose denominator contains an estimate of variation within
those groups.
Unlock Deck
Unlock for access to all 51 flashcards in this deck.
Unlock Deck
k this deck
40
The question below refers to the following situation:
A social researcher is interested in studying the relationship between religious affiliation and years of education. Here is the data she is working with:
Are your results statistically significant, and if so, at what level?
A social researcher is interested in studying the relationship between religious affiliation and years of education. Here is the data she is working with:
Are your results statistically significant, and if so, at what level?
Unlock Deck
Unlock for access to all 51 flashcards in this deck.
Unlock Deck
k this deck
41
The question below refers to the following situation:
A valet parking attendant is interested in whether daytime temperature affects the size of
tips. To study this question, she records the size of the tip given by her customers on 3
extremely hot summer days, 3 warm spring days, and 3 cold winter days. Complete an
analysis of variance to test the differences between mean tips with significance (α = .05), to
determine if the groups differ from each other.
Calculate mean square within.
Unlock Deck
Unlock for access to all 51 flashcards in this deck.
Unlock Deck
k this deck
42
The question below refers to the following situation:
A valet parking attendant is interested in whether daytime temperature affects the size of
tips. To study this question, she records the size of the tip given by her customers on 3
extremely hot summer days, 3 warm spring days, and 3 cold winter days. Complete an
analysis of variance to test the differences between mean tips with significance (α = .05), to
determine if the groups differ from each other.
Calculate F.
Unlock Deck
Unlock for access to all 51 flashcards in this deck.
Unlock Deck
k this deck
43
The question below refers to the following situation:
A valet parking attendant is interested in whether daytime temperature affects the size of tips. To study this question, she records the size of the tip given by her customers on 3 extremely hot summer days, 3 warm spring days, and 3 cold winter days. Complete an analysis of variance to test the differences between mean tips with significance (α = .05), to determine if the groups differ from each other.
What are your conclusions about the null hypothesis?
Unlock Deck
Unlock for access to all 51 flashcards in this deck.
Unlock Deck
k this deck
44
The question below refers to the following situation:
A valet parking attendant is interested in whether daytime temperature affects the size of
tips. To study this question, she records the size of the tip given by her customers on 3
extremely hot summer days, 3 warm spring days, and 3 cold winter days. Complete an
analysis of variance to test the differences between mean tips with significance (α = .05), to
determine if the groups differ from each other.
Calculate mean square between.
Unlock Deck
Unlock for access to all 51 flashcards in this deck.
Unlock Deck
k this deck
45
The question below refers to the following situation:
A valet parking attendant is interested in whether daytime temperature affects the size of
tips. To study this question, she records the size of the tip given by her customers on 3
extremely hot summer days, 3 warm spring days, and 3 cold winter days. Complete an
analysis of variance to test the differences between mean tips with significance (α = .05), to
determine if the groups differ from each other.
Calculate the within-group sum of squares.
Unlock Deck
Unlock for access to all 51 flashcards in this deck.
Unlock Deck
k this deck
46
The question below refers to the following situation:
A valet parking attendant is interested in whether daytime temperature affects the size of tips. To study this question, she records the size of the tip given by her customers on 3 extremely hot summer days, 3 warm spring days, and 3 cold winter days. Complete an analysis of variance to test the differences between mean tips with significance (α = .05), to determine if the groups differ from each other.
Calculate the between-group sum of squares.
Unlock Deck
Unlock for access to all 51 flashcards in this deck.
Unlock Deck
k this deck
47
The question below refers to the following situation:
A valet parking attendant is interested in whether daytime temperature affects the size of tips. To study this question, she records the size of the tip given by her customers on 3 extremely hot summer days, 3 warm spring days, and 3 cold winter days. Complete an analysis of variance to test the differences between mean tips with significance (α = .05), to determine if the groups differ from each other.
What is the research hypothesis?
Unlock Deck
Unlock for access to all 51 flashcards in this deck.
Unlock Deck
k this deck
48
The question below refers to the following situation:
A valet parking attendant is interested in whether daytime temperature affects the size of tips. To study this question, she records the size of the tip given by her customers on 3 extremely hot summer days, 3 warm spring days, and 3 cold winter days. Complete an analysis of variance to test the differences between mean tips with significance (α = .05), to determine if the groups differ from each other.
Calculate the total sum of squares.
Unlock Deck
Unlock for access to all 51 flashcards in this deck.
Unlock Deck
k this deck
49
The question below refers to the following situation:
A valet parking attendant is interested in whether daytime temperature affects the size of tips. To study this question, she records the size of the tip given by her customers on 3 extremely hot summer days, 3 warm spring days, and 3 cold winter days. Complete an analysis of variance to test the differences between mean tips with significance (α = .05), to determine if the groups differ from each other.
Are the results statistically significant and, if so, at what level?
Unlock Deck
Unlock for access to all 51 flashcards in this deck.
Unlock Deck
k this deck
50
The question below refers to the following situation:
A researcher is interested in the effects of family size on leisure time. He questions 16 families on the number of "free hours per week." He polls 4 families at each size, from 1 to 4 children. The data are as follows:
Calculate the mean square between groups.
A researcher is interested in the effects of family size on leisure time. He questions 16 families on the number of "free hours per week." He polls 4 families at each size, from 1 to 4 children. The data are as follows:
Calculate the mean square between groups.
Unlock Deck
Unlock for access to all 51 flashcards in this deck.
Unlock Deck
k this deck
51
The question below refers to the following situation:
A valet parking attendant is interested in whether daytime temperature affects the size of tips. To study this question, she records the size of the tip given by her customers on 3 extremely hot summer days, 3 warm spring days, and 3 cold winter days. Complete an analysis of variance to test the differences between mean tips with significance (α = .05), to determine if the groups differ from each other.
What is the null hypothesis?
Unlock Deck
Unlock for access to all 51 flashcards in this deck.
Unlock Deck
k this deck
Unlock Deck
Unlock for access to all 51 flashcards in this deck.


