Deck 2: Organizing the Data
Full screen (f)
Question
Question
The question below refers to the following frequency table of quiz scores:
Given the following frequency distribution: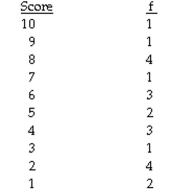
The cumulative percentage (c%) is defined as:
A)
B)
C)
D)
Given the following frequency distribution:
The cumulative percentage (c%) is defined as:
A)
B)
C)
D)
Question
Question
The formula to construct the midpoint (m) of a class interval is
A)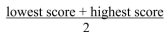
B)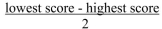
C)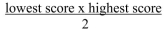
D)
A)
B)
C)
D)
Question
The question below refers to the following frequency table of quiz scores:
Given the following frequency distribution: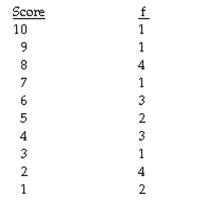
What is the cumulative frequency of score 6?
A)14
B)15
C)16
D)22
Given the following frequency distribution:
What is the cumulative frequency of score 6?
A)14
B)15
C)16
D)22
Question
Question
The question below refers to the following frequency table of quiz scores:
Given the following frequency distribution: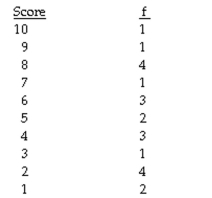
What is the cumulative percentage of score 6?
A)32
B).68
C)32%
D)68%
Given the following frequency distribution:
What is the cumulative percentage of score 6?
A)32
B).68
C)32%
D)68%
Question
Question
Question
Question
The question below refers to the following list of test scores:
Given the following raw data of test scores:
The cumulative frequency of a score of 74 is:
A)10.
B)8.
C)7.
D)6.
Given the following raw data of test scores:
The cumulative frequency of a score of 74 is:
A)10.
B)8.
C)7.
D)6.
Question
Question
Question
The question below refers to the following frequency table of quiz scores:
Given the following frequency distribution: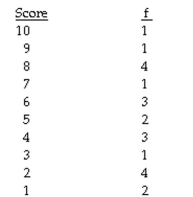
What is the N (total) in the above table?
A)20
B)21
C)22
D)24
Given the following frequency distribution:
What is the N (total) in the above table?
A)20
B)21
C)22
D)24
Question
Question
Question
Question
The question below refers to the following frequency table of quiz scores:
Given the following frequency distribution: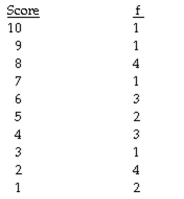
Cumulative frequencies are defined as:
A)the total number of cases having any given score or a score that is higher.
B)the half number of cases having any given score or a score that is lower.
C)the total number of cases having any given score or a score that is lower.
D)the half number of cases having any given score or a score that is lower..
Question
Question
Question
A survey examined the relationship between political party affiliation and gender. The
following cross-tabulation presents the data.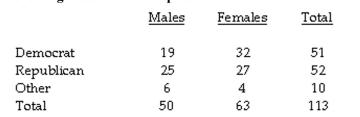
Calculate total percents for each cell.
following cross-tabulation presents the data.
Calculate total percents for each cell.
Question
Question
Question
Question
Question
A survey examined the relationship between political party affiliation and gender. The
following cross-tabulation presents the data.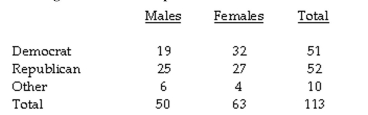
In the above cross-tabulation, the __________variable, gender, is on the columns.
following cross-tabulation presents the data.
In the above cross-tabulation, the __________variable, gender, is on the columns.
Question
A survey examined the relationship between political party affiliation and gender. The
following cross-tabulation presents the data.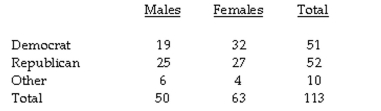
Calculate column percents.
following cross-tabulation presents the data.
Calculate column percents.
Question
Question
Question
Question
Question
Question

Unlock Deck
Sign up to unlock the cards in this deck!
Unlock Deck
Unlock Deck
1/33
Play
Full screen (f)
Deck 2: Organizing the Data
1
Kurtosis refers to:
A)the peakedness of a distribution.
B)the skewness of a distribution.
C)the cumulative frequency of a distribution.
D)the symmetry of a distribution.
A)the peakedness of a distribution.
B)the skewness of a distribution.
C)the cumulative frequency of a distribution.
D)the symmetry of a distribution.
the peakedness of a distribution.
2
The question below refers to the following frequency table of quiz scores:
Given the following frequency distribution:
The cumulative percentage (c%) is defined as:
A)
B)
C)
D)
Given the following frequency distribution:
The cumulative percentage (c%) is defined as:
A)
B)
C)
D)
3
Pie charts are particularly useful for what type of data?
A)nominal level data
B)ordinal level data
C)interval level data
D)none of the above
A)nominal level data
B)ordinal level data
C)interval level data
D)none of the above
nominal level data
4
The formula to construct the midpoint (m) of a class interval is
A)
B)
C)
D)
A)
B)
C)
D)
Unlock Deck
Unlock for access to all 33 flashcards in this deck.
Unlock Deck
k this deck
5
The question below refers to the following frequency table of quiz scores:
Given the following frequency distribution:
What is the cumulative frequency of score 6?
A)14
B)15
C)16
D)22
Given the following frequency distribution:
What is the cumulative frequency of score 6?
A)14
B)15
C)16
D)22
Unlock Deck
Unlock for access to all 33 flashcards in this deck.
Unlock Deck
k this deck
6
Skewness refers to:
A)a symmetrical distribution of scores.
B)having more extreme cases in one direction and not the other.
C)the central limit theorem.
D)none of the above
A)a symmetrical distribution of scores.
B)having more extreme cases in one direction and not the other.
C)the central limit theorem.
D)none of the above
Unlock Deck
Unlock for access to all 33 flashcards in this deck.
Unlock Deck
k this deck
7
The question below refers to the following frequency table of quiz scores:
Given the following frequency distribution:
What is the cumulative percentage of score 6?
A)32
B).68
C)32%
D)68%
Given the following frequency distribution:
What is the cumulative percentage of score 6?
A)32
B).68
C)32%
D)68%
Unlock Deck
Unlock for access to all 33 flashcards in this deck.
Unlock Deck
k this deck
8
The question below refers to the following:
A national poll prior to a presidential election determines that 16 states can be classified as Blue (Democratic), 19 states as Red (Republican), and 15 states as Purple (undecided).
What proportion of states are Blue?
A).30
B).38
C).32
D).24
A national poll prior to a presidential election determines that 16 states can be classified as Blue (Democratic), 19 states as Red (Republican), and 15 states as Purple (undecided).
What proportion of states are Blue?
A).30
B).38
C).32
D).24
Unlock Deck
Unlock for access to all 33 flashcards in this deck.
Unlock Deck
k this deck
9
In a cross tabulation, if the independent variable is on the rows, use __________ percents.
A)total
B)column
C)row
D)diagonal
A)total
B)column
C)row
D)diagonal
Unlock Deck
Unlock for access to all 33 flashcards in this deck.
Unlock Deck
k this deck
10
The question below refers to the following:
A national poll prior to a presidential election determines that 16 states can be classified as Blue (Democratic), 19 states as Red (Republican), and 15 states as Purple (undecided).
What percentage of states are Red?
A)30%
B)38%
C)32%
D)24%
A national poll prior to a presidential election determines that 16 states can be classified as Blue (Democratic), 19 states as Red (Republican), and 15 states as Purple (undecided).
What percentage of states are Red?
A)30%
B)38%
C)32%
D)24%
Unlock Deck
Unlock for access to all 33 flashcards in this deck.
Unlock Deck
k this deck
11
The question below refers to the following list of test scores:
Given the following raw data of test scores:
The cumulative frequency of a score of 74 is:
A)10.
B)8.
C)7.
D)6.
Given the following raw data of test scores:
The cumulative frequency of a score of 74 is:
A)10.
B)8.
C)7.
D)6.
Unlock Deck
Unlock for access to all 33 flashcards in this deck.
Unlock Deck
k this deck
12
The midpoint of the class interval 90-99 is:
A)93
B)95
C)94.5
D)94
A)93
B)95
C)94.5
D)94
Unlock Deck
Unlock for access to all 33 flashcards in this deck.
Unlock Deck
k this deck
13
When organizing a frequency table for a variable measured at the ordinal level:
A)categories may be arranged from lowest to highest.
B)categories are not in order.
C)categories may be arranged from highest to lowest.
D)a & c
A)categories may be arranged from lowest to highest.
B)categories are not in order.
C)categories may be arranged from highest to lowest.
D)a & c
Unlock Deck
Unlock for access to all 33 flashcards in this deck.
Unlock Deck
k this deck
14
The question below refers to the following frequency table of quiz scores:
Given the following frequency distribution:
What is the N (total) in the above table?
A)20
B)21
C)22
D)24
Given the following frequency distribution:
What is the N (total) in the above table?
A)20
B)21
C)22
D)24
Unlock Deck
Unlock for access to all 33 flashcards in this deck.
Unlock Deck
k this deck
15
When organizing a frequency table for a variable measured at the nominal level:
A)the table should have a title that gives the reader an idea about the nature of the data presented.
B)the table should have 2 columns.
C)the table should never have more than 5 rows.
D)a & b
A)the table should have a title that gives the reader an idea about the nature of the data presented.
B)the table should have 2 columns.
C)the table should never have more than 5 rows.
D)a & b
Unlock Deck
Unlock for access to all 33 flashcards in this deck.
Unlock Deck
k this deck
16
The question below refers to the following list of test scores:
Given the following raw data of test scores:
51, 58, 62, 62, 66, 74, 79, 79, 80, 80, 80, 80, 91, 93, 93, 93
The cumulative percent of a score of 79 is:
A)55%.
B)50%.
C)38%.
D)24%.
Given the following raw data of test scores:
51, 58, 62, 62, 66, 74, 79, 79, 80, 80, 80, 80, 91, 93, 93, 93
The cumulative percent of a score of 79 is:
A)55%.
B)50%.
C)38%.
D)24%.
Unlock Deck
Unlock for access to all 33 flashcards in this deck.
Unlock Deck
k this deck
17
The question below refers to the following:
A national poll prior to a presidential election determines that 16 states can be classified as
Blue (Democratic), 19 states as Red (Republican), and 15 states as Purple (undecided).
What percentage of states are Blue and Purple?
A)66%
B)38%
C)23%
D)62%
A national poll prior to a presidential election determines that 16 states can be classified as
Blue (Democratic), 19 states as Red (Republican), and 15 states as Purple (undecided).
What percentage of states are Blue and Purple?
A)66%
B)38%
C)23%
D)62%
Unlock Deck
Unlock for access to all 33 flashcards in this deck.
Unlock Deck
k this deck
18
The question below refers to the following frequency table of quiz scores:
Given the following frequency distribution:
Cumulative frequencies are defined as:
A)the total number of cases having any given score or a score that is higher.
B)the half number of cases having any given score or a score that is lower.
C)the total number of cases having any given score or a score that is lower.
D)the half number of cases having any given score or a score that is lower..
Unlock Deck
Unlock for access to all 33 flashcards in this deck.
Unlock Deck
k this deck
19
The question below refers to the following list of test scores:
Given the following raw data of test scores:
51, 58, 62, 62, 66, 74, 79, 79, 80, 80, 80, 80, 91, 93, 93, 93
In the above scenario, having a cumulative percent of 50% for a score of 79 means that:
A)79% scored higher than a 50 on the test.
B)50% scored higher than a 79 on the test.
C)79% scored at or below a 50 on the test.
D)50% scored at or below a 79 on the test.
Unlock Deck
Unlock for access to all 33 flashcards in this deck.
Unlock Deck
k this deck
20
The midpoint of the class interval 60-65 is:
A)62.5
B)63
C)62
D)63.5
A)62.5
B)63
C)62
D)63.5
Unlock Deck
Unlock for access to all 33 flashcards in this deck.
Unlock Deck
k this deck
21
A survey examined the relationship between political party affiliation and gender. The
following cross-tabulation presents the data.
Calculate total percents for each cell.
following cross-tabulation presents the data.
Calculate total percents for each cell.
Unlock Deck
Unlock for access to all 33 flashcards in this deck.
Unlock Deck
k this deck
22
We call a normal curve __________ because folding it at the center creates two identical
halves.
halves.
Unlock Deck
Unlock for access to all 33 flashcards in this deck.
Unlock Deck
k this deck
23
__________ scores on one side of a distribution will cause skewness.
Unlock Deck
Unlock for access to all 33 flashcards in this deck.
Unlock Deck
k this deck
24
A positively skewed distribution has its tail on the __________.
Unlock Deck
Unlock for access to all 33 flashcards in this deck.
Unlock Deck
k this deck
25
A __________ is the frequency of occurrence of a category per 100 cases.
Unlock Deck
Unlock for access to all 33 flashcards in this deck.
Unlock Deck
k this deck
26
A survey examined the relationship between political party affiliation and gender. The
following cross-tabulation presents the data.
In the above cross-tabulation, the __________variable, gender, is on the columns.
following cross-tabulation presents the data.
In the above cross-tabulation, the __________variable, gender, is on the columns.
Unlock Deck
Unlock for access to all 33 flashcards in this deck.
Unlock Deck
k this deck
27
A survey examined the relationship between political party affiliation and gender. The
following cross-tabulation presents the data.
Calculate column percents.
following cross-tabulation presents the data.
Calculate column percents.
Unlock Deck
Unlock for access to all 33 flashcards in this deck.
Unlock Deck
k this deck
28
The terms bar graph and __________ are often used interchangeably, although the latter
has its bars joined to emphasize continuity.
has its bars joined to emphasize continuity.
Unlock Deck
Unlock for access to all 33 flashcards in this deck.
Unlock Deck
k this deck
29
A __________ skewed distribution has its tail on the left.
Unlock Deck
Unlock for access to all 33 flashcards in this deck.
Unlock Deck
k this deck
30
A platykurtic distribution tends to be rather __________.
Unlock Deck
Unlock for access to all 33 flashcards in this deck.
Unlock Deck
k this deck
31
__________-level scores can be presented in a grouped frequency distribution to clarify
presentation.
presentation.
Unlock Deck
Unlock for access to all 33 flashcards in this deck.
Unlock Deck
k this deck
32
A __________ is a table that presents the distribution (frequencies and percents) of one
variable across the categories of one or more additional variables.
variable across the categories of one or more additional variables.
Unlock Deck
Unlock for access to all 33 flashcards in this deck.
Unlock Deck
k this deck
33
A proportion compares the __________ of a variable to the total number of cases.
Unlock Deck
Unlock for access to all 33 flashcards in this deck.
Unlock Deck
k this deck
Unlock Deck
Unlock for access to all 33 flashcards in this deck.


