Deck 3: Relationships Between Categorical Variablescontingency Tables
Full screen (f)
Question
A company interested in the health of its employees started a health program including monitoring blood pressure.Based on age, employees were categorized according to ranges of
Blood pressure by age intervals.Data are shown in the table below.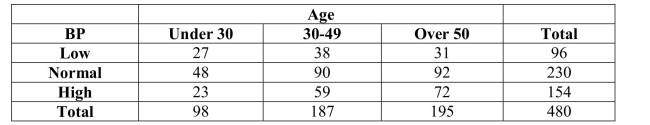 Of all employees, the percentage who are over 50 and have high blood pressure is
A)46.8% (72/154).
B)15.0% (72/480).
C)31.6% (59/187).
D)36.9% (72/195).
E)47.2% (92/195).
Blood pressure by age intervals.Data are shown in the table below.
Of all employees, the percentage who are over 50 and have high blood pressure isA)46.8% (72/154).
B)15.0% (72/480).
C)31.6% (59/187).
D)36.9% (72/195).
E)47.2% (92/195).
Question
The following is a bar chart summarizing educational attainment in the US in 2017. 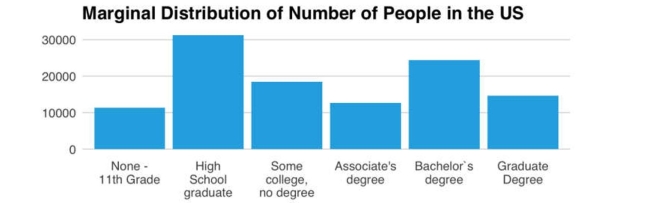 This bar chart shows
A)the marginal distribution of educational attainment.
B)the conditional distribution of educational attainment.
C)the contingency distribution of educational attainment.
D)the distribution for a quantitative variable.
E)none of the above.
This bar chart showsA)the marginal distribution of educational attainment.
B)the conditional distribution of educational attainment.
C)the contingency distribution of educational attainment.
D)the distribution for a quantitative variable.
E)none of the above.
Question
A regional survey was carried out to gauge public opinion on the controversial Arizona Immigration Law (results shown below).Of respondents who oppose the law, what percent
Is Democrat?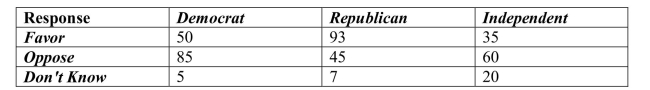
A)13%
B)35%
C)22%
D)45%
E)6
Is Democrat?
A)13%
B)35%
C)22%
D)45%
E)6
Question
The US Census reported the following counts for various education levels by gender in December 2017.. 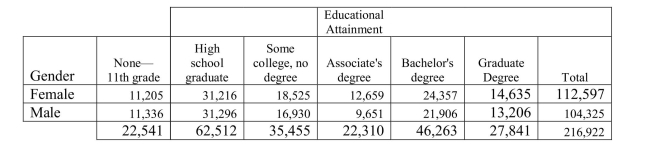 The percentage of those who have attained a Graduate Degree and are male is
A)48.1 % (104325 / 216922)
B)6.1 % (13206 / 216922)
C)12.7 % (13206/ 104325)
D)90.2 % (13206 / 14635)
E)47.4 % (13206 / 27841)
The percentage of those who have attained a Graduate Degree and are male isA)48.1 % (104325 / 216922)
B)6.1 % (13206 / 216922)
C)12.7 % (13206/ 104325)
D)90.2 % (13206 / 14635)
E)47.4 % (13206 / 27841)
Question
A regional survey was carried out to gauge public opinion on the controversial Arizona Immigration Law.The results are displayed in the segmented bar chart below.Which of the
Following statements is true?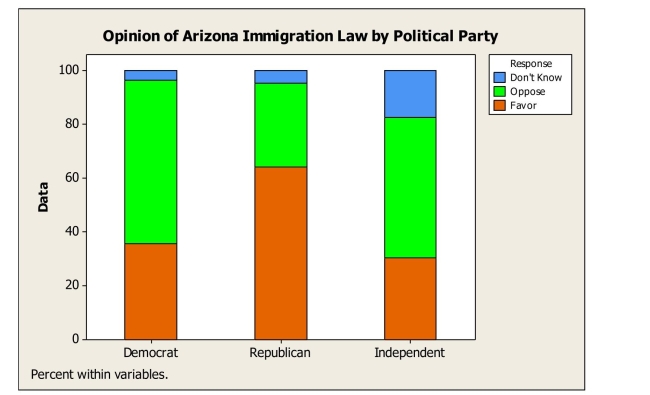
A)A greater percentage of Republicans oppose the law compared to Democrats.
B)A greater percentage of Republicans oppose the law compared to Independents.
C)Opinion about the law appears to be independent of political party affiliation.
D)A greater percentage of Democrats oppose the law compared to Republicans.
E)The segmented bar chart is not appropriate for these data.
Question
Here is a stacked bar chart for data collected about employee blood pressure. 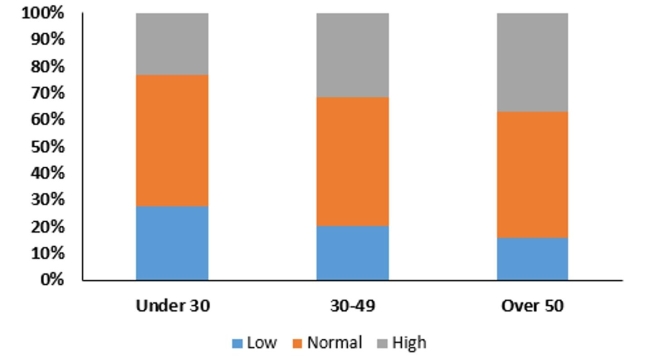 This chart shows
A)the distribution of a quantitative variable.
B)the contingency distribution of blood pressure type.
C)the conditional distribution of blood pressure type.
D)the marginal distribution of blood pressure type.
E)the joint distribution of blood pressure type.
This chart showsA)the distribution of a quantitative variable.
B)the contingency distribution of blood pressure type.
C)the conditional distribution of blood pressure type.
D)the marginal distribution of blood pressure type.
E)the joint distribution of blood pressure type.
Question
The US Census reported the following counts for various education levels by gender in December 2017.. 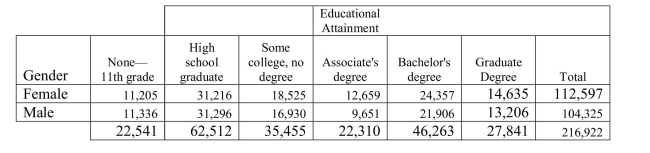 The percentage of females who have attained an Associate's degree is
A)11.2 % (12659 / 112597)
B)5.8 % (12659 / 216922)
C)16.4 % (18525 / 112597)
D)10.3 % (22310 / 216922)
E)56.7 % (12659 / 22310)
The percentage of females who have attained an Associate's degree isA)11.2 % (12659 / 112597)
B)5.8 % (12659 / 216922)
C)16.4 % (18525 / 112597)
D)10.3 % (22310 / 216922)
E)56.7 % (12659 / 22310)
Question
A company interested in the health of its employees started a health program including monitoring blood pressure.Based on age, employees were categorized according to ranges of
Blood pressure by age intervals.Data are shown in the table below.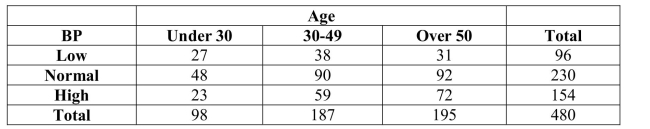 The percentage of employees with normal or low blood pressure is
A)67.9% (326/480).
B)47.9% (230/480).
C)41.7% (96/230).
D)80.0% (384/480).
E)20.0% (96/480).
Blood pressure by age intervals.Data are shown in the table below.
The percentage of employees with normal or low blood pressure isA)67.9% (326/480).
B)47.9% (230/480).
C)41.7% (96/230).
D)80.0% (384/480).
E)20.0% (96/480).
Question
A regional survey was carried out to gauge public opinion on the controversial Arizona Immigration Law (results shown below).How many respondents are Republican and favor
The law?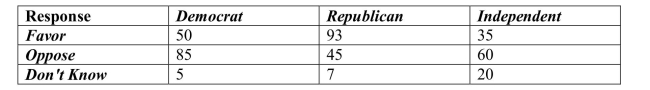
A)93
B)45
C)145
D)7
E)85
The law?
A)93
B)45
C)145
D)7
E)85
Question
A regional survey was carried out to gauge public opinion on the controversial Arizona Immigration Law (results shown below).What percent oppose the law? 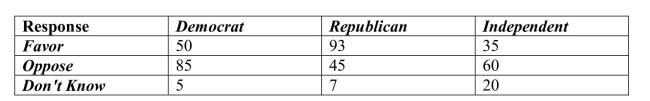
A)48%
B)45%
C)32%
D)25%
E)61%
A)48%
B)45%
C)32%
D)25%
E)61%
Question
A regional survey was carried out to gauge public opinion on the controversial Arizona Immigration Law.Based on the results displayed in the table below, what percent of
Respondents is Independent?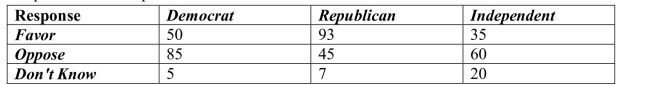
A)35%
B)9%
C)29%
D)45%
E)25%
Respondents is Independent?
A)35%
B)9%
C)29%
D)45%
E)25%
Question
A company interested in the health of its employees started a health program including monitoring blood pressure.Based on age, employees were categorized according to ranges of
Blood pressure by age intervals.Data are shown in the table below.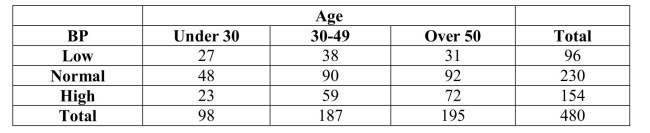 Of all employees, the percentage of those under 50 years old is
A)17.1% (82/480).
B)40.6% (195/480).
C)13.5% (65/480).
D)36.9% (72/195).
E)49.4% (285/480).
Blood pressure by age intervals.Data are shown in the table below.
Of all employees, the percentage of those under 50 years old isA)17.1% (82/480).
B)40.6% (195/480).
C)13.5% (65/480).
D)36.9% (72/195).
E)49.4% (285/480).
Question
A regional survey was carried out to gauge public opinion on the controversial Arizona Immigration Law (results shown below).Of respondents who are Democrat, what percent
Oppose the law?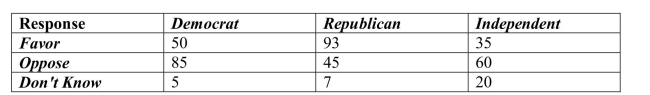
A)13%
B)35%
C)22%
D)45%
E)61%
Oppose the law?
A)13%
B)35%
C)22%
D)45%
E)61%
Question
Based on the side-by-side bar chart summarizing educational attainment by gender, which of the following statement(s) are true? 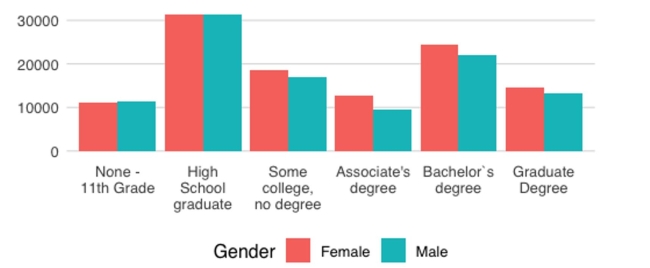
A)It appears that educational attainment and gender are at least somewhat related.
B)If High School graduates are ignored, it appears that educational attainment and gender are independent.
C)If High School graduates are ignored, it is not obvious that educational attainment and gender are independent.
D)More males than females have a Graduate degree.
E)More females than males have a Bachelor's degree.
Question
Question
Accenture, a consulting firm, conducted an online survey of 500 US consumers from in 2013. 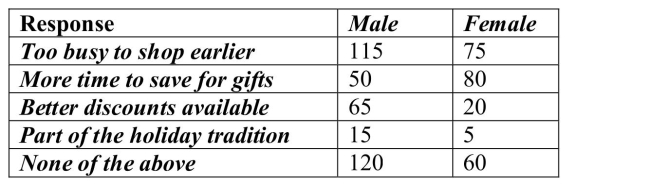 What percentage of those who thought that better discounts were available on "Black Friday" were female?
A)81.3%
B)33.3%
C)11.1%
D)47.2%
E)23.5%
What percentage of those who thought that better discounts were available on "Black Friday" were female?A)81.3%
B)33.3%
C)11.1%
D)47.2%
E)23.5%
Question
Accenture, a consulting firm, conducted an online survey of 500 US consumers from in 2013. 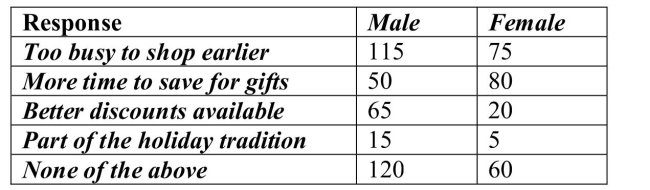 What percentage of men were felt that better discounts were available on "Black Friday"?
A)26.5%
B)65%
C)20%
D)17.8%
E)5.5%
What percentage of men were felt that better discounts were available on "Black Friday"?A)26.5%
B)65%
C)20%
D)17.8%
E)5.5%
Question
The US Census reported the following counts for various education levels by gender in December 2017.. 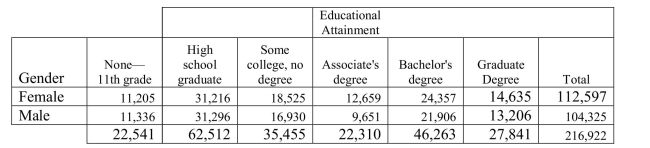 Of those who have attained a Graduate Degree, the percentage of males is
A)48.1 % (104325 / 216922)
B)6.1 % (13206 / 216922)
C)12.7 % (13206/ 104325)
D)90.2 % (13206 / 14635)
E)47.4 % (13206 / 27841)
Of those who have attained a Graduate Degree, the percentage of males isA)48.1 % (104325 / 216922)
B)6.1 % (13206 / 216922)
C)12.7 % (13206/ 104325)
D)90.2 % (13206 / 14635)
E)47.4 % (13206 / 27841)
Question
A company interested in the health of its employees started a health program including monitoring blood pressure.Based on age, employees were categorized according to ranges of
Blood pressure by age intervals.Data are shown in the table below.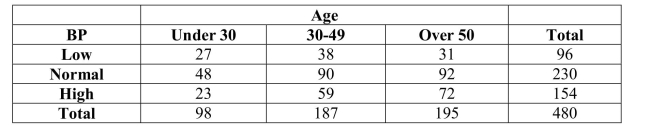 The percentage of employees who are over age 50 and have high blood pressure is
A)46.8% (72/154).
B)32.1% (154/480).
C)31.6% (59/187).
D)36.9% (72/195).
E)15.0% (72/480).
Blood pressure by age intervals.Data are shown in the table below.
The percentage of employees who are over age 50 and have high blood pressure isA)46.8% (72/154).
B)32.1% (154/480).
C)31.6% (59/187).
D)36.9% (72/195).
E)15.0% (72/480).

Unlock Deck
Sign up to unlock the cards in this deck!
Unlock Deck
Unlock Deck
1/19
Play
Full screen (f)
Deck 3: Relationships Between Categorical Variablescontingency Tables
1
A company interested in the health of its employees started a health program including monitoring blood pressure.Based on age, employees were categorized according to ranges of
Blood pressure by age intervals.Data are shown in the table below. Of all employees, the percentage who are over 50 and have high blood pressure is
A)46.8% (72/154).
B)15.0% (72/480).
C)31.6% (59/187).
D)36.9% (72/195).
E)47.2% (92/195).
Blood pressure by age intervals.Data are shown in the table below.
Of all employees, the percentage who are over 50 and have high blood pressure isA)46.8% (72/154).
B)15.0% (72/480).
C)31.6% (59/187).
D)36.9% (72/195).
E)47.2% (92/195).
B
2
The following is a bar chart summarizing educational attainment in the US in 2017. This bar chart shows
A)the marginal distribution of educational attainment.
B)the conditional distribution of educational attainment.
C)the contingency distribution of educational attainment.
D)the distribution for a quantitative variable.
E)none of the above.
This bar chart showsA)the marginal distribution of educational attainment.
B)the conditional distribution of educational attainment.
C)the contingency distribution of educational attainment.
D)the distribution for a quantitative variable.
E)none of the above.
A
3
A regional survey was carried out to gauge public opinion on the controversial Arizona Immigration Law (results shown below).Of respondents who oppose the law, what percent
Is Democrat?
A)13%
B)35%
C)22%
D)45%
E)6
Is Democrat?
A)13%
B)35%
C)22%
D)45%
E)6
D
4
The US Census reported the following counts for various education levels by gender in December 2017.. The percentage of those who have attained a Graduate Degree and are male is
A)48.1 % (104325 / 216922)
B)6.1 % (13206 / 216922)
C)12.7 % (13206/ 104325)
D)90.2 % (13206 / 14635)
E)47.4 % (13206 / 27841)
The percentage of those who have attained a Graduate Degree and are male isA)48.1 % (104325 / 216922)
B)6.1 % (13206 / 216922)
C)12.7 % (13206/ 104325)
D)90.2 % (13206 / 14635)
E)47.4 % (13206 / 27841)
Unlock Deck
Unlock for access to all 19 flashcards in this deck.
Unlock Deck
k this deck
5
A regional survey was carried out to gauge public opinion on the controversial Arizona Immigration Law.The results are displayed in the segmented bar chart below.Which of the
Following statements is true?
A)A greater percentage of Republicans oppose the law compared to Democrats.
B)A greater percentage of Republicans oppose the law compared to Independents.
C)Opinion about the law appears to be independent of political party affiliation.
D)A greater percentage of Democrats oppose the law compared to Republicans.
E)The segmented bar chart is not appropriate for these data.
Following statements is true?
A)A greater percentage of Republicans oppose the law compared to Democrats.
B)A greater percentage of Republicans oppose the law compared to Independents.
C)Opinion about the law appears to be independent of political party affiliation.
D)A greater percentage of Democrats oppose the law compared to Republicans.
E)The segmented bar chart is not appropriate for these data.
Unlock Deck
Unlock for access to all 19 flashcards in this deck.
Unlock Deck
k this deck
6
Here is a stacked bar chart for data collected about employee blood pressure. This chart shows
A)the distribution of a quantitative variable.
B)the contingency distribution of blood pressure type.
C)the conditional distribution of blood pressure type.
D)the marginal distribution of blood pressure type.
E)the joint distribution of blood pressure type.
This chart showsA)the distribution of a quantitative variable.
B)the contingency distribution of blood pressure type.
C)the conditional distribution of blood pressure type.
D)the marginal distribution of blood pressure type.
E)the joint distribution of blood pressure type.
Unlock Deck
Unlock for access to all 19 flashcards in this deck.
Unlock Deck
k this deck
7
The US Census reported the following counts for various education levels by gender in December 2017.. The percentage of females who have attained an Associate's degree is
A)11.2 % (12659 / 112597)
B)5.8 % (12659 / 216922)
C)16.4 % (18525 / 112597)
D)10.3 % (22310 / 216922)
E)56.7 % (12659 / 22310)
The percentage of females who have attained an Associate's degree isA)11.2 % (12659 / 112597)
B)5.8 % (12659 / 216922)
C)16.4 % (18525 / 112597)
D)10.3 % (22310 / 216922)
E)56.7 % (12659 / 22310)
Unlock Deck
Unlock for access to all 19 flashcards in this deck.
Unlock Deck
k this deck
8
A company interested in the health of its employees started a health program including monitoring blood pressure.Based on age, employees were categorized according to ranges of
Blood pressure by age intervals.Data are shown in the table below. The percentage of employees with normal or low blood pressure is
A)67.9% (326/480).
B)47.9% (230/480).
C)41.7% (96/230).
D)80.0% (384/480).
E)20.0% (96/480).
Blood pressure by age intervals.Data are shown in the table below.
The percentage of employees with normal or low blood pressure isA)67.9% (326/480).
B)47.9% (230/480).
C)41.7% (96/230).
D)80.0% (384/480).
E)20.0% (96/480).
Unlock Deck
Unlock for access to all 19 flashcards in this deck.
Unlock Deck
k this deck
9
A regional survey was carried out to gauge public opinion on the controversial Arizona Immigration Law (results shown below).How many respondents are Republican and favor
The law?
A)93
B)45
C)145
D)7
E)85
The law?
A)93
B)45
C)145
D)7
E)85
Unlock Deck
Unlock for access to all 19 flashcards in this deck.
Unlock Deck
k this deck
10
A regional survey was carried out to gauge public opinion on the controversial Arizona Immigration Law (results shown below).What percent oppose the law?
A)48%
B)45%
C)32%
D)25%
E)61%
A)48%
B)45%
C)32%
D)25%
E)61%
Unlock Deck
Unlock for access to all 19 flashcards in this deck.
Unlock Deck
k this deck
11
A regional survey was carried out to gauge public opinion on the controversial Arizona Immigration Law.Based on the results displayed in the table below, what percent of
Respondents is Independent?
A)35%
B)9%
C)29%
D)45%
E)25%
Respondents is Independent?
A)35%
B)9%
C)29%
D)45%
E)25%
Unlock Deck
Unlock for access to all 19 flashcards in this deck.
Unlock Deck
k this deck
12
A company interested in the health of its employees started a health program including monitoring blood pressure.Based on age, employees were categorized according to ranges of
Blood pressure by age intervals.Data are shown in the table below. Of all employees, the percentage of those under 50 years old is
A)17.1% (82/480).
B)40.6% (195/480).
C)13.5% (65/480).
D)36.9% (72/195).
E)49.4% (285/480).
Blood pressure by age intervals.Data are shown in the table below.
Of all employees, the percentage of those under 50 years old isA)17.1% (82/480).
B)40.6% (195/480).
C)13.5% (65/480).
D)36.9% (72/195).
E)49.4% (285/480).
Unlock Deck
Unlock for access to all 19 flashcards in this deck.
Unlock Deck
k this deck
13
A regional survey was carried out to gauge public opinion on the controversial Arizona Immigration Law (results shown below).Of respondents who are Democrat, what percent
Oppose the law?
A)13%
B)35%
C)22%
D)45%
E)61%
Oppose the law?
A)13%
B)35%
C)22%
D)45%
E)61%
Unlock Deck
Unlock for access to all 19 flashcards in this deck.
Unlock Deck
k this deck
14
Based on the side-by-side bar chart summarizing educational attainment by gender, which of the following statement(s) are true?
A)It appears that educational attainment and gender are at least somewhat related.
B)If High School graduates are ignored, it appears that educational attainment and gender are independent.
C)If High School graduates are ignored, it is not obvious that educational attainment and gender are independent.
D)More males than females have a Graduate degree.
E)More females than males have a Bachelor's degree.
Unlock Deck
Unlock for access to all 19 flashcards in this deck.
Unlock Deck
k this deck
15
In May, 2010, the Pew Research Center for the People & the Press carried out a national survey to gauge opinion on the Arizona Immigration Law.Responses (Favor, Oppose, Don't
Know) were examined according to groups defined by political party affiliation (Democrat,
Republican, Independent).Which of the following would be appropriate for displaying these
Data?
A)Contingency table.
B)Pie charts.
C)Segmented bar chart.
D)Side by side bar chart.
E)All of the above.
Know) were examined according to groups defined by political party affiliation (Democrat,
Republican, Independent).Which of the following would be appropriate for displaying these
Data?
A)Contingency table.
B)Pie charts.
C)Segmented bar chart.
D)Side by side bar chart.
E)All of the above.
Unlock Deck
Unlock for access to all 19 flashcards in this deck.
Unlock Deck
k this deck
16
Accenture, a consulting firm, conducted an online survey of 500 US consumers from in 2013. What percentage of those who thought that better discounts were available on "Black Friday" were female?
A)81.3%
B)33.3%
C)11.1%
D)47.2%
E)23.5%
What percentage of those who thought that better discounts were available on "Black Friday" were female?A)81.3%
B)33.3%
C)11.1%
D)47.2%
E)23.5%
Unlock Deck
Unlock for access to all 19 flashcards in this deck.
Unlock Deck
k this deck
17
Accenture, a consulting firm, conducted an online survey of 500 US consumers from in 2013. What percentage of men were felt that better discounts were available on "Black Friday"?
A)26.5%
B)65%
C)20%
D)17.8%
E)5.5%
What percentage of men were felt that better discounts were available on "Black Friday"?A)26.5%
B)65%
C)20%
D)17.8%
E)5.5%
Unlock Deck
Unlock for access to all 19 flashcards in this deck.
Unlock Deck
k this deck
18
The US Census reported the following counts for various education levels by gender in December 2017.. Of those who have attained a Graduate Degree, the percentage of males is
A)48.1 % (104325 / 216922)
B)6.1 % (13206 / 216922)
C)12.7 % (13206/ 104325)
D)90.2 % (13206 / 14635)
E)47.4 % (13206 / 27841)
Of those who have attained a Graduate Degree, the percentage of males isA)48.1 % (104325 / 216922)
B)6.1 % (13206 / 216922)
C)12.7 % (13206/ 104325)
D)90.2 % (13206 / 14635)
E)47.4 % (13206 / 27841)
Unlock Deck
Unlock for access to all 19 flashcards in this deck.
Unlock Deck
k this deck
19
A company interested in the health of its employees started a health program including monitoring blood pressure.Based on age, employees were categorized according to ranges of
Blood pressure by age intervals.Data are shown in the table below. The percentage of employees who are over age 50 and have high blood pressure is
A)46.8% (72/154).
B)32.1% (154/480).
C)31.6% (59/187).
D)36.9% (72/195).
E)15.0% (72/480).
Blood pressure by age intervals.Data are shown in the table below.
The percentage of employees who are over age 50 and have high blood pressure isA)46.8% (72/154).
B)32.1% (154/480).
C)31.6% (59/187).
D)36.9% (72/195).
E)15.0% (72/480).
Unlock Deck
Unlock for access to all 19 flashcards in this deck.
Unlock Deck
k this deck
Unlock Deck
Unlock for access to all 19 flashcards in this deck.


