Deck 11: Multiple Comparisons and Analysis of Variance
Full screen (f)
Question
Question
Question
Question
Question
Question
Question
Question
Question
Question
Question
Question
Question
Question
Question
Question
Question
Question
Question
Question
Question
Question
Question
Question
Question
Question
Question
Question
In a bumper test, three types of sub-compact cars
were deliberately crashed into a barrier at 5 mph with the resulting damage (in dollars) recorded.
Eight test cars of each type were crashed. Test results indicated that post-hoc procedures were
warranted. The TUKEY HSD approach was used with the following results:
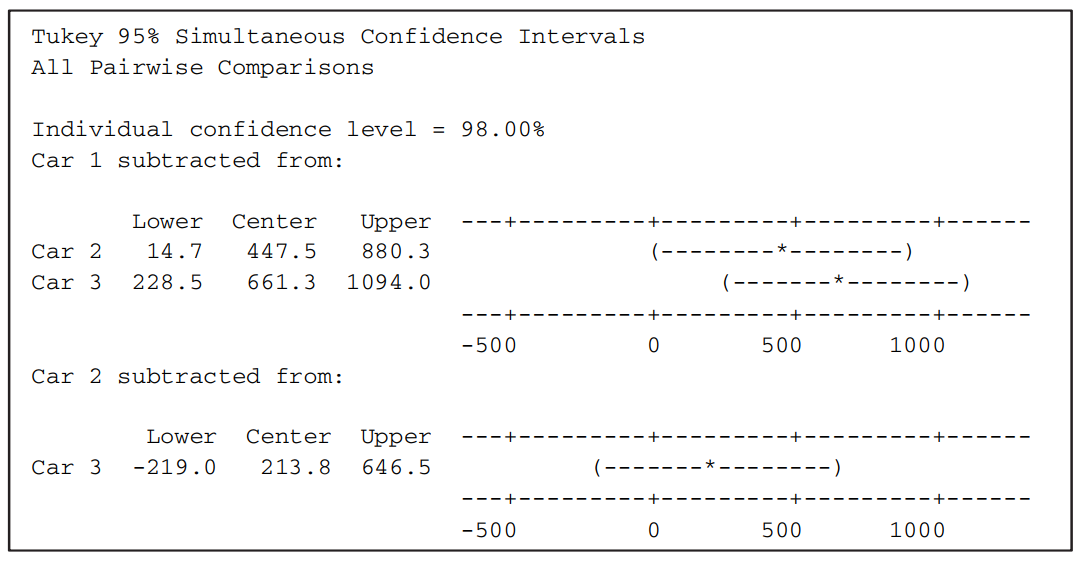
Using an overall significance level of 5%, is there evidence that one type of car had less bumper
damage than the others? Which car appears to have the least bumper damage?
A) Yes, the confidence interval results show that Car 1 has less damage than 2 or 3.
B) Yes, the confidence interval results show that Car 2 has less damage than 1 or 3.
C) Yes, the confidence interval results show that Car 3 has less damage than 1 or 2.
D) No, there is not enough evidence to say that one type of car has less damage than the others
because the intervals all overlap.
were deliberately crashed into a barrier at 5 mph with the resulting damage (in dollars) recorded.
Eight test cars of each type were crashed. Test results indicated that post-hoc procedures were
warranted. The TUKEY HSD approach was used with the following results:
Using an overall significance level of 5%, is there evidence that one type of car had less bumper
damage than the others? Which car appears to have the least bumper damage?
A) Yes, the confidence interval results show that Car 1 has less damage than 2 or 3.
B) Yes, the confidence interval results show that Car 2 has less damage than 1 or 3.
C) Yes, the confidence interval results show that Car 3 has less damage than 1 or 2.
D) No, there is not enough evidence to say that one type of car has less damage than the others
because the intervals all overlap.
Question
Question
Question
Question
Question
Question

Unlock Deck
Sign up to unlock the cards in this deck!
Unlock Deck
Unlock Deck
1/34
Play
Full screen (f)
Deck 11: Multiple Comparisons and Analysis of Variance
1
Suppose that you wish to determine whether the mean starting salaries of students from seven different majors differ. How many comparisons (comparing two groups at a time) can be made with seven groups?
21 comparisons
2
Suppose you have observations from six different regions within your state and you wish to perform hypothesis tests to compare the mean home value across groups. There will be a total of 15 pairwise comparisons. Using the Bonferroni Correction, what significance level should you use for each hypothesis test if you want an overall significance of 0.05? Round to the nearest thousandth.
A)0.050
B)0.008
C)0.003
D)None of the above
A)0.050
B)0.008
C)0.003
D)None of the above
0.003
3
Suppose you wish to compare the means of m groups pair-by-pair. Choose the statement that is true about the Bonferroni Correction. Choose (d) if none of the statements is true.
A)The Bonferroni Correction is done by using a significance level for each individual test.
B)If you want an overall significance level ofαand you are running m tests, then each individual test should be run with significance levelα/ m .
C)The number of comparisons required is always equal to the number of groups that are being compared.
D)None of the statements is true.
If you want an overall significance level ofαand you are running m tests, then each individual test should be run with significance levelα/ m .
4
The waiting time (in minutes) was measured for a random sample of patients with non-life threatening injuries in emergency rooms at four local hospitals who arrived between 2:00 and 3:00pm on a particular Saturday. Check the output to see whether the same-variance condition for ANOVA holds. Show your work. Is ANOVA appropriate? Source DF Adj SS Adj MS F-Value P-Value Factor 3 504.8 168.28 4.97 0.006 Error 31 1048.7 33.83 Total 34 1553.5 Analysis of Variance Means Factor N Mean StDev A 9 13.11 3.41 B 7 14.29 1.60 C 9 16.33 8.08 D 10 22.60 6.82
Unlock Deck
Unlock for access to all 34 flashcards in this deck.
Unlock Deck
k this deck
5
The figure below shows the F-distribution with 5 and 12 degrees of freedom to test the hypothesis that age groups and reading speed are associated. The shaded area represents the p-value. Assume that all conditions for ANOVA have been met. Should the null hypothesis that the age group population means are equal be rejected? What conclusion can be drawn about the association between age group and reading speed? F(5,12) Distribution 0 1.5390.25 F-values
Unlock Deck
Unlock for access to all 34 flashcards in this deck.
Unlock Deck
k this deck
6
What is the meaning of the overall significance level of a test? Explain what happens to the overall significance level when multiple comparisons are made, that is, when multiple hypothesis tests are conducted in an effort to compare the means of several groups.
Unlock Deck
Unlock for access to all 34 flashcards in this deck.
Unlock Deck
k this deck
7
Describe two of the four conditions that must be checked in order for the calculated F-statistic to follow the F-distribution.
Unlock Deck
Unlock for access to all 34 flashcards in this deck.
Unlock Deck
k this deck
8
What is the test statistic used for the ANOVA procedure? Explain how it is calculated.
Unlock Deck
Unlock for access to all 34 flashcards in this deck.
Unlock Deck
k this deck
9
Suppose that you wish to compare the mean home values from three different regions. The Bonferroni-corrected intervals for all three comparisons are shown in the table. Assume an overall confidence level of 95%, that is, an individual confidence level of 98.33%. Choose the statement that is true about the differences among the three means. If none of the statements is true, then choose (d). North East - North Central ($52,485, $78,875) North East - Far West (-$8,724, $14,547) Far West - North Central ($50,093, $75,443)
A)The interval comparing North East to North Central does not capture 0; there is no significant difference in the mean home values between the North East and the North Central regions.
B)The interval comparing Far West to North Central does not capture 0; there is no significant difference in the mean home values between the Far West and the North Central regions.
C)The interval comparing North East to Far West captures 0; there is no significant difference in mean home values between the North East and the Far West regions.
D)None of the statements is true.
Unlock Deck
Unlock for access to all 34 flashcards in this deck.
Unlock Deck
k this deck
10
Suppose a researcher collected data to compare whether cats of different size categories differed in mean number of hours slept per day. Cats were categorized as small, medium, or large. The calculated F-statistic was 220.41. Given this test statistic, can we conclude that there is relatively more variation between groups or within groups? Based on the test statistic, is it likely that an association exists between cat size and mean number of hours that a cat sleeps per day? Explain.
Unlock Deck
Unlock for access to all 34 flashcards in this deck.
Unlock Deck
k this deck
11
In the context of the ANOVA test, do the phrases "variation due to treatment", "explained variation", and "variation due to factors", describe variation within groups or variation between groups?
Unlock Deck
Unlock for access to all 34 flashcards in this deck.
Unlock Deck
k this deck
12
Name the appropriate test for the following situation: You wish to test whether an association exists between type of vehicle transmission purchased- automatic or manual- and gender of the purchaser.
Unlock Deck
Unlock for access to all 34 flashcards in this deck.
Unlock Deck
k this deck
13
Choose the appropriate test for the following situation: You wish to test whether an association exists between type of vehicle purchased and vehicle color.
A)One-sample t-test
B)Two-sample t-test
C)ANOVA
D)Chi-square test
A)One-sample t-test
B)Two-sample t-test
C)ANOVA
D)Chi-square test
Unlock Deck
Unlock for access to all 34 flashcards in this deck.
Unlock Deck
k this deck
14
In a car bumper test, three types of sub-compact cars were deliberately crashed into a barrier at 5 mph with the resulting damage (in dollars) recorded. Eight test cars of each type were crashed. Test results indicated that post-hoc procedures were
Unlock Deck
Unlock for access to all 34 flashcards in this deck.
Unlock Deck
k this deck
15
Identify the test statistic used for the ANOVA procedure and how it is calculated.
A)The test statistic is z and is the ratio of the mean within a group to the variation between groups.
B)The test statistic is F and is the ratio of the variation between groups to the variation within groups.
C)The test statistic is z and is calculated by finding the mean z-score between groups.
D)The test statistic is F and is calculated by finding the difference between group means.
Unlock Deck
Unlock for access to all 34 flashcards in this deck.
Unlock Deck
k this deck
16
Suppose that you wish to determine whether the mean starting salaries of students from seven different majors differ. If you compared groups two-at-a-time, what significance level should you use for each hypothesis test if you want an overall significance level of 0.10? Round your answer to the nearest thousandth.
Unlock Deck
Unlock for access to all 34 flashcards in this deck.
Unlock Deck
k this deck
17
Choose the statement that is not true about multiple comparisons and ANOVA. Choose (d) if all the statements are true.
A)ANOVA is a method for testing whether there is an association between a categorical variable and a numerical variable.
B)When doing a multiple comparison, the overall significance level will increase meaning it is more likely that an incorrect conclusion will be drawn.
C)When doing multiple comparisons, the response variable is always numerical, but the independent variable can be numerical or categorical.
D)All of the above statements are true.
Unlock Deck
Unlock for access to all 34 flashcards in this deck.
Unlock Deck
k this deck
18
Choose the statement that best describes the purpose of ANOVA.
A)The ANOVA procedure will reveal whether the means of several groups are different and which group or groups have a different mean.
B)ANOVA is a procedure for comparing the means of several groups.
C)ANOVA is a procedure for comparing different categories for several groups.
D)None of the above.
A)The ANOVA procedure will reveal whether the means of several groups are different and which group or groups have a different mean.
B)ANOVA is a procedure for comparing the means of several groups.
C)ANOVA is a procedure for comparing different categories for several groups.
D)None of the above.
Unlock Deck
Unlock for access to all 34 flashcards in this deck.
Unlock Deck
k this deck
19
Name the appropriate test for the following situation: Suppose that researchers wish to study whether type of diet affects alertness levels. Three popular dieting plans were included in the study. After following the diet for several weeks, participants were given a test that measured response time to a stimulus.
Unlock Deck
Unlock for access to all 34 flashcards in this deck.
Unlock Deck
k this deck
20
Choose the appropriate test for the following situation: You wish to test whether an association exists between the type of vehicle purchased and the number of children the buyer has.
A)One-sample t-test
B)Two-sample t-test
C)ANOVA
D)Chi-square test
A)One-sample t-test
B)Two-sample t-test
C)ANOVA
D)Chi-square test
Unlock Deck
Unlock for access to all 34 flashcards in this deck.
Unlock Deck
k this deck
21
Choose the statement that is true about the level of significance when performing several hypothesis tests at the same time. Choose (d) if all statements are true.
A)The overall significance level is always smaller than the significance level for any one of the individual tests.
B)The overall level of significance is the probability of mistakenly rejecting the null hypothesis in at least one of several hypothesis tests.
C)The overall level of significance is found by adding the significance levels of each of the several hypothesis tests.
D)All of the above statements are true.
Unlock Deck
Unlock for access to all 34 flashcards in this deck.
Unlock Deck
k this deck
22
Choose the statement that is true about the F-statistic. Choose (d) if all statements are true.
A)The F-statistic compares the variation between the groups to the variation within the groups.
B)Large values of the F-statistic support the null hypothesis that there is no difference among the group means.
C)The F-statistic is large when the variation within the groups is large compared to the variation between the groups.
D)All of the above statements are true.
Unlock Deck
Unlock for access to all 34 flashcards in this deck.
Unlock Deck
k this deck
23
Choose the appropriate test for the following situation. A company has instituted a new work policy that it hopes will reduce the number of sick days used per year by its employees. You wish to test whether the mean number of sick days used by employees this year differs from the mean number of sick days used last year by all employees (which was 8.2).
A)One-sample t-test
B)Two-sample t-test
C)ANOVA
D)Chi-square test
A)One-sample t-test
B)Two-sample t-test
C)ANOVA
D)Chi-square test
Unlock Deck
Unlock for access to all 34 flashcards in this deck.
Unlock Deck
k this deck
24
Suppose you wish to compare the means of m groups pair-by-pair. Choose the statement that is not true about the Bonferroni Correction. Choose (d) if none of the statements is true.
A)The Bonferroni Correction is done by using a larger significance level for each individual test.
B)If you want an overall significance level ofα and you are running m tests, then each individual test should be run with significance level mα.
C)The number of pairwise comparisons required is always equal to the number of groups that are being compared.
D)None of the statements is true.
Unlock Deck
Unlock for access to all 34 flashcards in this deck.
Unlock Deck
k this deck
25
Choose the appropriate test for the following situation: You wish to test whether the mean number of boxes of a new cereal sold in several different markets around the country is different for three different package types.
A)One-sample t-test
B)Two-sample t-test
C)ANOVA
D)Chi-square test
A)One-sample t-test
B)Two-sample t-test
C)ANOVA
D)Chi-square test
Unlock Deck
Unlock for access to all 34 flashcards in this deck.
Unlock Deck
k this deck
26
Which of the following statements about the p-value of an ANOVA test is not true?
A)The p-value for an ANOVA test is the probability of getting an F-statistic as small as or smaller than the observed value, assuming the null hypothesis is true.
B)The p-value for an ANOVA test is the probability of getting an F-statistic as large as or larger than the observed value, assuming the null hypothesis is true.
C)A very small p-value for an ANOVA test suggests that at least two population means are different.
D)A large p-value for an ANOVA test suggests that there is no evidence of differences among the population means.
Unlock Deck
Unlock for access to all 34 flashcards in this deck.
Unlock Deck
k this deck
27
Choose the statement that is not true about ANOVA.
A)ANOVA can be used to compare the means of two groups.
B)ANOVA is a more powerful approach than the Bonferroni Correction.
C)ANOVA is used to compare two categorical variables.
D)ANOVA is a procedure for comparing the means of several groups.
A)ANOVA can be used to compare the means of two groups.
B)ANOVA is a more powerful approach than the Bonferroni Correction.
C)ANOVA is used to compare two categorical variables.
D)ANOVA is a procedure for comparing the means of several groups.
Unlock Deck
Unlock for access to all 34 flashcards in this deck.
Unlock Deck
k this deck
28
In a bumper test, three types of sub-compact cars
were deliberately crashed into a barrier at 5 mph with the resulting damage (in dollars) recorded.
Eight test cars of each type were crashed. Test results indicated that post-hoc procedures were
warranted. The TUKEY HSD approach was used with the following results:
Using an overall significance level of 5%, is there evidence that one type of car had less bumper
damage than the others? Which car appears to have the least bumper damage?
A) Yes, the confidence interval results show that Car 1 has less damage than 2 or 3.
B) Yes, the confidence interval results show that Car 2 has less damage than 1 or 3.
C) Yes, the confidence interval results show that Car 3 has less damage than 1 or 2.
D) No, there is not enough evidence to say that one type of car has less damage than the others
because the intervals all overlap.
Unlock Deck
Unlock for access to all 34 flashcards in this deck.
Unlock Deck
k this deck
29
Use the following information to answer questions (17) - (19). Researchers want to test whether the color
of a vehicle ticketed for speeding has an effect on the amount of the ticket. Four vehicle colors were used
for the study - red, white, black, and silver. Thirty vehicles were randomly assigned to each group. Use
the output below to answer questions (17) - (19).
One-way ANOVA Variance between groups = 2063.33
Variance within gr p-value = 0.000239 oups = 296.25
Choose the correct conclusion for the hypothesis that vehicle color affects the amount of a speeding ticket. Assume all ANOVA test conditions have been satisfied.
A)Reject H0 .The vehicle color has an effect on the amount of the speeding ticket.
B)Fail to reject H0 .The vehicle color has an effect on the amount of the speeding ticket.
C)Reject H0 .The vehicle color has no effect on the amount of the speeding ticket.
D)Fail to reject H0 .The vehicle color has no effect on the amount of the speeding ticket.
Unlock Deck
Unlock for access to all 34 flashcards in this deck.
Unlock Deck
k this deck
30
Suppose that you wish to compare the mean starting salaries of students from seven different majors based on a random sample of students from these majors. There will be a total of 21 pairwise comparisons. Using the Bonferroni Correction, what significance level should you use for each hypothesis test if you want an overall significance level of 0.05? Round your answer to the nearest thousandth.
A)0.050
B)0.025
C)0.007
D)0.002
A)0.050
B)0.025
C)0.007
D)0.002
Unlock Deck
Unlock for access to all 34 flashcards in this deck.
Unlock Deck
k this deck
31
Use the following information to answer questions (17) - (19). Researchers want to test whether the color
of a vehicle ticketed for speeding has an effect on the amount of the ticket. Four vehicle colors were used
for the study - red, white, black, and silver. Thirty vehicles were randomly assigned to each group. Use
the output below to answer questions (17) - (19).
One-way ANOVA Variance between groups = 2063.33
Variance within gr p-value = 0.000239 oups = 296.25
Do the ANOVA test results warrant a Post-hoc procedure?
A)Yes
B)No
Unlock Deck
Unlock for access to all 34 flashcards in this deck.
Unlock Deck
k this deck
32
Use the following information to answer questions (17) - (19). Researchers want to test whether the color
of a vehicle ticketed for speeding has an effect on the amount of the ticket. Four vehicle colors were used
for the study - red, white, black, and silver. Thirty vehicles were randomly assigned to each group. Use
the output below to answer questions (17) - (19).
One-way ANOVA Variance between groups = 2063.33
Variance within gr p-value = 0.000239 oups = 296.25
Compute the F-statistic. Round to the nearest hundredth.
A)269.31
B)6.96
C)0.14
D)Not enough information is given
Unlock Deck
Unlock for access to all 34 flashcards in this deck.
Unlock Deck
k this deck
33
Choose the statement that best describes the F-statistic for the ANOVA test.
A)The F-statistic compares the variation between groups to the variation within groups.A small F-statistic indicates that variation between groups is small relative to variation within groups.
B)The F-statistic compares the variation between groups to the variation within groups.A small F-statistic indicates that variation between groups is large relative to variation within groups.
C)The F-statistic is the probability of getting the sample results, assuming that there is no difference in the groups.
D)None of the above
Unlock Deck
Unlock for access to all 34 flashcards in this deck.
Unlock Deck
k this deck
34
Suppose that you wish to compare the mean starting salaries of students from three different majors. The Bonferroni- corrected intervals for all three comparisons are shown in the table. Assume an overall confidence level of 95%, that is, an individual confidence level of 98.33%. Choose the statement that is true about the differences among the three means. If all of the statements are true, then choose (d). Business - Education ($8,425, $16,825) Business - Computer Science (-$514, $4,682) Computer Science - Education ($8,324, $12,759)
A)The interval comparing Business to Education does not capture 0; there is a significant difference in the mean starting salaries between Business majors and Education majors.
B)The interval comparing Computer Science to Education does not capture 0; there is a significant difference between the starting salaries of Computer Science majors and Education majors.
C)The interval comparing Business to Computer Science captures 0; there is no significant difference in mean starting salaries between Business majors and Computer Science majors.
D)All statements are true.
Unlock Deck
Unlock for access to all 34 flashcards in this deck.
Unlock Deck
k this deck
Unlock Deck
Unlock for access to all 34 flashcards in this deck.


