Deck 1: Linear Functions
Full screen (f)
Question
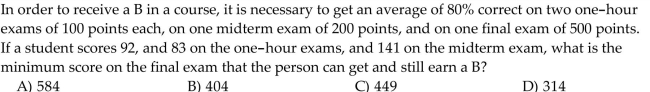
Question
Question
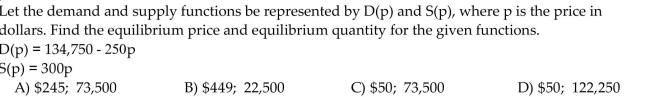
Solve the problem.
Question
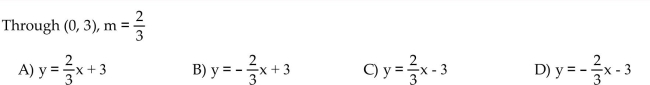
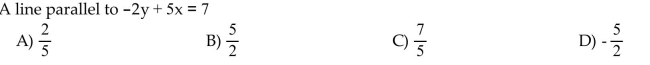
Find an equation in slope-intercept form (where possible) for the line.

Question
Graph the equation.
y + 2 = 0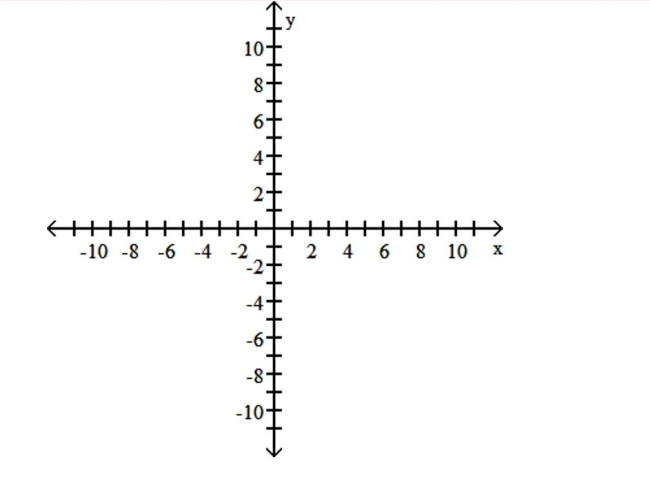
y + 2 = 0
Question
Question
Question
A study was conducted to compare the average time spent in the lab each week versus course grade for computer students. The results are recorded in the table below. Use the equation of the
Least squares line to predict the grade of a student who spends 5 hours in the lab.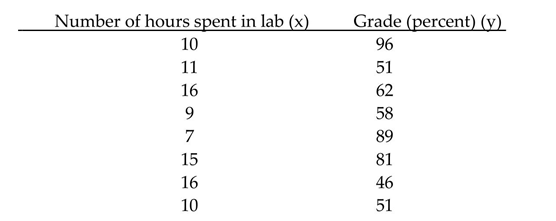
A)
B)
C)
D)
Least squares line to predict the grade of a student who spends 5 hours in the lab.
A)
B)
C)
D)
Question
Find the correlation coefficient.
The following are the temperatures on randomly chosen days and the amount a certain kind of plant grew (in millimeters):
The following are the temperatures on randomly chosen days and the amount a certain kind of plant grew (in millimeters):
Question
Question
Question
Find the correlation coefficient.
Question

Question
Solve the problem.
Question
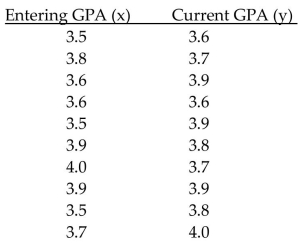
Find the equation of the least squares line.
-Ten students in a graduate program were randomly selected. Their grade point averages (GPAs) when they entered the program were between 3.5 and 4.0. The following data were obtained Regarding their GPAs on entering the program versus their current GPAs.
A)
B)
C)
D)
-Ten students in a graduate program were randomly selected. Their grade point averages (GPAs) when they entered the program were between 3.5 and 4.0. The following data were obtained Regarding their GPAs on entering the program versus their current GPAs.
A)
B)
C)
D)
Question
Graph the equation.
5y + 2x = -15 11)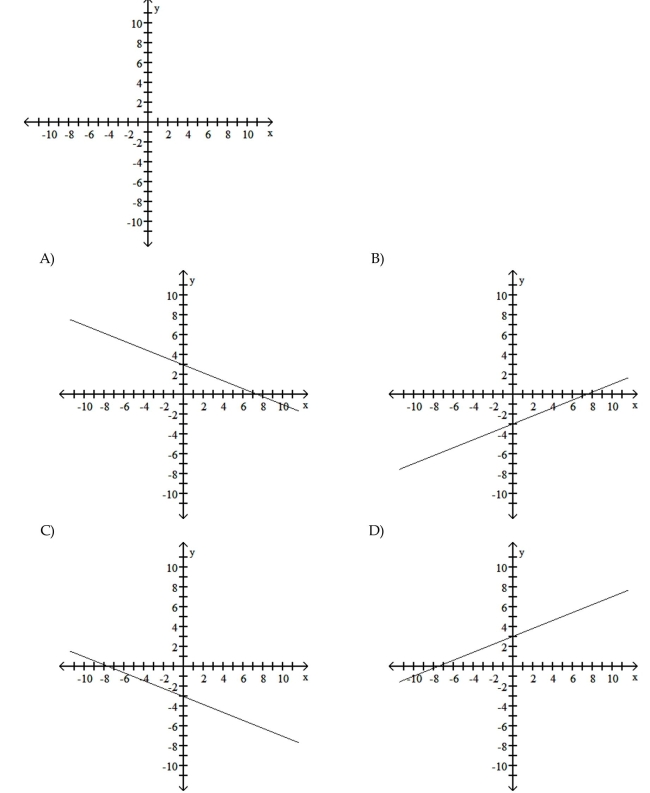
5y + 2x = -15 11)
Question
Question
Question
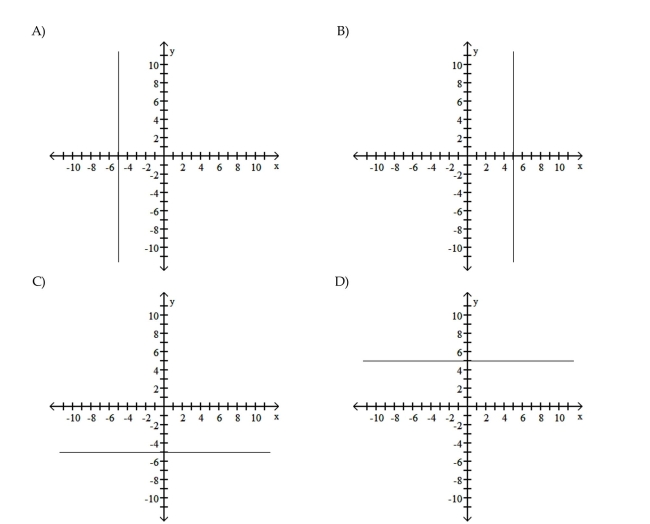
Graph the equation.
y = -6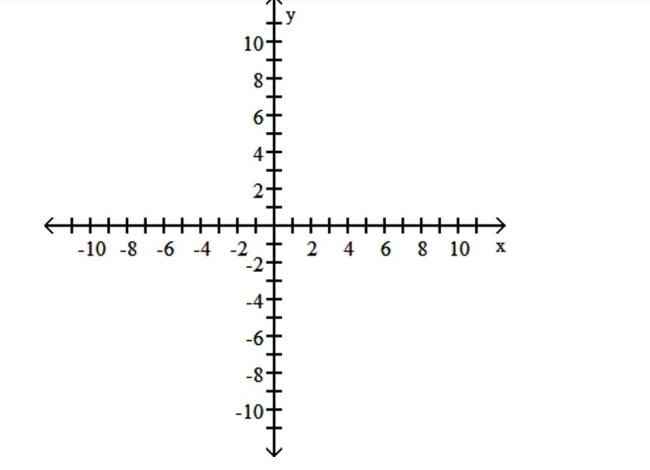
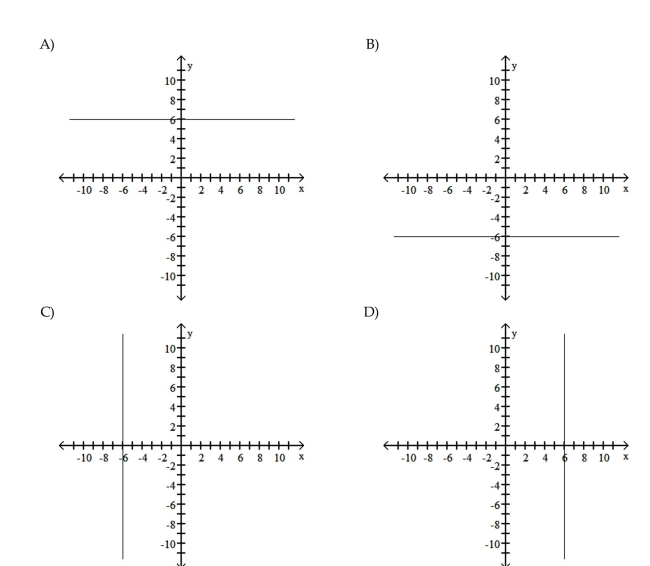
y = -6
Question
Question
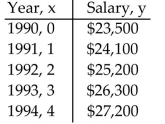
Solve the problem.
-The information in the chart gives the salary of a person for the stated years. Model the data with a linear function using the points (1, 24,100)and (3, 26,800).

A)
B)
C)
D)
-The information in the chart gives the salary of a person for the stated years. Model the data with a linear function using the points (1, 24,100)and (3, 26,800).
A)
B)
C)
D)
Question
Find an equation in slope-intercept form (where possible) for the line.

Question
Evaluate the function as indicated.

Question
Find the correlation coefficient.
The following are the temperatures on randomly chosen days and the amount a certain kind of plant grew (in millimeters):
The following are the temperatures on randomly chosen days and the amount a certain kind of plant grew (in millimeters):
Question
Provide an appropriate response.
Question
Find the correlation coefficient.
The test scores of 6 randomly picked students and the number of hours they prepared are as follows: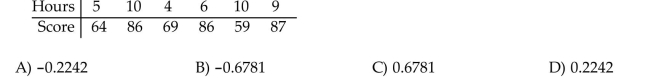
The test scores of 6 randomly picked students and the number of hours they prepared are as follows:
Question
Solve the problem.
Question
Find an equation in slope-intercept form (where possible) for the line.

Question
Find an equation in slope-intercept form (where possible) for the line.

Question
Evaluate the function as indicated.

Question
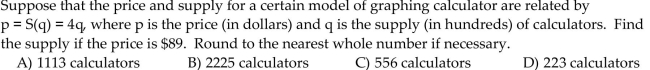
Solve the problem.
Given the supply and demand functions below, find the demand when p = $12.
Given the supply and demand functions below, find the demand when p = $12.
Question
Evaluate the function as indicated.

Question
Find the correlation coefficient.
-The test scores of 6 randomly picked students and the number of hours they prepared are as follows:
A)
B)
C)
D)
-The test scores of 6 randomly picked students and the number of hours they prepared are as follows:
A)
B)
C)
D)
Question
Solve the problem.
-For some reason the quality of production decreases as the year progresses at a light bulb manufacturing plant. The following data represent the percentage of defective light bulbs Produced at a light bulb manufacturing plant in the corresponding month of the year.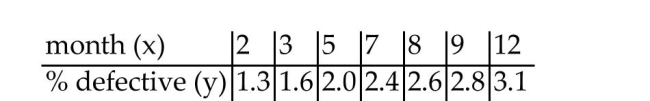 Use the equation of the least squares line to predict in which month the percentage of defective
Light bulbs would be 1.83%.
A)February
B)May
C)March
D)April
-For some reason the quality of production decreases as the year progresses at a light bulb manufacturing plant. The following data represent the percentage of defective light bulbs Produced at a light bulb manufacturing plant in the corresponding month of the year.
Use the equation of the least squares line to predict in which month the percentage of defectiveLight bulbs would be 1.83%.
A)February
B)May
C)March
D)April
Question
Evaluate the function as indicated.

Question
Question
Question
Graph the equation.
y = 3x - 2
y = 3x - 2
Question
Solve the problem.
-For some reason the quality of production decreases as the year progresses at a light bulb manufacturing plant. The following data represent the percentage of defective light bulbs Produced at a light bulb manufacturing plant in the corresponding month of the year.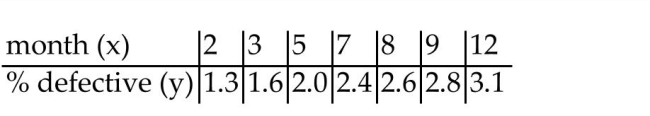 Use the equation of the least squares line to predict the percentage of defective bulbs in June.
A)2.0%
B)2.3%
C)2.20%
D)2.15%
-For some reason the quality of production decreases as the year progresses at a light bulb manufacturing plant. The following data represent the percentage of defective light bulbs Produced at a light bulb manufacturing plant in the corresponding month of the year.
Use the equation of the least squares line to predict the percentage of defective bulbs in June.A)2.0%
B)2.3%
C)2.20%
D)2.15%
Question
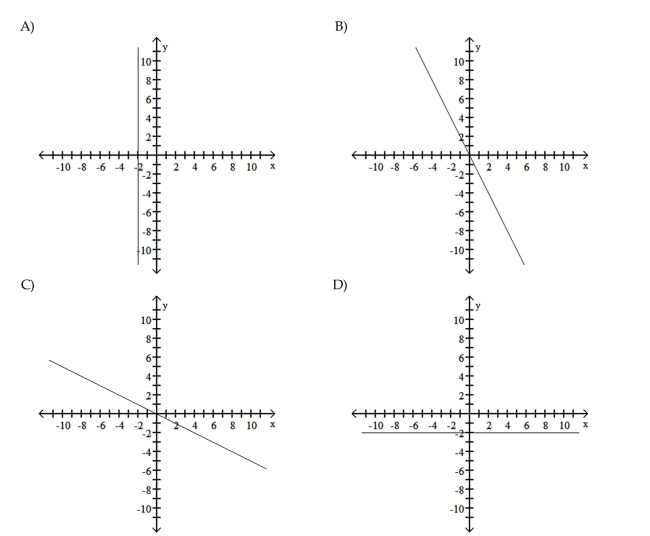
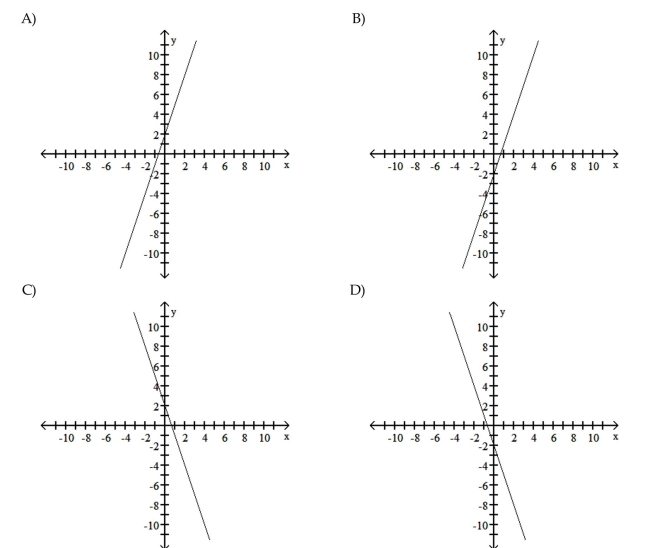
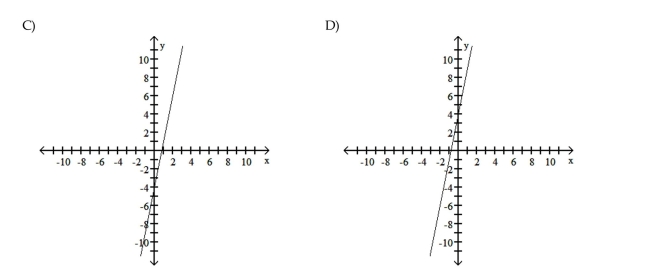
Graph the equation.
-2y - 7x = 4
A)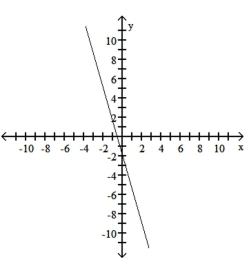
B)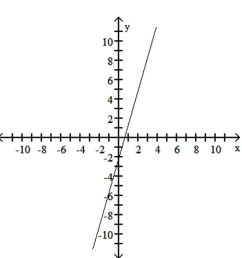
C)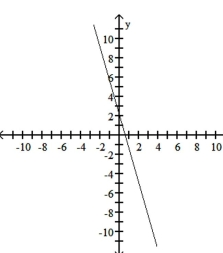
D)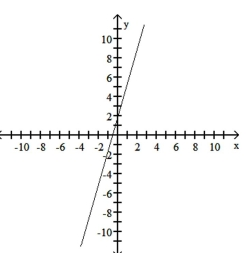
-2y - 7x = 4
A)
B)
C)
D)
Question
Question
Find an equation in slope-intercept form (where possible) for the line.

Question
Find the slope of the line.

Question
Find an equation in slope-intercept form (where possible) for the line.

Question
Question
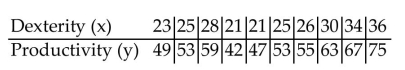
Find the equation of the least squares line.
-Two different tests are designed to measure employee productivity and dexterity. Several employees of a company are randomly selected and asked to complete the tests. The results are Below.
A)
B)
C)
D)
-Two different tests are designed to measure employee productivity and dexterity. Several employees of a company are randomly selected and asked to complete the tests. The results are Below.
A)
B)
C)
D)
Question
Question
Question
Evaluate the function as indicated.

Question
Question
Graph the equation.
5x + y = -4
5x + y = -4
Question
Find the slope of the line.

Question
Find the slope of the line passing through the given pair of points.

Question
Find an equation in slope-intercept form (where possible) for the line.
Question
Question
Find an equation in slope-intercept form (where possible) for the line.

Question
Find an equation in slope-intercept form (where possible) for the line.

Question
Question
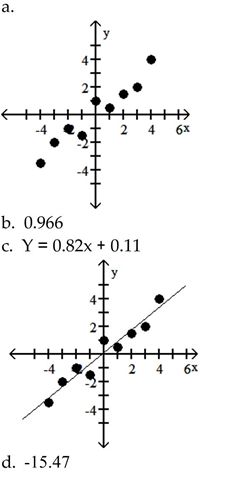
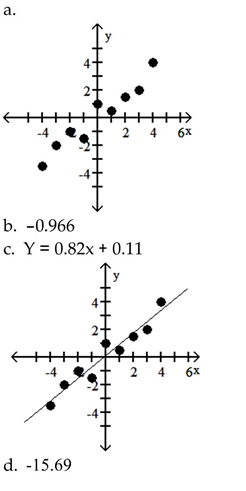
Solve the problem.
-For the following table of data,
a. Draw a scatterplot.
B. Calculate the correlation coefficient.
C. Calculate the least squares line and graph it on the scatterplot.
D. Predict the y-value when x is 11.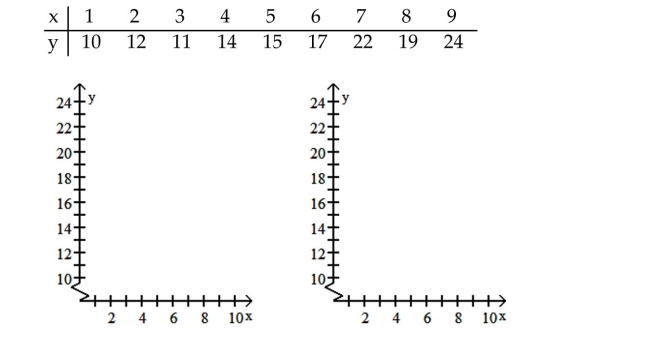
A)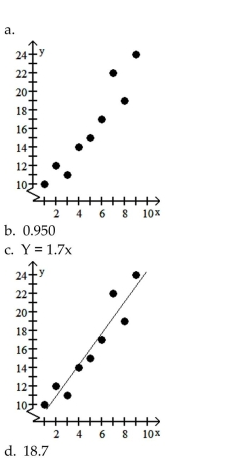
B)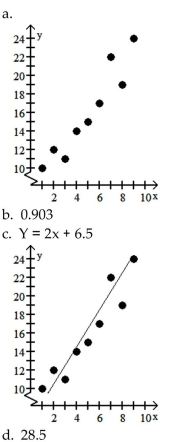
C)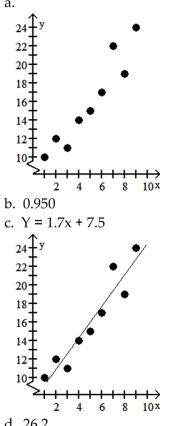
D)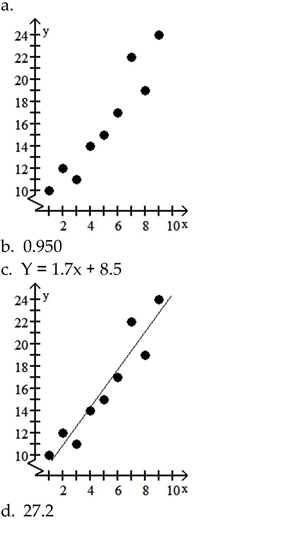
-For the following table of data,
a. Draw a scatterplot.
B. Calculate the correlation coefficient.
C. Calculate the least squares line and graph it on the scatterplot.
D. Predict the y-value when x is 11.
A)
B)
C)
D)
Question
Solve the problem.
-The paired data below consist of the costs of advertising (in thousands of dollars)and the number of products sold (in thousands). Use the equation of the least squares line to predict the number of Products sold if the cost of advertising is $6000.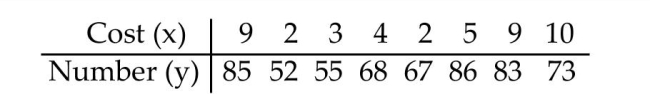
A)72.54 products sold
B)69.54 products sold
C)16,795.8 products sold
D)79.24 products sold
Question
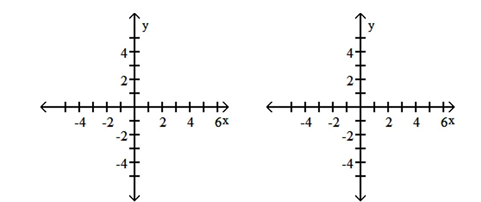
Question
For the following table of data,
A. Draw a scatterplot.
B. Calculate the correlation coefficient.
C. Calculate the least squares line and graph it on the scatterplot.
D. Predict the y-value when x is -19.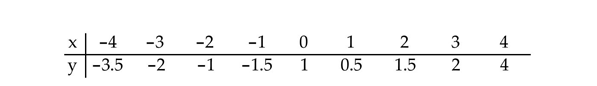
A)
B)
C)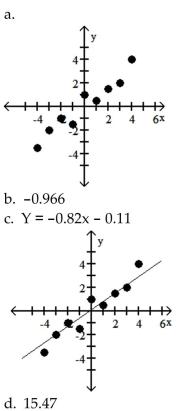
D)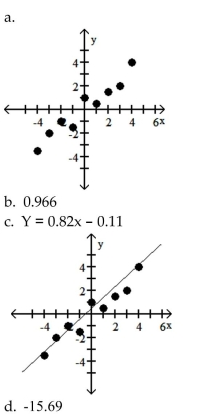
A. Draw a scatterplot.
B. Calculate the correlation coefficient.
C. Calculate the least squares line and graph it on the scatterplot.
D. Predict the y-value when x is -19.
A)
B)
C)
D)
Question
Question
Evaluate the function as indicated.

Question
Question
Find an equation in slope-intercept form (where possible) for the line.

Question
Find the slope of the line passing through the given pair of points.

Question
Question
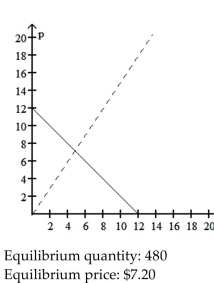
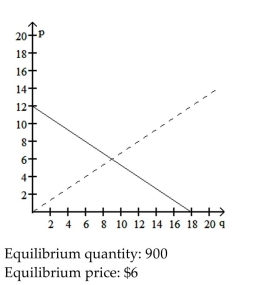
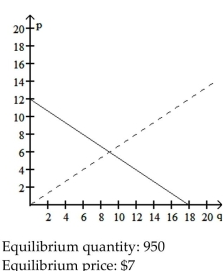
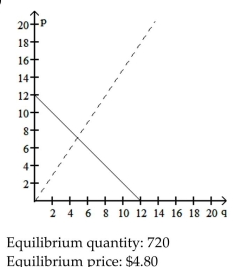
Let the supply and demand functions for a certain model of electric pencil sharpener be given by and where p is the price in dollars and q is the quantity of pencil sharpeners (in hundreds). Graph these functions on the same axes (graph the supply function as a dashed line and the demand function as A solid line). Also, find the equilibrium quantity and the equilibrium price.

A)
B)
C)
D)
A)
B)
C)
D)
Question
Question
The paired data below consist of the test scores of 6 randomly selected students and the number of hours they studied for the test. Use the equation of the least squares line to predict the score on the Test of a student who studies 13 hours. 
A)81.2
B)86.2
C)76.2
D)86.8
A)81.2
B)86.2
C)76.2
D)86.8
Question
Write a cost function for the problem. Assume that the relationship is linear.
A cab company charges a base rate of $1.00 plus 10 cents per minute. Let C(x)be the cost in dollars of u sing the cab for x minutes.
A cab company charges a base rate of $1.00 plus 10 cents per minute. Let C(x)be the cost in dollars of u
sing the cab for x minutes. Question
Question
Graph the equation.
x = -5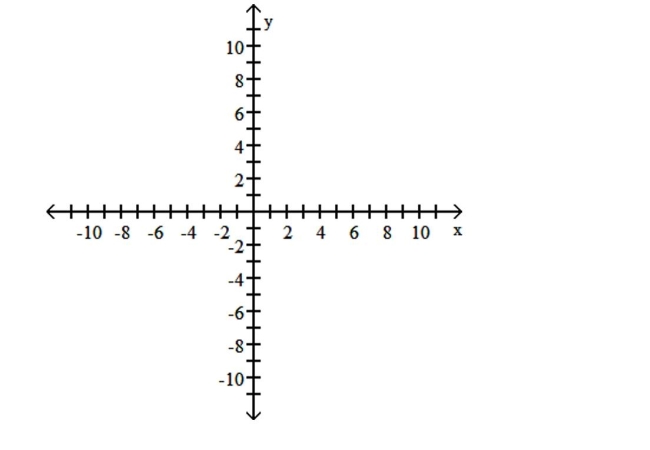
x = -5
Question
The information in the chart below gives the salary of a person for the stated years. Model the data with a linear function using the points (1, 24,100)and (3, 26,300). Then use this function to predict The salary for the year 2005.
A)
B)
C)
D)
A)
B)
C)
D)
Question
Question
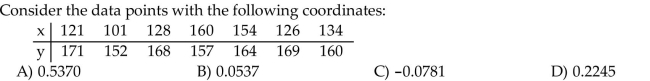
Find the correlation coefficient.
Consider the data points with the following coordinates:
Consider the data points with the following coordinates:
Question
Question
Find the slope of the line.
Question
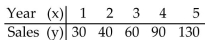
In the table below, x represents the number of years since 2000 and y represents annual sales (in thousands of dollars)for a clothing company. Use the least squares regression equation to Estimate sales in the year 2006. Round to the nearest thousand dollars.
A)
B)
C)
D)
A)
B)
C)
D)

Unlock Deck
Sign up to unlock the cards in this deck!
Unlock Deck
Unlock Deck
1/160
Play
Full screen (f)
Deck 1: Linear Functions
1
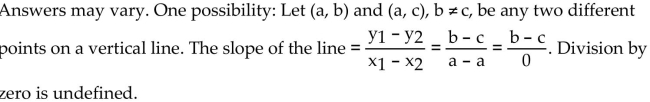
Why is the slope of a vertical line undefined?
2
When going more than 38 miles per hour, the gas mileage of a certain car fits the model where is the speed of the car in miles per hour and is the miles per gallon of gasoline. Based on this model, at what speed will the car average 15 miles per gallon? (Round to nearest whole number.)
A) 98 miles per hour
B) 73 miles per hour
C) 48 miles per hour
D) 149 miles per hour
A) 98 miles per hour
B) 73 miles per hour
C) 48 miles per hour
D) 149 miles per hour
73 miles per hour
3
Solve the problem.
B
4
Find an equation in slope-intercept form (where possible) for the line.
Unlock Deck
Unlock for access to all 160 flashcards in this deck.
Unlock Deck
k this deck
5
Graph the equation.
y + 2 = 0
y + 2 = 0
Unlock Deck
Unlock for access to all 160 flashcards in this deck.
Unlock Deck
k this deck
6
Can an equation of a vertical line be written in slope-intercept form? Explain.
Unlock Deck
Unlock for access to all 160 flashcards in this deck.
Unlock Deck
k this deck
7
Give a definition or an example of the word or phrase: Zero slope
Unlock Deck
Unlock for access to all 160 flashcards in this deck.
Unlock Deck
k this deck
8
A study was conducted to compare the average time spent in the lab each week versus course grade for computer students. The results are recorded in the table below. Use the equation of the
Least squares line to predict the grade of a student who spends 5 hours in the lab.
A)
B)
C)
D)
Least squares line to predict the grade of a student who spends 5 hours in the lab.
A)
B)
C)
D)
Unlock Deck
Unlock for access to all 160 flashcards in this deck.
Unlock Deck
k this deck
9
Find the correlation coefficient.
The following are the temperatures on randomly chosen days and the amount a certain kind of plant grew (in millimeters):
The following are the temperatures on randomly chosen days and the amount a certain kind of plant grew (in millimeters):
Unlock Deck
Unlock for access to all 160 flashcards in this deck.
Unlock Deck
k this deck
10
John has been a teacher at West Side High School for the past 12 years. His salary during that time can be modeled by the linear equation y = 800x + 33,000 where x is the number of years since he began teaching at West Side and y is his salary in dollars. Explain what the slope, 800, represents in this context.
Unlock Deck
Unlock for access to all 160 flashcards in this deck.
Unlock Deck
k this deck
11
If a company decides to make a new product, there are fixed costs and variable costs
associated with this new product. Explain the differences of the two types of costs and
why they occur. Use an example to illustrate your point.
associated with this new product. Explain the differences of the two types of costs and
why they occur. Use an example to illustrate your point.
Unlock Deck
Unlock for access to all 160 flashcards in this deck.
Unlock Deck
k this deck
12
Find the correlation coefficient.
Unlock Deck
Unlock for access to all 160 flashcards in this deck.
Unlock Deck
k this deck
13
Unlock Deck
Unlock for access to all 160 flashcards in this deck.
Unlock Deck
k this deck
14
Solve the problem.
Unlock Deck
Unlock for access to all 160 flashcards in this deck.
Unlock Deck
k this deck
15
Find the equation of the least squares line.
-Ten students in a graduate program were randomly selected. Their grade point averages (GPAs) when they entered the program were between 3.5 and 4.0. The following data were obtained Regarding their GPAs on entering the program versus their current GPAs.
A)
B)
C)
D)
-Ten students in a graduate program were randomly selected. Their grade point averages (GPAs) when they entered the program were between 3.5 and 4.0. The following data were obtained Regarding their GPAs on entering the program versus their current GPAs.
A)
B)
C)
D)
Unlock Deck
Unlock for access to all 160 flashcards in this deck.
Unlock Deck
k this deck
16
Graph the equation.
5y + 2x = -15 11)
5y + 2x = -15 11)
Unlock Deck
Unlock for access to all 160 flashcards in this deck.
Unlock Deck
k this deck
17
The total number of reported cases of AIDS in the United States has risen from 372 in 1981 to 100,000 in 1989 and 200,000 in 1992. Does a linear equation fit this data? Explain.
Unlock Deck
Unlock for access to all 160 flashcards in this deck.
Unlock Deck
k this deck
18
Why is the slope of a horizontal line equal to zero? Give an example.
Unlock Deck
Unlock for access to all 160 flashcards in this deck.
Unlock Deck
k this deck
19
Graph the equation.
y = -6
y = -6
Unlock Deck
Unlock for access to all 160 flashcards in this deck.
Unlock Deck
k this deck
20
Explain what is wrong with the statement "The line has no slope.
Unlock Deck
Unlock for access to all 160 flashcards in this deck.
Unlock Deck
k this deck
21
Solve the problem.
-The information in the chart gives the salary of a person for the stated years. Model the data with a linear function using the points (1, 24,100)and (3, 26,800).
A)
B)
C)
D)
-The information in the chart gives the salary of a person for the stated years. Model the data with a linear function using the points (1, 24,100)and (3, 26,800).
A)
B)
C)
D)
Unlock Deck
Unlock for access to all 160 flashcards in this deck.
Unlock Deck
k this deck
22
Find an equation in slope-intercept form (where possible) for the line.
Unlock Deck
Unlock for access to all 160 flashcards in this deck.
Unlock Deck
k this deck
23
Evaluate the function as indicated.
Unlock Deck
Unlock for access to all 160 flashcards in this deck.
Unlock Deck
k this deck
24
Find the correlation coefficient.
The following are the temperatures on randomly chosen days and the amount a certain kind of plant grew (in millimeters):
The following are the temperatures on randomly chosen days and the amount a certain kind of plant grew (in millimeters):
Unlock Deck
Unlock for access to all 160 flashcards in this deck.
Unlock Deck
k this deck
25
Provide an appropriate response.
Unlock Deck
Unlock for access to all 160 flashcards in this deck.
Unlock Deck
k this deck
26
Find the correlation coefficient.
The test scores of 6 randomly picked students and the number of hours they prepared are as follows:
The test scores of 6 randomly picked students and the number of hours they prepared are as follows:
Unlock Deck
Unlock for access to all 160 flashcards in this deck.
Unlock Deck
k this deck
27
Solve the problem.
Unlock Deck
Unlock for access to all 160 flashcards in this deck.
Unlock Deck
k this deck
28
Find an equation in slope-intercept form (where possible) for the line.
Unlock Deck
Unlock for access to all 160 flashcards in this deck.
Unlock Deck
k this deck
29
Find an equation in slope-intercept form (where possible) for the line.
Unlock Deck
Unlock for access to all 160 flashcards in this deck.
Unlock Deck
k this deck
30
Evaluate the function as indicated.
Unlock Deck
Unlock for access to all 160 flashcards in this deck.
Unlock Deck
k this deck
31
Solve the problem.
Given the supply and demand functions below, find the demand when p = $12.
Given the supply and demand functions below, find the demand when p = $12.
Unlock Deck
Unlock for access to all 160 flashcards in this deck.
Unlock Deck
k this deck
32
Evaluate the function as indicated.
Unlock Deck
Unlock for access to all 160 flashcards in this deck.
Unlock Deck
k this deck
33
Find the correlation coefficient.
-The test scores of 6 randomly picked students and the number of hours they prepared are as follows:
A)
B)
C)
D)
-The test scores of 6 randomly picked students and the number of hours they prepared are as follows:
A)
B)
C)
D)
Unlock Deck
Unlock for access to all 160 flashcards in this deck.
Unlock Deck
k this deck
34
Solve the problem.
-For some reason the quality of production decreases as the year progresses at a light bulb manufacturing plant. The following data represent the percentage of defective light bulbs Produced at a light bulb manufacturing plant in the corresponding month of the year. Use the equation of the least squares line to predict in which month the percentage of defective
Light bulbs would be 1.83%.
A)February
B)May
C)March
D)April
-For some reason the quality of production decreases as the year progresses at a light bulb manufacturing plant. The following data represent the percentage of defective light bulbs Produced at a light bulb manufacturing plant in the corresponding month of the year.
Use the equation of the least squares line to predict in which month the percentage of defectiveLight bulbs would be 1.83%.
A)February
B)May
C)March
D)April
Unlock Deck
Unlock for access to all 160 flashcards in this deck.
Unlock Deck
k this deck
35
Evaluate the function as indicated.
Unlock Deck
Unlock for access to all 160 flashcards in this deck.
Unlock Deck
k this deck
36
Find the slope of the line.
The x-axis
A)0
B)-1
C)Not defined
D)1
The x-axis
A)0
B)-1
C)Not defined
D)1
Unlock Deck
Unlock for access to all 160 flashcards in this deck.
Unlock Deck
k this deck
37
Solve the problem.
-In a certain city, the cost of a taxi ride is computed as follows: There is a fixed charge of $2.45 as soon as you get in the taxi, to which a charge of $2.05 per mile is added. Find a linear equation that Can be used to determine the cost, C, of an x-mile taxi ride.
A)C = 4.50x
B)C = 3.00x
C)C = 2.05x + 2.45
D)C = 2.45x + 2.05
Unlock Deck
Unlock for access to all 160 flashcards in this deck.
Unlock Deck
k this deck
38
Graph the equation.
y = 3x - 2
y = 3x - 2
Unlock Deck
Unlock for access to all 160 flashcards in this deck.
Unlock Deck
k this deck
39
Solve the problem.
-For some reason the quality of production decreases as the year progresses at a light bulb manufacturing plant. The following data represent the percentage of defective light bulbs Produced at a light bulb manufacturing plant in the corresponding month of the year. Use the equation of the least squares line to predict the percentage of defective bulbs in June.
A)2.0%
B)2.3%
C)2.20%
D)2.15%
-For some reason the quality of production decreases as the year progresses at a light bulb manufacturing plant. The following data represent the percentage of defective light bulbs Produced at a light bulb manufacturing plant in the corresponding month of the year.
Use the equation of the least squares line to predict the percentage of defective bulbs in June.A)2.0%
B)2.3%
C)2.20%
D)2.15%
Unlock Deck
Unlock for access to all 160 flashcards in this deck.
Unlock Deck
k this deck
40
Graph the equation.
-2y - 7x = 4
A)
B)
C)
D)
-2y - 7x = 4
A)
B)
C)
D)
Unlock Deck
Unlock for access to all 160 flashcards in this deck.
Unlock Deck
k this deck
41
Solve the problem.
-The change in a certain engineer's salary over time can be approximated by the linear equation y = 1500x + 47,500 where y represents salary in dollars and x represents number of years on the job.According to this equation, after how many years on the job was the engineer's salary $64,000?
A)13 years
B)11 years
C)12 years
D)10 years
Unlock Deck
Unlock for access to all 160 flashcards in this deck.
Unlock Deck
k this deck
42
Find an equation in slope-intercept form (where possible) for the line.
Unlock Deck
Unlock for access to all 160 flashcards in this deck.
Unlock Deck
k this deck
43
Find the slope of the line.
Unlock Deck
Unlock for access to all 160 flashcards in this deck.
Unlock Deck
k this deck
44
Find an equation in slope-intercept form (where possible) for the line.
Unlock Deck
Unlock for access to all 160 flashcards in this deck.
Unlock Deck
k this deck
45
Solve the problem.
-Midtown Delivery Service delivers packages which cost $1.10 per package to deliver. The fixed cost to run the delivery truck is $60 per day. If the company charges $7.10 per package, how many Packages must be delivered daily to break even?
A)54 packages
B)7 packages
C)10 packages
D)6 packages
-Midtown Delivery Service delivers packages which cost $1.10 per package to deliver. The fixed cost to run the delivery truck is $60 per day. If the company charges $7.10 per package, how many Packages must be delivered daily to break even?
A)54 packages
B)7 packages
C)10 packages
D)6 packages
Unlock Deck
Unlock for access to all 160 flashcards in this deck.
Unlock Deck
k this deck
46
Find the equation of the least squares line.
-Two different tests are designed to measure employee productivity and dexterity. Several employees of a company are randomly selected and asked to complete the tests. The results are Below.
A)
B)
C)
D)
-Two different tests are designed to measure employee productivity and dexterity. Several employees of a company are randomly selected and asked to complete the tests. The results are Below.
A)
B)
C)
D)
Unlock Deck
Unlock for access to all 160 flashcards in this deck.
Unlock Deck
k this deck
47
Solve the problem.
-The cost of owning a home includes both fixed costs and variable utility costs. Assume that it costs $5682 per month for mortgage and insurance payments and it costs an average of $1.35 per unit for Natural gas, electricity, and water usage. Determine a linear equation that computes the annual cost Of owning this home if x utility units are used.
A)y = -1.35x + 68,184
B)y = 1.35x + 5682
C)y = -1.35x + 5682
D)y = 1.35x + 68,184
Unlock Deck
Unlock for access to all 160 flashcards in this deck.
Unlock Deck
k this deck
48
Evaluate the function as indicated.
-Find f(5.2)when f(x)= 7
A)5.2
B)36.4
C)7
D)-7
-Find f(5.2)when f(x)= 7
A)5.2
B)36.4
C)7
D)-7
Unlock Deck
Unlock for access to all 160 flashcards in this deck.
Unlock Deck
k this deck
49
Evaluate the function as indicated.
Unlock Deck
Unlock for access to all 160 flashcards in this deck.
Unlock Deck
k this deck
50
Solve the problem.
Find the temperature at which the Celsius and Fahrenheit scales coincide.
A)-25°
B)0°
C)-40°
D)39°
Find the temperature at which the Celsius and Fahrenheit scales coincide.
A)-25°
B)0°
C)-40°
D)39°
Unlock Deck
Unlock for access to all 160 flashcards in this deck.
Unlock Deck
k this deck
51
Graph the equation.
5x + y = -4
5x + y = -4
Unlock Deck
Unlock for access to all 160 flashcards in this deck.
Unlock Deck
k this deck
52
Find the slope of the line.
Unlock Deck
Unlock for access to all 160 flashcards in this deck.
Unlock Deck
k this deck
53
Find the slope of the line passing through the given pair of points.
Unlock Deck
Unlock for access to all 160 flashcards in this deck.
Unlock Deck
k this deck
54
Find an equation in slope-intercept form (where possible) for the line.
Unlock Deck
Unlock for access to all 160 flashcards in this deck.
Unlock Deck
k this deck
55
Write a cost function for the problem. Assume that the relationship is linear.
A moving firm charges a flat fee of $40 plus $35 per hour. Let C(x)be the cost in dollars of using the moving firm for x hours.
A)C(x)= 40x + 35
B)C(x)= 35x + 40
C)C(x)= 35x - 40
D)C(x)= 40x - 35
A moving firm charges a flat fee of $40 plus $35 per hour. Let C(x)be the cost in dollars of using the moving firm for x hours.
A)C(x)= 40x + 35
B)C(x)= 35x + 40
C)C(x)= 35x - 40
D)C(x)= 40x - 35
Unlock Deck
Unlock for access to all 160 flashcards in this deck.
Unlock Deck
k this deck
56
Find an equation in slope-intercept form (where possible) for the line.
Unlock Deck
Unlock for access to all 160 flashcards in this deck.
Unlock Deck
k this deck
57
Find an equation in slope-intercept form (where possible) for the line.
Unlock Deck
Unlock for access to all 160 flashcards in this deck.
Unlock Deck
k this deck
58
Solve the problem.
A car rental company charges $33 per day to rent a particular type of car and $0.15 per mile. Juan is charged $56.70 for a one-day rental. How many miles did he drive?
A)173 mi
B)158 mi
C)345 mi
D)378 mi
A car rental company charges $33 per day to rent a particular type of car and $0.15 per mile. Juan is charged $56.70 for a one-day rental. How many miles did he drive?
A)173 mi
B)158 mi
C)345 mi
D)378 mi
Unlock Deck
Unlock for access to all 160 flashcards in this deck.
Unlock Deck
k this deck
59
Solve the problem.
-For the following table of data,
a. Draw a scatterplot.
B. Calculate the correlation coefficient.
C. Calculate the least squares line and graph it on the scatterplot.
D. Predict the y-value when x is 11.
A)
B)
C)
D)
-For the following table of data,
a. Draw a scatterplot.
B. Calculate the correlation coefficient.
C. Calculate the least squares line and graph it on the scatterplot.
D. Predict the y-value when x is 11.
A)
B)
C)
D)
Unlock Deck
Unlock for access to all 160 flashcards in this deck.
Unlock Deck
k this deck
60
Solve the problem.
-The paired data below consist of the costs of advertising (in thousands of dollars)and the number of products sold (in thousands). Use the equation of the least squares line to predict the number of Products sold if the cost of advertising is $6000.
A)72.54 products sold
B)69.54 products sold
C)16,795.8 products sold
D)79.24 products sold
Unlock Deck
Unlock for access to all 160 flashcards in this deck.
Unlock Deck
k this deck
61
Solve the problem.
-Northwest Molded molds plastic handles which cost $1.00 per handle to mold. The fixed cost to run the molding machine is $5616 per week. If the company sells the handles for $4.00 each, how many Handles must be molded weekly to break even?
A)5616 handles
B)1248 handles
C)1872 handles
D)1123 handles
Unlock Deck
Unlock for access to all 160 flashcards in this deck.
Unlock Deck
k this deck
62
For the following table of data,
A. Draw a scatterplot.
B. Calculate the correlation coefficient.
C. Calculate the least squares line and graph it on the scatterplot.
D. Predict the y-value when x is -19.
A)
B)
C)
D)
A. Draw a scatterplot.
B. Calculate the correlation coefficient.
C. Calculate the least squares line and graph it on the scatterplot.
D. Predict the y-value when x is -19.
A)
B)
C)
D)
Unlock Deck
Unlock for access to all 160 flashcards in this deck.
Unlock Deck
k this deck
63
Suppose that the demand and price for a certain model of graphing calculator are related by , where is the price (in dollars) and is the demand (in hundreds). Find the price if the demand is 600 calculators.
A)
B)
C)
D)
A)
B)
C)
D)
Unlock Deck
Unlock for access to all 160 flashcards in this deck.
Unlock Deck
k this deck
64
Evaluate the function as indicated.
Unlock Deck
Unlock for access to all 160 flashcards in this deck.
Unlock Deck
k this deck
65
Suppose that the population of a certain town, in thousands, was 105 in 1990 and 141 in 2002. Assume that the population growth can be approximated by a straight line. Find the equation of a Line which will estimate the population of the town, in thousands, in any given year since 1990.
A)y = 4.25x + 90 where x is the number of years since 1990
B)y = 3x + 105 where x is the number of years since 1990
C)y = 2.5x + 105 where x is the number of years since 1990
D)y = -3x + 177 where x is the number of years since 1990
A)y = 4.25x + 90 where x is the number of years since 1990
B)y = 3x + 105 where x is the number of years since 1990
C)y = 2.5x + 105 where x is the number of years since 1990
D)y = -3x + 177 where x is the number of years since 1990
Unlock Deck
Unlock for access to all 160 flashcards in this deck.
Unlock Deck
k this deck
66
Find an equation in slope-intercept form (where possible) for the line.
Unlock Deck
Unlock for access to all 160 flashcards in this deck.
Unlock Deck
k this deck
67
Find the slope of the line passing through the given pair of points.
Unlock Deck
Unlock for access to all 160 flashcards in this deck.
Unlock Deck
k this deck
68
A biologist recorded 9 snakes on 14 acres in one area and 18 snakes on 21 acres in another area. Let y be the number of snakes in x acres. Write a linear equation for the number of snakes.
A)
B)
C)
D)
A)
B)
C)
D)
Unlock Deck
Unlock for access to all 160 flashcards in this deck.
Unlock Deck
k this deck
69
Let the supply and demand functions for a certain model of electric pencil sharpener be given by and where p is the price in dollars and q is the quantity of pencil sharpeners (in hundreds). Graph these functions on the same axes (graph the supply function as a dashed line and the demand function as A solid line). Also, find the equilibrium quantity and the equilibrium price.
A)
B)
C)
D)
A)
B)
C)
D)
Unlock Deck
Unlock for access to all 160 flashcards in this deck.
Unlock Deck
k this deck
70
Solve the problem.
The bank's temperature display shows that it is 22° Celsius. What is the temperature in Fahrenheit?
A)97.2°
B)-5.6°
C)30.0°
D)71.6°
The bank's temperature display shows that it is 22° Celsius. What is the temperature in Fahrenheit?
A)97.2°
B)-5.6°
C)30.0°
D)71.6°
Unlock Deck
Unlock for access to all 160 flashcards in this deck.
Unlock Deck
k this deck
71
The paired data below consist of the test scores of 6 randomly selected students and the number of hours they studied for the test. Use the equation of the least squares line to predict the score on the Test of a student who studies 13 hours.
A)81.2
B)86.2
C)76.2
D)86.8
A)81.2
B)86.2
C)76.2
D)86.8
Unlock Deck
Unlock for access to all 160 flashcards in this deck.
Unlock Deck
k this deck
72
Write a cost function for the problem. Assume that the relationship is linear.
A cab company charges a base rate of $1.00 plus 10 cents per minute. Let C(x)be the cost in dollars of u sing the cab for x minutes.
A cab company charges a base rate of $1.00 plus 10 cents per minute. Let C(x)be the cost in dollars of u
sing the cab for x minutes. Unlock Deck
Unlock for access to all 160 flashcards in this deck.
Unlock Deck
k this deck
73
Assume that the sales of a certain appliance dealer can be approximated by a straight line. Suppose that sales were $13,500 in 1982 and $65,000 in 1987. Let x = 0 represent 1982. Find the equation
Giving yearly sales S.
A)S = 51,500x + 65,000
B)S = 51,500x + 13,500
C)S = 10,300x + 65,000
D)S = 10,300x + 13,500
Giving yearly sales S.
A)S = 51,500x + 65,000
B)S = 51,500x + 13,500
C)S = 10,300x + 65,000
D)S = 10,300x + 13,500
Unlock Deck
Unlock for access to all 160 flashcards in this deck.
Unlock Deck
k this deck
74
Graph the equation.
x = -5
x = -5
Unlock Deck
Unlock for access to all 160 flashcards in this deck.
Unlock Deck
k this deck
75
The information in the chart below gives the salary of a person for the stated years. Model the data with a linear function using the points (1, 24,100)and (3, 26,300). Then use this function to predict The salary for the year 2005.
A)
B)
C)
D)
A)
B)
C)
D)
Unlock Deck
Unlock for access to all 160 flashcards in this deck.
Unlock Deck
k this deck
76
The outdoor temperature rises to 22° Fahrenheit. What is this temperature in Celsius?
A)-10°
B)22°
C)-5.6°
D)12.2°
A)-10°
B)22°
C)-5.6°
D)12.2°
Unlock Deck
Unlock for access to all 160 flashcards in this deck.
Unlock Deck
k this deck
77
Find the correlation coefficient.
Consider the data points with the following coordinates:
Consider the data points with the following coordinates:
Unlock Deck
Unlock for access to all 160 flashcards in this deck.
Unlock Deck
k this deck
78
Solve the problem.
-Find an equation for the least squares line representing weight, in pounds, as a function of height, in inches, of men. Then, predict the weight of a man who is 68 inches tall to the nearest tenth of a Pound. The following data are the (height, weight)pairs for 8 men: (66, 150), (68, 160), (69, 166),
(70, 175), (71, 181), (72, 191), (73, 198), (74, 206).
A)161.2 pounds
B)165.1 pounds
C)160.0 pounds
D)151.4 pounds
Unlock Deck
Unlock for access to all 160 flashcards in this deck.
Unlock Deck
k this deck
79
Find the slope of the line.
Unlock Deck
Unlock for access to all 160 flashcards in this deck.
Unlock Deck
k this deck
80
In the table below, x represents the number of years since 2000 and y represents annual sales (in thousands of dollars)for a clothing company. Use the least squares regression equation to Estimate sales in the year 2006. Round to the nearest thousand dollars.
A)
B)
C)
D)
A)
B)
C)
D)
Unlock Deck
Unlock for access to all 160 flashcards in this deck.
Unlock Deck
k this deck
Unlock Deck
Unlock for access to all 160 flashcards in this deck.


