Deck 10: Correlation and Regression
Full screen (f)
Question
Question
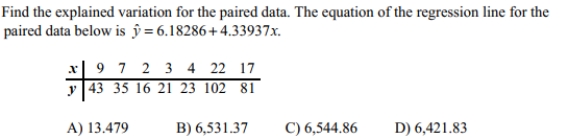
Question
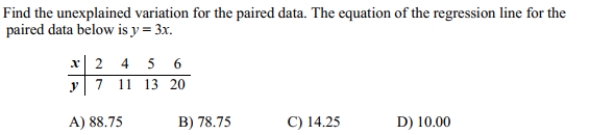
Question
Question
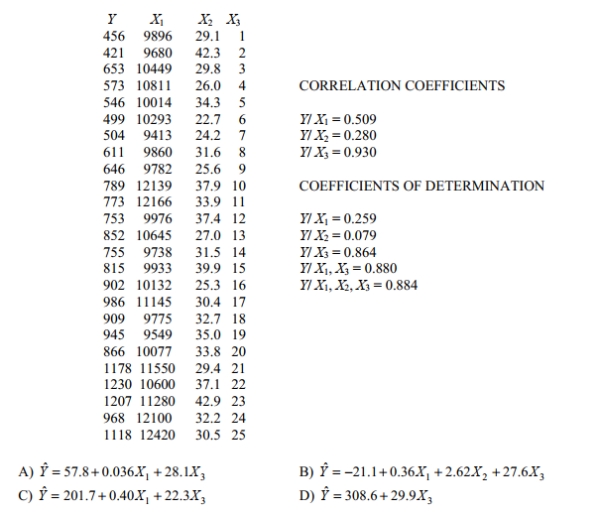
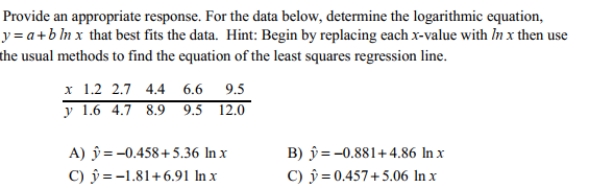
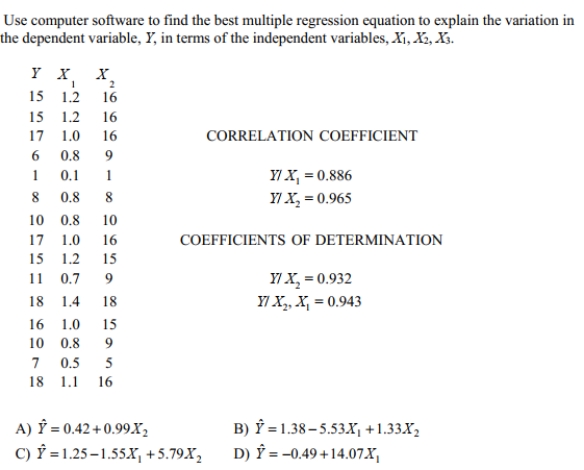
Use computer software to find the best multiple regression equation to explain the variation in the dependent variable, Y, in terms of the independent variables, 
Question
Find the value of the linear correlation coefficient r. The paired data below consist of the temperatures on randomly chosen days and the amount a certain kind of plant grew (in
Millimeters).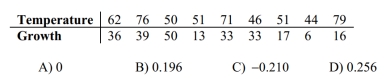
Millimeters).
Question
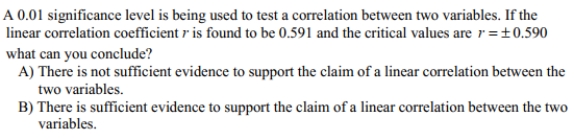
A 0.05 significance level is being used to test a correlation between two variables. If th? linear correlation coefficient r is found to be 0.591 and the critical values are  what can you conclude?
A) There is not sufficient evidence to support the claim of a linear correlation between the two variables.
B) There is sufficient evidence to support the claim of a linear correlation between the two variables.
what can you conclude?A) There is not sufficient evidence to support the claim of a linear correlation between the two variables.
B) There is sufficient evidence to support the claim of a linear correlation between the two variables.
Question
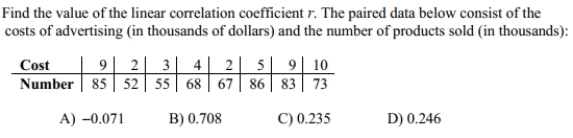
Find the value of the linear correlation coefficient r. The paired data below consist of the costs of advertising (in thousands of dollars)and the number of products sold (in thousands). 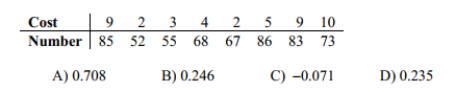
Question
Use the given data to find the equation of the regression line. Round the final values to three significant digits, if necessary. Two different tests are designed to measure employee
Productivity and dexterity. Several employees are randomly selected and tested with these
Results.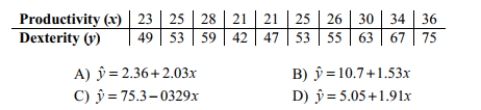
Productivity and dexterity. Several employees are randomly selected and tested with these
Results.
Question
Use computer software to find the multiple regression equation. Can the equation be used for prediction? A wildlife analyst gathered the data in the table to develop an equation to predict
The weights of bears. He used WEIGHT as the dependent variable and CHEST, LENGTH,
And SEX as the independent variables. For SEX, he used male=1 and female=2.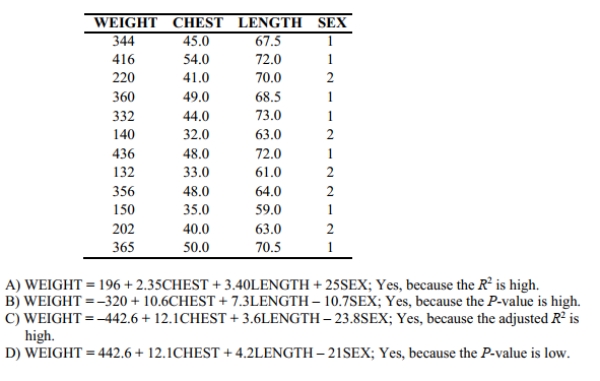
The weights of bears. He used WEIGHT as the dependent variable and CHEST, LENGTH,
And SEX as the independent variables. For SEX, he used male=1 and female=2.
Question
Question
Question
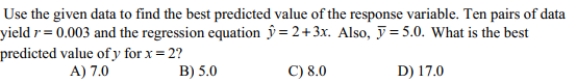
Use the given data to find the equation of the regression line. Round the final values to three significant digits, if necessary. 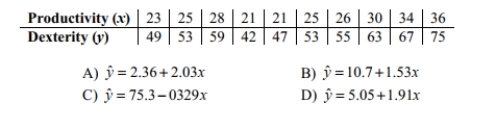
Question

Question
Question
Question
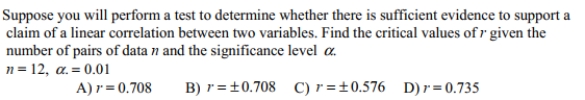
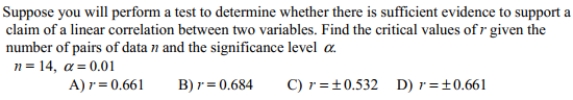
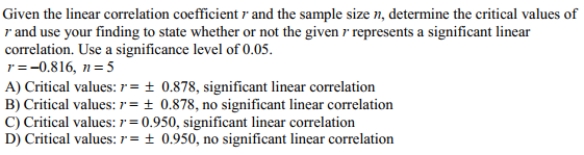
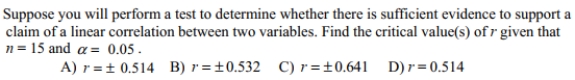
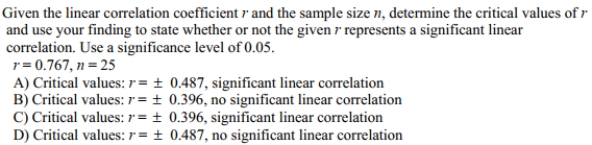
Given the linear correlation coefficient r and the sample size n, determine the critical values of r and use your finding to state whether or not the given r represents a significant linear
Correlation. Use a significance level of 0.05.
R = 0.543, n = 25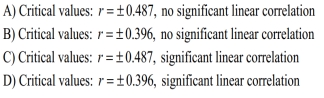
Correlation. Use a significance level of 0.05.
R = 0.543, n = 25
Question
Determine which plot shows the strongest linear correlation. 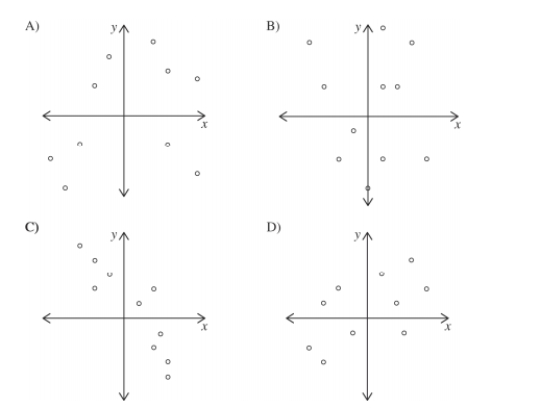
Question
Based on the scatterplot, select the most likely value of the linear correlation coefficient r. 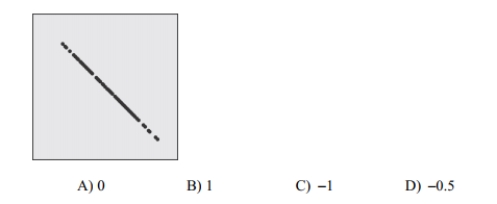
Question
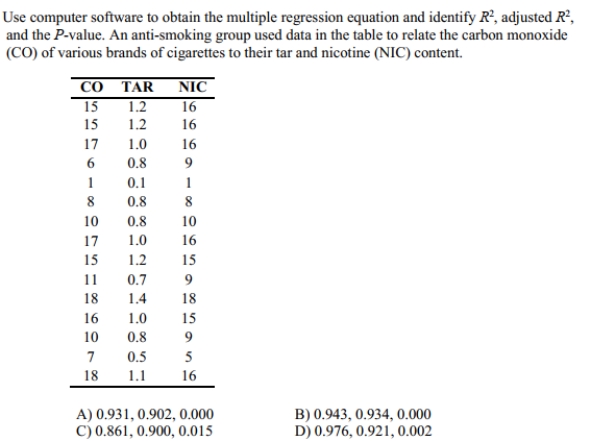
Use computer software to find the multiple regression equation. Can the equation be used for prediction? An anti-smoking group used data in the table to relate the carbon monoxide( CO)
Of various brands of cigarettes to their tar and nicotine (NIC)content.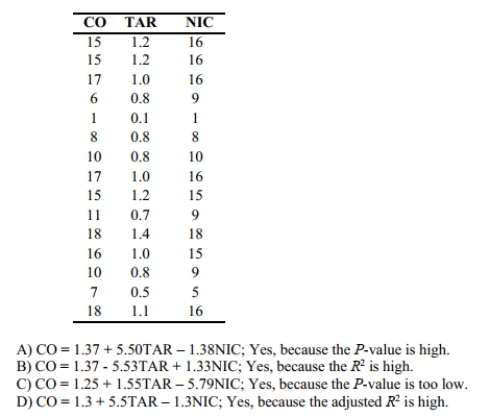
Of various brands of cigarettes to their tar and nicotine (NIC)content.
Question
Question
Question
Question
Question
Question
Use the given data to find the equation of the regression line. Round the final values to three significant digits, if necessary. 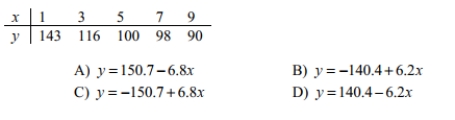
Question
Question
Based on the scatterplot, select the most likely value of the linear correlation coefficient r. 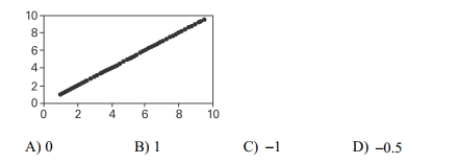
Question
Question
Question
Question
Question
Find the indicated multiple regression equation. Below are performance and attitude ratings of employees. 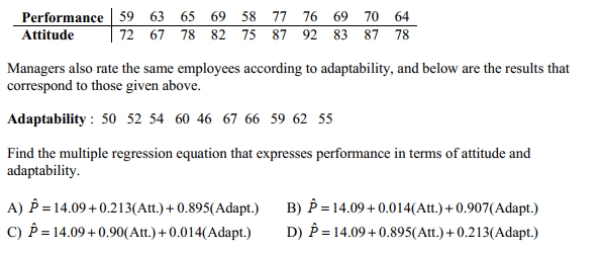
Question
Question
Question
Question
Question
Question
Construct a scatterplot for the given data. 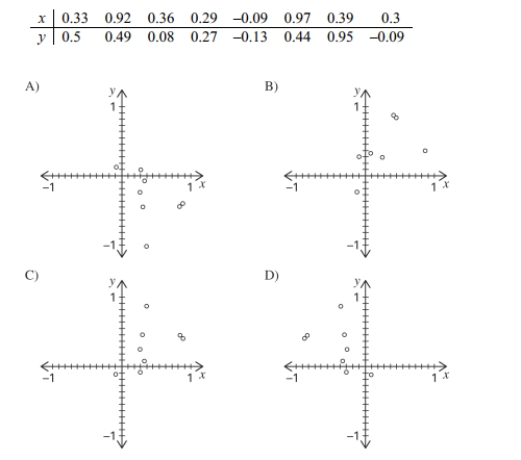
Question
Question
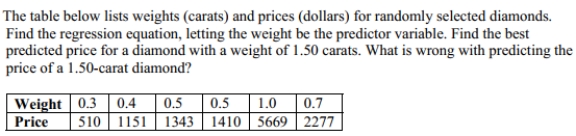
The table below shows the population of a city (in millions)in each year during the 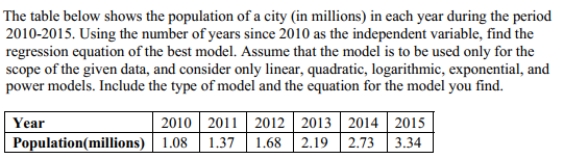
Question
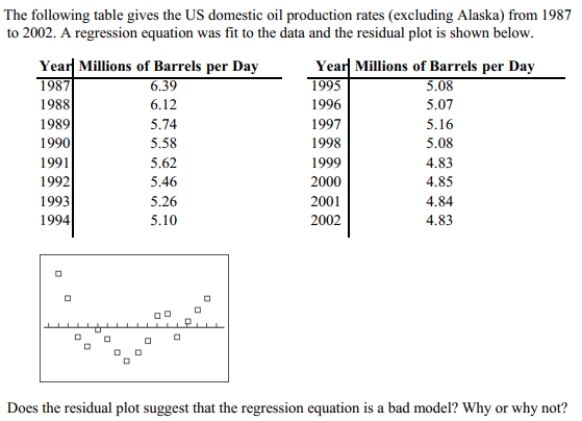
The following residual plot is obtained after a regression equation is determined for a set
of data. Does the residual plot suggest that the regression equation is a bad model? Why or
why not?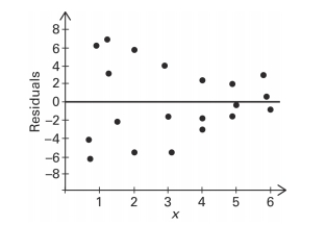
of data. Does the residual plot suggest that the regression equation is a bad model? Why or
why not?
Question
The results for several randomly selected students for test 1 and test 2 grades are given
below.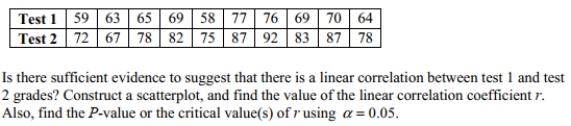
below.
Question
Question
Question
Question
Question
Question
Question
Question
Question
Question
The table lists the value y (in dollars)of $100 deposited in a certificate of deposit (CD)at a
bank after y years.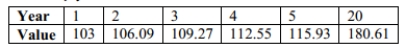 Construct a scatterplot and identify the mathematical model that best fits the given data.
Assume that the model is to be used only for the scope of the given data, and consider only
linear, quadratic, logarithmic, exponential, and power models. Include the type of model and
the equation for the model you find.
bank after y years.
Construct a scatterplot and identify the mathematical model that best fits the given data.Assume that the model is to be used only for the scope of the given data, and consider only
linear, quadratic, logarithmic, exponential, and power models. Include the type of model and
the equation for the model you find.
Question
Question
Question
Question
Question
Question
Question

Unlock Deck
Sign up to unlock the cards in this deck!
Unlock Deck
Unlock Deck
1/60
Play
Full screen (f)
Deck 10: Correlation and Regression
1
Use the given information to find the coefficient of determination. A regression equation is obtained for a collection of paired data. It is found that the total variation is 20.711, the
Explained variation is 18.592, and the unexplained variation is 2.119.
A) 1.114
B) 0.102
C) 0.898
D) 0.114
Explained variation is 18.592, and the unexplained variation is 2.119.
A) 1.114
B) 0.102
C) 0.898
D) 0.114
C
2
A(n)___________________________ is a point lying far away from other data points on a scatterplot.
A) outlier
B) marginal point
C) residual point
D) least-squares point
A) outlier
B) marginal point
C) residual point
D) least-squares point
A
3
B
4
Unlock Deck
Unlock for access to all 60 flashcards in this deck.
Unlock Deck
k this deck
5
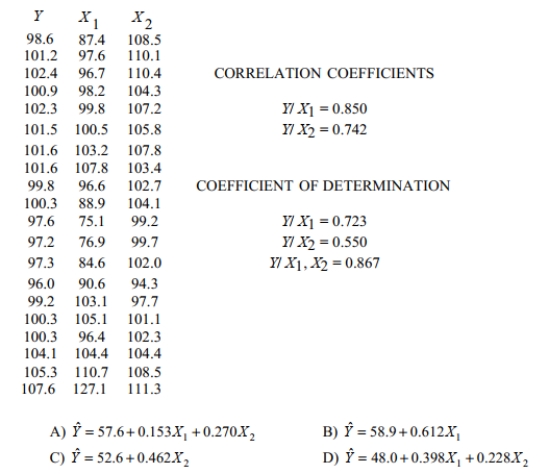
Use computer software to find the best multiple regression equation to explain the variation in the dependent variable, Y, in terms of the independent variables,
Unlock Deck
Unlock for access to all 60 flashcards in this deck.
Unlock Deck
k this deck
6
Find the value of the linear correlation coefficient r. The paired data below consist of the temperatures on randomly chosen days and the amount a certain kind of plant grew (in
Millimeters).
Millimeters).
Unlock Deck
Unlock for access to all 60 flashcards in this deck.
Unlock Deck
k this deck
7
A 0.05 significance level is being used to test a correlation between two variables. If th? linear correlation coefficient r is found to be 0.591 and the critical values are what can you conclude?
A) There is not sufficient evidence to support the claim of a linear correlation between the two variables.
B) There is sufficient evidence to support the claim of a linear correlation between the two variables.
what can you conclude?A) There is not sufficient evidence to support the claim of a linear correlation between the two variables.
B) There is sufficient evidence to support the claim of a linear correlation between the two variables.
Unlock Deck
Unlock for access to all 60 flashcards in this deck.
Unlock Deck
k this deck
8
Find the value of the linear correlation coefficient r. The paired data below consist of the costs of advertising (in thousands of dollars)and the number of products sold (in thousands).
Unlock Deck
Unlock for access to all 60 flashcards in this deck.
Unlock Deck
k this deck
9
Use the given data to find the equation of the regression line. Round the final values to three significant digits, if necessary. Two different tests are designed to measure employee
Productivity and dexterity. Several employees are randomly selected and tested with these
Results.
Productivity and dexterity. Several employees are randomly selected and tested with these
Results.
Unlock Deck
Unlock for access to all 60 flashcards in this deck.
Unlock Deck
k this deck
10
Use computer software to find the multiple regression equation. Can the equation be used for prediction? A wildlife analyst gathered the data in the table to develop an equation to predict
The weights of bears. He used WEIGHT as the dependent variable and CHEST, LENGTH,
And SEX as the independent variables. For SEX, he used male=1 and female=2.
The weights of bears. He used WEIGHT as the dependent variable and CHEST, LENGTH,
And SEX as the independent variables. For SEX, he used male=1 and female=2.
Unlock Deck
Unlock for access to all 60 flashcards in this deck.
Unlock Deck
k this deck
11
Unlock Deck
Unlock for access to all 60 flashcards in this deck.
Unlock Deck
k this deck
12
The residual is the difference between the ____________________ and the ___________________.
A) predicted value of y; observed value of y
B) observed value of y; predicted value of y
C) predicted value of x; observed value of x
D) observed value of x; predicted value of y
A) predicted value of y; observed value of y
B) observed value of y; predicted value of y
C) predicted value of x; observed value of x
D) observed value of x; predicted value of y
Unlock Deck
Unlock for access to all 60 flashcards in this deck.
Unlock Deck
k this deck
13
Use the given data to find the equation of the regression line. Round the final values to three significant digits, if necessary.
Unlock Deck
Unlock for access to all 60 flashcards in this deck.
Unlock Deck
k this deck
14
Unlock Deck
Unlock for access to all 60 flashcards in this deck.
Unlock Deck
k this deck
15
Unlock Deck
Unlock for access to all 60 flashcards in this deck.
Unlock Deck
k this deck
16
Unlock Deck
Unlock for access to all 60 flashcards in this deck.
Unlock Deck
k this deck
17
Given the linear correlation coefficient r and the sample size n, determine the critical values of r and use your finding to state whether or not the given r represents a significant linear
Correlation. Use a significance level of 0.05.
R = 0.543, n = 25
Correlation. Use a significance level of 0.05.
R = 0.543, n = 25
Unlock Deck
Unlock for access to all 60 flashcards in this deck.
Unlock Deck
k this deck
18
Determine which plot shows the strongest linear correlation.
Unlock Deck
Unlock for access to all 60 flashcards in this deck.
Unlock Deck
k this deck
19
Based on the scatterplot, select the most likely value of the linear correlation coefficient r.
Unlock Deck
Unlock for access to all 60 flashcards in this deck.
Unlock Deck
k this deck
20
Use computer software to find the multiple regression equation. Can the equation be used for prediction? An anti-smoking group used data in the table to relate the carbon monoxide( CO)
Of various brands of cigarettes to their tar and nicotine (NIC)content.
Of various brands of cigarettes to their tar and nicotine (NIC)content.
Unlock Deck
Unlock for access to all 60 flashcards in this deck.
Unlock Deck
k this deck
21
Unlock Deck
Unlock for access to all 60 flashcards in this deck.
Unlock Deck
k this deck
22
Unlock Deck
Unlock for access to all 60 flashcards in this deck.
Unlock Deck
k this deck
23
The residual is the ________________ the observed value of y and the predicted value of y.
A) sum of
B) difference between
C) product of
D) quotient of
A) sum of
B) difference between
C) product of
D) quotient of
Unlock Deck
Unlock for access to all 60 flashcards in this deck.
Unlock Deck
k this deck
24
Unlock Deck
Unlock for access to all 60 flashcards in this deck.
Unlock Deck
k this deck
25
Unlock Deck
Unlock for access to all 60 flashcards in this deck.
Unlock Deck
k this deck
26
Use the given data to find the equation of the regression line. Round the final values to three significant digits, if necessary.
Unlock Deck
Unlock for access to all 60 flashcards in this deck.
Unlock Deck
k this deck
27
Unlock Deck
Unlock for access to all 60 flashcards in this deck.
Unlock Deck
k this deck
28
Based on the scatterplot, select the most likely value of the linear correlation coefficient r.
Unlock Deck
Unlock for access to all 60 flashcards in this deck.
Unlock Deck
k this deck
29
Unlock Deck
Unlock for access to all 60 flashcards in this deck.
Unlock Deck
k this deck
30
Unlock Deck
Unlock for access to all 60 flashcards in this deck.
Unlock Deck
k this deck
31
A(n)___________________________ is a point that strongly affects the graph of the regression line.
A) least squares point
B) marginal point
C) residual point
D) influential point
A) least squares point
B) marginal point
C) residual point
D) influential point
Unlock Deck
Unlock for access to all 60 flashcards in this deck.
Unlock Deck
k this deck
32
Unlock Deck
Unlock for access to all 60 flashcards in this deck.
Unlock Deck
k this deck
33
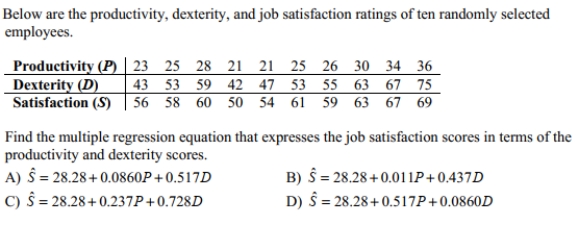
Find the indicated multiple regression equation. Below are performance and attitude ratings of employees.
Unlock Deck
Unlock for access to all 60 flashcards in this deck.
Unlock Deck
k this deck
34
Find the coefficient of determination, given that the value of the linear correlation coefficient, r, is 0.738.
A) 0.455
B) 0.545
C) 0.738
D) 0.262
A) 0.455
B) 0.545
C) 0.738
D) 0.262
Unlock Deck
Unlock for access to all 60 flashcards in this deck.
Unlock Deck
k this deck
35
Unlock Deck
Unlock for access to all 60 flashcards in this deck.
Unlock Deck
k this deck
36
Unlock Deck
Unlock for access to all 60 flashcards in this deck.
Unlock Deck
k this deck
37
Which of the following statements concerning the linear correlation coefficient are true? I: If the linear correlation coefficient for two variables is zero, then there is no relationship
Between the variables.
II: If the slope of the regression line is negative, then the linear correlation coefficient is
Negative.
III: The value of the linear correlation coefficient always lies between −1 and 1.
IV: A linear correlation coefficient of 0.62 suggests a stronger linear relationship than a linear
Correlation coefficient of -0.82.
A) I and IV
B) III and IV
C) II and III
D) I and II
Unlock Deck
Unlock for access to all 60 flashcards in this deck.
Unlock Deck
k this deck
38
Unlock Deck
Unlock for access to all 60 flashcards in this deck.
Unlock Deck
k this deck
39
Construct a scatterplot for the given data.
Unlock Deck
Unlock for access to all 60 flashcards in this deck.
Unlock Deck
k this deck
40
Unlock Deck
Unlock for access to all 60 flashcards in this deck.
Unlock Deck
k this deck
41
The table below shows the population of a city (in millions)in each year during the
Unlock Deck
Unlock for access to all 60 flashcards in this deck.
Unlock Deck
k this deck
42
The following residual plot is obtained after a regression equation is determined for a set
of data. Does the residual plot suggest that the regression equation is a bad model? Why or
why not?
of data. Does the residual plot suggest that the regression equation is a bad model? Why or
why not?
Unlock Deck
Unlock for access to all 60 flashcards in this deck.
Unlock Deck
k this deck
43
The results for several randomly selected students for test 1 and test 2 grades are given
below.
below.
Unlock Deck
Unlock for access to all 60 flashcards in this deck.
Unlock Deck
k this deck
44
Unlock Deck
Unlock for access to all 60 flashcards in this deck.
Unlock Deck
k this deck
45
For each of 200 randomly selected cities, Pete recorded the number of churches in the city
(x)and the number of homicides in the past decade (y). He calculated the linear
correlation coefficient and was surprised to find a strong positive linear correlation for the
two variables. Does this suggest that building new churches causes an increase in the number
of homicides? Why do you think that a strong positive linear correlation coefficient was
obtained? Explain your answer with reference to the term lurking variable.
Unlock Deck
Unlock for access to all 60 flashcards in this deck.
Unlock Deck
k this deck
46
Unlock Deck
Unlock for access to all 60 flashcards in this deck.
Unlock Deck
k this deck
47
Describe what scatterplots are and discuss the importance of creating scatterplots.
Unlock Deck
Unlock for access to all 60 flashcards in this deck.
Unlock Deck
k this deck
48
A regression equation is obtained for a set of data. After examining a scatter diagram, the
researcher notices a data point that is potentially an influential point. How could she
confirm that this data point is indeed an influential point?
researcher notices a data point that is potentially an influential point. How could she
confirm that this data point is indeed an influential point?
Unlock Deck
Unlock for access to all 60 flashcards in this deck.
Unlock Deck
k this deck
49
Unlock Deck
Unlock for access to all 60 flashcards in this deck.
Unlock Deck
k this deck
50
Unlock Deck
Unlock for access to all 60 flashcards in this deck.
Unlock Deck
k this deck
51
Suppose there is significant correlation between two variables. Describe two cases under
which it might be inappropriate to use the linear regression equation for prediction. Give
examples to support these cases.
which it might be inappropriate to use the linear regression equation for prediction. Give
examples to support these cases.
Unlock Deck
Unlock for access to all 60 flashcards in this deck.
Unlock Deck
k this deck
52
Sketch an example of a residual plot that suggests that a regression equation is not a good
model. Be sure to include at least 10 points in your example.
model. Be sure to include at least 10 points in your example.
Unlock Deck
Unlock for access to all 60 flashcards in this deck.
Unlock Deck
k this deck
53
The table lists the value y (in dollars)of $100 deposited in a certificate of deposit (CD)at a
bank after y years. Construct a scatterplot and identify the mathematical model that best fits the given data.
Assume that the model is to be used only for the scope of the given data, and consider only
linear, quadratic, logarithmic, exponential, and power models. Include the type of model and
the equation for the model you find.
bank after y years.
Construct a scatterplot and identify the mathematical model that best fits the given data.Assume that the model is to be used only for the scope of the given data, and consider only
linear, quadratic, logarithmic, exponential, and power models. Include the type of model and
the equation for the model you find.
Unlock Deck
Unlock for access to all 60 flashcards in this deck.
Unlock Deck
k this deck
54
Unlock Deck
Unlock for access to all 60 flashcards in this deck.
Unlock Deck
k this deck
55
Give an example of a pair of variables which you would expect to have a negative linear
correlation coefficient and explain why.
correlation coefficient and explain why.
Unlock Deck
Unlock for access to all 60 flashcards in this deck.
Unlock Deck
k this deck
56
Give an example of a pair of variables whose linear correlation coefficient is likely to be
close to zero.
close to zero.
Unlock Deck
Unlock for access to all 60 flashcards in this deck.
Unlock Deck
k this deck
57
Define the terms predictor variable and response variable. Give examples for each.
Unlock Deck
Unlock for access to all 60 flashcards in this deck.
Unlock Deck
k this deck
58
Sketch a sample scatterplot of at least 5 points that would have a linear correlation coefficient
equal to −1.
equal to −1.
Unlock Deck
Unlock for access to all 60 flashcards in this deck.
Unlock Deck
k this deck
59
Unlock Deck
Unlock for access to all 60 flashcards in this deck.
Unlock Deck
k this deck
60
Unlock Deck
Unlock for access to all 60 flashcards in this deck.
Unlock Deck
k this deck
Unlock Deck
Unlock for access to all 60 flashcards in this deck.


