Deck 11: Multiple Comparisons and Analysis of Variance
Full screen (f)
Question
Question
Question
Question
Use the following information for the question. A group of home gardeners want to test whether the type of soil used to grow
heirloom tomatoes has an effect on the number of tomatoes harvested. Gardeners randomly assigned tomato plants to be
grown in soil with no fertilizer, commercial plant food, and homemade compost. All other growing conditions were kept the
same. Forty plants were assigned to each group. At the end of the growing season the number of tomatoes harvested was
counted. Assume that all other conditions for the ANOVA test have been met.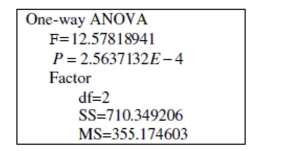
State the null and alternative hypothesis.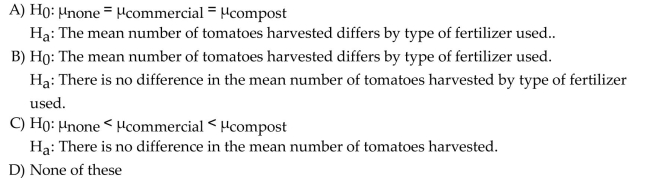
Question
Question
Question
Question
Question
Question
Question
Use the following information for the question. A group of home gardeners want to test whether the type of soil used to grow
heirloom tomatoes has an effect on the number of tomatoes harvested. Gardeners randomly assigned tomato plants to be
grown in soil with no fertilizer, commercial plant food, and homemade compost. All other growing conditions were kept the
same. Forty plants were assigned to each group. At the end of the growing season the number of tomatoes harvested was
counted. Assume that all other conditions for the ANOVA test have been met.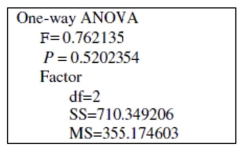
Using the test results provided, test the hypothesis that soil treatment affects the number of tomatoes harvested. Use a significance level of 5%. Choose the correct decision regarding the null
Hypothesis and correct conclusion.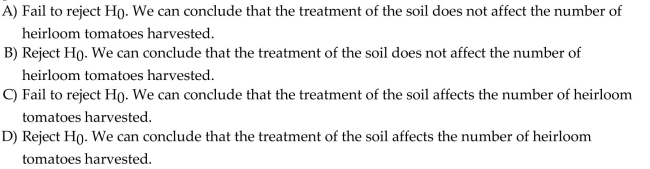
Question
Use the following information for the question. Researchers conducted a study that examined marital status and stress levels.
A hypothesis test was conducted to test the claim that people with different marital statuses have a different mean stress
level. The TI-84 output for the test is shown below.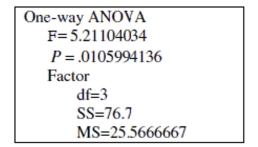
State the null and alternative hypothesis.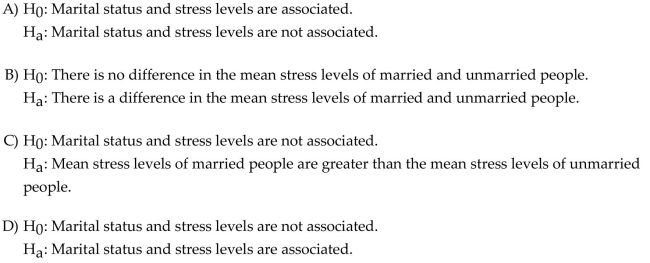
A hypothesis test was conducted to test the claim that people with different marital statuses have a different mean stress
level. The TI-84 output for the test is shown below.
State the null and alternative hypothesis.
Question
Question
Question
Question
State the null and alternative hypothesis. 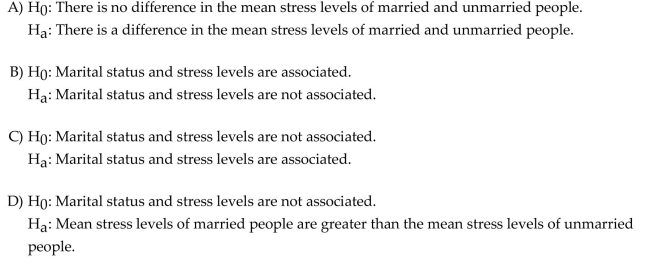
Question
Use the following information to answer the question. Researchers want to test whether the color of a vehicle ticketed for
speeding has an effect on the amount of the ticket. Four vehicle colors were used for the study--red, white, black, and silver.
Thirty vehicles were randomly assigned to each group. Use the output below to answer the question.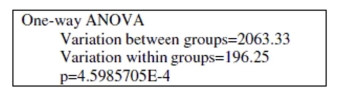
Do the ANOVA test results warrant a Post-hoc procedure?
A) Yes
B) No
speeding has an effect on the amount of the ticket. Four vehicle colors were used for the study--red, white, black, and silver.
Thirty vehicles were randomly assigned to each group. Use the output below to answer the question.
Do the ANOVA test results warrant a Post-hoc procedure?
A) Yes
B) No
Question
Use the following information to answer the question. Researchers want to test whether the color of a vehicle ticketed for
speeding has an effect on the amount of the ticket. Four vehicle colors were used for the study--red, white, black, and silver.
Thirty vehicles were randomly assigned to each group. Use the output below to answer the question.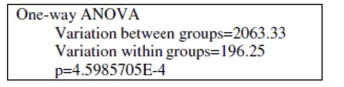
Choose the correct conclusion for the hypothesis that vehicle color affects the amount of a speeding ticket. Assume all ANOVA test conditions have been satisfied.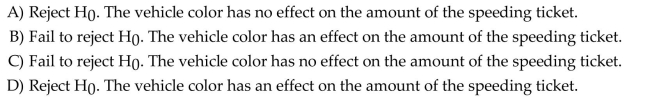
Question
Question
A movie studio did a poll to determine whether women in different age groups watched different amounts of horror movies. Check the computer output to see whether the same-variance condition
For ANOVA holds. Is ANOVA appropriate?
A) Yes
B) No
For ANOVA holds. Is ANOVA appropriate?
A) Yes
B) No
Question
Use the following information to answer the question. Researchers want to test whether the color of a vehicle ticketed for
speeding has an effect on the amount of the ticket. Four vehicle colors were used for the study--red, white, black, and silver.
Thirty vehicles were randomly assigned to each group. Use the output below to answer the question.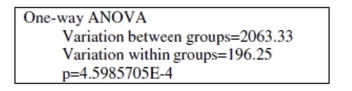
Compute the F-statistic. Round to the nearest hundredth.
A) 0.10
B) Not enough information is given
C) 35.48
D) 10.51
Question
Use the following information to answer the question. Researchers want to test whether the color of a vehicle ticketed for
speeding has an effect on the amount of the ticket. Four vehicle colors were used for the study--red, white, black, and silver.
Thirty vehicles were randomly assigned to each group. Use the output below to answer the question.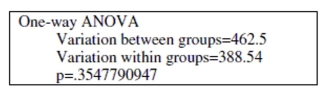
Do the ANOVA test results warrant a Post-hoc procedure?
A) No
B) Yes
speeding has an effect on the amount of the ticket. Four vehicle colors were used for the study--red, white, black, and silver.
Thirty vehicles were randomly assigned to each group. Use the output below to answer the question.
Do the ANOVA test results warrant a Post-hoc procedure?
A) No
B) Yes
Question
An ANOVA test was conducted to see whether bike frame type (Type A, Type B, or Type C) had an effect on speed over a one mile distance. Test results warranted post-hoc procedures. The Tukey
HSD approach was used with the following results:
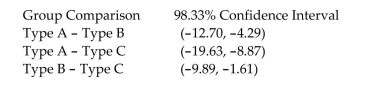
Is there evidence that one type of bike frame is faster than the others? Which type of frame appears
To be the fastest?
A) No, there is not enough evidence to say with confidence that one frame type is faster than the others because none of the confidence intervals contain zero.
B) Yes, the confidence interval results show that frame type A is the faster than B or C.
C) Yes, the confidence interval results show that frame type B is the faster than A or C.
D) Yes, the confidence interval results show that frame type C is the faster than A or B.
HSD approach was used with the following results:
Is there evidence that one type of bike frame is faster than the others? Which type of frame appears
To be the fastest?
A) No, there is not enough evidence to say with confidence that one frame type is faster than the others because none of the confidence intervals contain zero.
B) Yes, the confidence interval results show that frame type A is the faster than B or C.
C) Yes, the confidence interval results show that frame type B is the faster than A or C.
D) Yes, the confidence interval results show that frame type C is the faster than A or B.
Question
Question
Question
Question
Question
Question
Use the following information to answer the question. Researchers want to test whether the color of a vehicle ticketed for
speeding has an effect on the amount of the ticket. Four vehicle colors were used for the study--red, white, black, and silver.
Thirty vehicles were randomly assigned to each group. Use the output below to answer the question.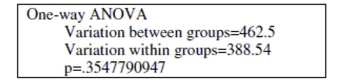
Choose the correct conclusion for the hypothesis that vehicle color affects the amount of a speeding ticket. Assume all ANOVA test conditions have been satisfied.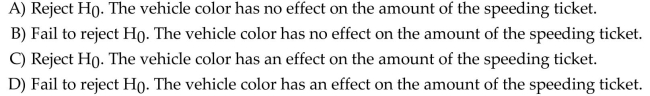
Question
Question
A movie studio did a poll to determine whether women in different age groups watched different amounts of horror movies. Check the computer output to see whether the same-variance condition
For ANOVA holds. Is ANOVA appropriate?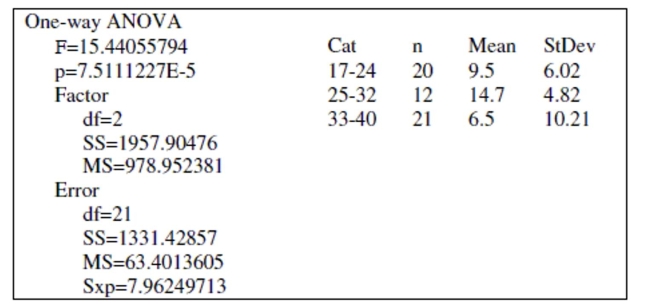
A) No
B) Yes
For ANOVA holds. Is ANOVA appropriate?
A) No
B) Yes
Question
Use the following information for the question. A group of home gardeners want to test whether the type of soil used to grow
heirloom tomatoes has an effect on the number of tomatoes harvested. Gardeners randomly assigned tomato plants to be
grown in soil with no fertilizer, commercial plant food, and homemade compost. All other growing conditions were kept the
same. Forty plants were assigned to each group. At the end of the growing season the number of tomatoes harvested was
counted. Assume that all other conditions for the ANOVA test have been met.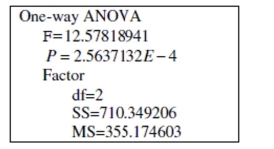
Using the test results provided, test the hypothesis that soil treatment affects the number of tomatoes harvested. Use a significance level of 5%. Choose the correct decision regarding the null
Hypothesis and correct conclusion.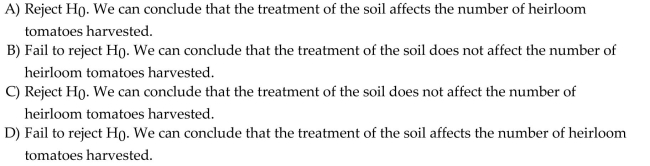
heirloom tomatoes has an effect on the number of tomatoes harvested. Gardeners randomly assigned tomato plants to be
grown in soil with no fertilizer, commercial plant food, and homemade compost. All other growing conditions were kept the
same. Forty plants were assigned to each group. At the end of the growing season the number of tomatoes harvested was
counted. Assume that all other conditions for the ANOVA test have been met.
Using the test results provided, test the hypothesis that soil treatment affects the number of tomatoes harvested. Use a significance level of 5%. Choose the correct decision regarding the null
Hypothesis and correct conclusion.
Question
Question
Use the following information for the question. Researchers conducted a study that examined marital status and stress levels.
A hypothesis test was conducted to test the claim that people with different marital statuses have a different mean stress
level. The TI-84 output for the test is shown below.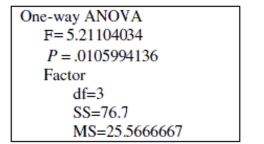
What is the value of the test statistic? Round to the nearest hundredth if necessary.
A) 5.21
B) 76.70
C) Can't be determined with the given information
D) 25.27
Question
Question
Question
Question
Use the following information for the question. A group of home gardeners want to test whether the type of soil used to grow
heirloom tomatoes has an effect on the number of tomatoes harvested. Gardeners randomly assigned tomato plants to be
grown in soil with no fertilizer, commercial plant food, and homemade compost. All other growing conditions were kept the
same. Forty plants were assigned to each group. At the end of the growing season the number of tomatoes harvested was
counted. Assume that all other conditions for the ANOVA test have been met.
State the null and alternative hypothesis.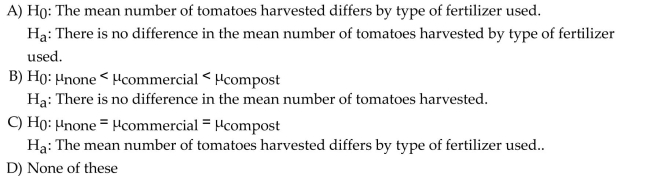
Question
Question
Question
Question
Question
Question
Question
Question
Question
Question
Question
Use the following information for the questions. A group of home gardeners want to test whether the type of soil used to grow carrots has an effect on the number of carrots harvested. Gardeners randomly assigned carrot plants to be grown in soil with no fertilizer, commercial plant food, and homemade compost. All other growing conditions were kept the same. Fifty plants were assigned to each group. At the end of the growing season the number of carrots harvested was counted. Use the output below to answer the question. Assume that all other conditions for the ANOVA test have been met.
-Interpret the boxplots given. Compare medians, interquartile ranges, and shapes, and mention any potential outliers.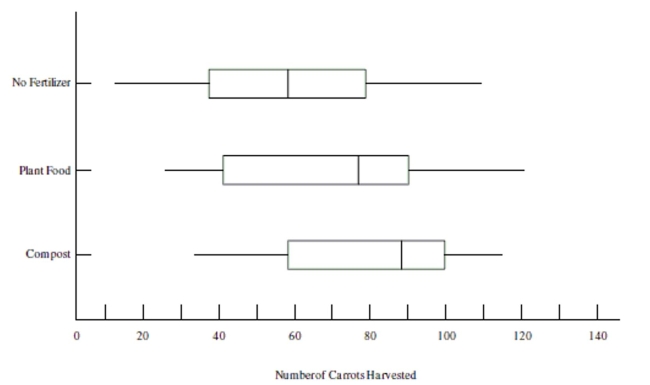
-Interpret the boxplots given. Compare medians, interquartile ranges, and shapes, and mention any potential outliers.
Question
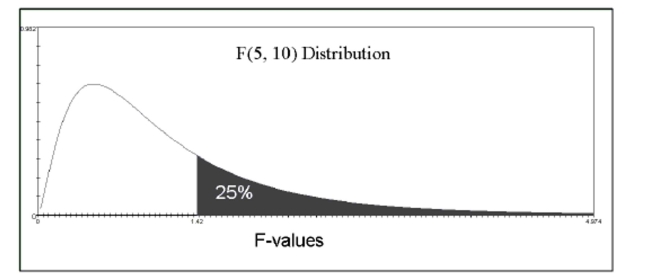
The figure below shows the F-distribution with 5 and 10 degrees of freedom to test the hypothesis that age groups and reading speed are associated. The shaded area represents the p-value. Assume that all conditions for ANOVA have been met. Should the null hypothesis that the age group population means are equal be rejected?
What conclusion can be drawn about the association between age group and reading speed?
What conclusion can be drawn about the association between age group and reading speed?
Question
Question
Question
Question
Question
Question
Question
Question
Question
Question

Unlock Deck
Sign up to unlock the cards in this deck!
Unlock Deck
Unlock Deck
1/60
Play
Full screen (f)
Deck 11: Multiple Comparisons and Analysis of Variance
1
In the context of the ANOVA test, which of the following phrases is equivalent to the phrase "variation within groups?"
A) Residual variation
B) Unexplained variation
C) Variation due to error
D) All of these
A) Residual variation
B) Unexplained variation
C) Variation due to error
D) All of these
D
2
Suppose you have observations from six different regions within your state and you wish to do hypothesis tests to compare the mean income across groups. How many comparisons can be done
With six groups?
A) 30
B) 11
C) 15
D) 20
With six groups?
A) 30
B) 11
C) 15
D) 20
C
3
What is the value of the test statistic? Round to the nearest hundredth if necessary.
A) Can't be determined with the given information
B) 5.21
C) 76.70
D) 25.27
A) Can't be determined with the given information
B) 5.21
C) 76.70
D) 25.27
B
4
Use the following information for the question. A group of home gardeners want to test whether the type of soil used to grow
heirloom tomatoes has an effect on the number of tomatoes harvested. Gardeners randomly assigned tomato plants to be
grown in soil with no fertilizer, commercial plant food, and homemade compost. All other growing conditions were kept the
same. Forty plants were assigned to each group. At the end of the growing season the number of tomatoes harvested was
counted. Assume that all other conditions for the ANOVA test have been met.
State the null and alternative hypothesis.
heirloom tomatoes has an effect on the number of tomatoes harvested. Gardeners randomly assigned tomato plants to be
grown in soil with no fertilizer, commercial plant food, and homemade compost. All other growing conditions were kept the
same. Forty plants were assigned to each group. At the end of the growing season the number of tomatoes harvested was
counted. Assume that all other conditions for the ANOVA test have been met.
State the null and alternative hypothesis.
Unlock Deck
Unlock for access to all 60 flashcards in this deck.
Unlock Deck
k this deck
5
Suppose you have observations from five different regions within your state and you wish to do hypothesis tests to compare the mean home value across groups. Using the Bonferroni Correction,
What significance level should you use for each hypothesis test if you want an overall significance
Of 0.05? Round to the nearest thousandth.
A) 0.005
B) 0.050
C) 0.010
D) None of these
What significance level should you use for each hypothesis test if you want an overall significance
Of 0.05? Round to the nearest thousandth.
A) 0.005
B) 0.050
C) 0.010
D) None of these
Unlock Deck
Unlock for access to all 60 flashcards in this deck.
Unlock Deck
k this deck
6
Which of the following is not one of the conditions that must be checked in order for the calculated F-statistic to follow the F-distribution.
A) The groups are independent of each other.
B) The distribution of the observations is Normal in each group's population or the sample size is large.
C) The variances or standard deviations of the groups must be equal.
D) Each group's population must be at least 10 times larger than its respective sample.
Unlock Deck
Unlock for access to all 60 flashcards in this deck.
Unlock Deck
k this deck
7
Choose the appropriate test for the following situation: You wish to test whether an association exists between type of vehicle purchased and vehicle color.
A) Two-sample t-test
B) Chi-square test
C) One-sample t-test
D) ANOVA
A) Two-sample t-test
B) Chi-square test
C) One-sample t-test
D) ANOVA
Unlock Deck
Unlock for access to all 60 flashcards in this deck.
Unlock Deck
k this deck
8
Choose the statement that is not true about multiple comparisons and ANOVA. Choose (d) if all the statements are true.
A) When doing multiple comparisons, the response variable is always numerical, but the independent variable can be numerical or categorical.
B) ANOVA is a method for testing whether there is an association between a categorical variable and a numerical variable.
C) When doing a multiple comparison, the overall significance level will increase meaning it is more likely that an incorrect conclusion will be drawn.
D) All of these statements are true.
Unlock Deck
Unlock for access to all 60 flashcards in this deck.
Unlock Deck
k this deck
9
Suppose you have observations from six different regions within your state and you wish to do hypothesis tests to compare the mean income across groups. Using the Bonferroni Correction, what
Significance level should you use for each hypothesis test if you want an overall significance of
0)10? Round to the nearest thousandth.
A) 0.050
B) 0.033
C) 0.007
D) None of these
Significance level should you use for each hypothesis test if you want an overall significance of
0)10? Round to the nearest thousandth.
A) 0.050
B) 0.033
C) 0.007
D) None of these
Unlock Deck
Unlock for access to all 60 flashcards in this deck.
Unlock Deck
k this deck
10
Choose the appropriate test for the following situation: You wish to test whether an association exists between the type of vehicle a driver owns and the cost of speeding tickets.
A) ANOVA
B) Chi-square test
C) One-sample t-test
D) Two-sample t-test
A) ANOVA
B) Chi-square test
C) One-sample t-test
D) Two-sample t-test
Unlock Deck
Unlock for access to all 60 flashcards in this deck.
Unlock Deck
k this deck
11
Use the following information for the question. A group of home gardeners want to test whether the type of soil used to grow
heirloom tomatoes has an effect on the number of tomatoes harvested. Gardeners randomly assigned tomato plants to be
grown in soil with no fertilizer, commercial plant food, and homemade compost. All other growing conditions were kept the
same. Forty plants were assigned to each group. At the end of the growing season the number of tomatoes harvested was
counted. Assume that all other conditions for the ANOVA test have been met.
Using the test results provided, test the hypothesis that soil treatment affects the number of tomatoes harvested. Use a significance level of 5%. Choose the correct decision regarding the null
Hypothesis and correct conclusion.
Unlock Deck
Unlock for access to all 60 flashcards in this deck.
Unlock Deck
k this deck
12
Use the following information for the question. Researchers conducted a study that examined marital status and stress levels.
A hypothesis test was conducted to test the claim that people with different marital statuses have a different mean stress
level. The TI-84 output for the test is shown below.
State the null and alternative hypothesis.
A hypothesis test was conducted to test the claim that people with different marital statuses have a different mean stress
level. The TI-84 output for the test is shown below.
State the null and alternative hypothesis.
Unlock Deck
Unlock for access to all 60 flashcards in this deck.
Unlock Deck
k this deck
13
Identify the test statistic used for the ANOVA procedure and how it is calculated.
A) The test statistic is z and is calculated by finding the mean z-score between groups.
B) The test statistic is F and is calculated by finding the difference between group means.
C) The test statistic is F and is the ratio of the variation between groups to the variation within groups.
D) The test statistic is z and is the ratio of the mean within a group to the variation between groups.
Unlock Deck
Unlock for access to all 60 flashcards in this deck.
Unlock Deck
k this deck
14
An ANOVA test was conducted to see whether bike frame type (Type A, Type B, or Type C) had an effect on speed over a one mile distance. Test results warranted post-hoc procedures. The Tukey HSD approach was used with the following results:
Is there evidence that one type of bike frame is faster than the others?
Which type of frame appears To be the fastest?
A) Yes, the confidence interval results show that frame type A is the faster than B or C. B) Yes, the confidence interval results show that frame type C is the faster than A or B. C) Yes, the confidence interval results show that frame type B is the faster than A or C. D) No, there is not enough evidence to say with confidence that one frame type is faster than the others because none of the confidence intervals contain zero.
Unlock Deck
Unlock for access to all 60 flashcards in this deck.
Unlock Deck
k this deck
15
Choose the statement that best describes the F-statistic for the ANOVA test.
A) The F-statistic compares the variation between groups to the variation within groups. A large F-statistic indicates that variation between groups is large relative to variation within groups.
B) The F-statistic compares the variation between groups to the variation within groups. A large F-statistic indicates that variation between groups is small relative to variation within
Groups.
C) The F-statistic is the probability of getting the sample results, assuming that there is no difference in the groups.
D) None of these
Unlock Deck
Unlock for access to all 60 flashcards in this deck.
Unlock Deck
k this deck
16
State the null and alternative hypothesis.
Unlock Deck
Unlock for access to all 60 flashcards in this deck.
Unlock Deck
k this deck
17
Use the following information to answer the question. Researchers want to test whether the color of a vehicle ticketed for
speeding has an effect on the amount of the ticket. Four vehicle colors were used for the study--red, white, black, and silver.
Thirty vehicles were randomly assigned to each group. Use the output below to answer the question.
Do the ANOVA test results warrant a Post-hoc procedure?
A) Yes
B) No
speeding has an effect on the amount of the ticket. Four vehicle colors were used for the study--red, white, black, and silver.
Thirty vehicles were randomly assigned to each group. Use the output below to answer the question.
Do the ANOVA test results warrant a Post-hoc procedure?
A) Yes
B) No
Unlock Deck
Unlock for access to all 60 flashcards in this deck.
Unlock Deck
k this deck
18
Use the following information to answer the question. Researchers want to test whether the color of a vehicle ticketed for
speeding has an effect on the amount of the ticket. Four vehicle colors were used for the study--red, white, black, and silver.
Thirty vehicles were randomly assigned to each group. Use the output below to answer the question.
Choose the correct conclusion for the hypothesis that vehicle color affects the amount of a speeding ticket. Assume all ANOVA test conditions have been satisfied.
Unlock Deck
Unlock for access to all 60 flashcards in this deck.
Unlock Deck
k this deck
19
Suppose a researcher collected data to compare whether dogs of different size categories differed in mean cost to a pet owner. Dogs were categorized as small, medium, or large. Cost was calculated as The average annual amount spent on food, veterinary visits, and medications. The calculated
F-statistic was 421.58. Given this test statistic, which of the following is the most reasonable
Conclusion?
A) The F-statistic shows that variation between groups is larger than variation within groups, therefore, the researcher will likely conclude that there is an association between dog size and
Mean cost to the pet owner.
B) The F-statistic shows that large dogs have a significantly higher cost to the pet own than the other categories, therefore, the researcher will conclude that there is an association between
Dog size and mean cost to the pet owner.
C) The F-statistic shows that variation within groups is larger than variation between groups, therefore, the researcher will likely conclude that there is not an association between dog size
And mean cost to the pet owner.
D) None of these
Unlock Deck
Unlock for access to all 60 flashcards in this deck.
Unlock Deck
k this deck
20
A movie studio did a poll to determine whether women in different age groups watched different amounts of horror movies. Check the computer output to see whether the same-variance condition
For ANOVA holds. Is ANOVA appropriate?
A) Yes
B) No
For ANOVA holds. Is ANOVA appropriate?
A) Yes
B) No
Unlock Deck
Unlock for access to all 60 flashcards in this deck.
Unlock Deck
k this deck
21
Use the following information to answer the question. Researchers want to test whether the color of a vehicle ticketed for
speeding has an effect on the amount of the ticket. Four vehicle colors were used for the study--red, white, black, and silver.
Thirty vehicles were randomly assigned to each group. Use the output below to answer the question.
Compute the F-statistic. Round to the nearest hundredth.
A) 0.10
B) Not enough information is given
C) 35.48
D) 10.51
Unlock Deck
Unlock for access to all 60 flashcards in this deck.
Unlock Deck
k this deck
22
Use the following information to answer the question. Researchers want to test whether the color of a vehicle ticketed for
speeding has an effect on the amount of the ticket. Four vehicle colors were used for the study--red, white, black, and silver.
Thirty vehicles were randomly assigned to each group. Use the output below to answer the question.
Do the ANOVA test results warrant a Post-hoc procedure?
A) No
B) Yes
speeding has an effect on the amount of the ticket. Four vehicle colors were used for the study--red, white, black, and silver.
Thirty vehicles were randomly assigned to each group. Use the output below to answer the question.
Do the ANOVA test results warrant a Post-hoc procedure?
A) No
B) Yes
Unlock Deck
Unlock for access to all 60 flashcards in this deck.
Unlock Deck
k this deck
23
An ANOVA test was conducted to see whether bike frame type (Type A, Type B, or Type C) had an effect on speed over a one mile distance. Test results warranted post-hoc procedures. The Tukey
HSD approach was used with the following results:
Is there evidence that one type of bike frame is faster than the others? Which type of frame appears
To be the fastest?
A) No, there is not enough evidence to say with confidence that one frame type is faster than the others because none of the confidence intervals contain zero.
B) Yes, the confidence interval results show that frame type A is the faster than B or C.
C) Yes, the confidence interval results show that frame type B is the faster than A or C.
D) Yes, the confidence interval results show that frame type C is the faster than A or B.
Unlock Deck
Unlock for access to all 60 flashcards in this deck.
Unlock Deck
k this deck
24
Choose the statement that is not true about multiple comparisons and ANOVA. Choose (d) if all the statements are true.
A) When doing multiple comparisons, the response variable is always numerical, but the independent variable can be numerical or categorical.
B) When doing a multiple comparison, the overall significance level will increase meaning it is more likely that an incorrect conclusion will be drawn.
C) ANOVA is a method for testing whether there is an association between a categorical variable and a numerical variable.
D) All of these statements are true.
Unlock Deck
Unlock for access to all 60 flashcards in this deck.
Unlock Deck
k this deck
25
Suppose you have observations from five different regions within your state and you wish to do hypothesis tests to compare the mean home value across groups. How many comparisons can be
Done with six groups?
A) 30
B) 20
C) 15
D) 10
Done with six groups?
A) 30
B) 20
C) 15
D) 10
Unlock Deck
Unlock for access to all 60 flashcards in this deck.
Unlock Deck
k this deck
26
Compute the F-statistic. Round to the nearest hundredth.
A) Not enough information is given
B) 1.19
C) 0.84
D) 0.35
A) Not enough information is given
B) 1.19
C) 0.84
D) 0.35
Unlock Deck
Unlock for access to all 60 flashcards in this deck.
Unlock Deck
k this deck
27
Choose the statement that best describes the purpose of ANOVA.
A) ANOVA is a procedure for comparing the means of several groups.
B) The ANOVA procedure will reveal whether the means of several groups are different and which group or groups have a different mean.
C) ANOVA is a procedure for comparing different categories for several groups.
D) None of these
A) ANOVA is a procedure for comparing the means of several groups.
B) The ANOVA procedure will reveal whether the means of several groups are different and which group or groups have a different mean.
C) ANOVA is a procedure for comparing different categories for several groups.
D) None of these
Unlock Deck
Unlock for access to all 60 flashcards in this deck.
Unlock Deck
k this deck
28
In the context of the ANOVA test, which of the following phrases is equivalent to the phrase "variation between groups?"
A) Variation due to treatment
B) Explained variation
C) Variation due to factors
D) All of these
A) Variation due to treatment
B) Explained variation
C) Variation due to factors
D) All of these
Unlock Deck
Unlock for access to all 60 flashcards in this deck.
Unlock Deck
k this deck
29
Use the following information to answer the question. Researchers want to test whether the color of a vehicle ticketed for
speeding has an effect on the amount of the ticket. Four vehicle colors were used for the study--red, white, black, and silver.
Thirty vehicles were randomly assigned to each group. Use the output below to answer the question.
Choose the correct conclusion for the hypothesis that vehicle color affects the amount of a speeding ticket. Assume all ANOVA test conditions have been satisfied.
Unlock Deck
Unlock for access to all 60 flashcards in this deck.
Unlock Deck
k this deck
30
Choose the appropriate test for the following situation: You wish to test whether an association exists between the type of vehicle purchased and how many children the buyer has.
A) ANOVA
B) One-sample t-test
C) Two-sample t-test
D) Chi-square test
A) ANOVA
B) One-sample t-test
C) Two-sample t-test
D) Chi-square test
Unlock Deck
Unlock for access to all 60 flashcards in this deck.
Unlock Deck
k this deck
31
A movie studio did a poll to determine whether women in different age groups watched different amounts of horror movies. Check the computer output to see whether the same-variance condition
For ANOVA holds. Is ANOVA appropriate?
A) No
B) Yes
For ANOVA holds. Is ANOVA appropriate?
A) No
B) Yes
Unlock Deck
Unlock for access to all 60 flashcards in this deck.
Unlock Deck
k this deck
32
Use the following information for the question. A group of home gardeners want to test whether the type of soil used to grow
heirloom tomatoes has an effect on the number of tomatoes harvested. Gardeners randomly assigned tomato plants to be
grown in soil with no fertilizer, commercial plant food, and homemade compost. All other growing conditions were kept the
same. Forty plants were assigned to each group. At the end of the growing season the number of tomatoes harvested was
counted. Assume that all other conditions for the ANOVA test have been met.
Using the test results provided, test the hypothesis that soil treatment affects the number of tomatoes harvested. Use a significance level of 5%. Choose the correct decision regarding the null
Hypothesis and correct conclusion.
heirloom tomatoes has an effect on the number of tomatoes harvested. Gardeners randomly assigned tomato plants to be
grown in soil with no fertilizer, commercial plant food, and homemade compost. All other growing conditions were kept the
same. Forty plants were assigned to each group. At the end of the growing season the number of tomatoes harvested was
counted. Assume that all other conditions for the ANOVA test have been met.
Using the test results provided, test the hypothesis that soil treatment affects the number of tomatoes harvested. Use a significance level of 5%. Choose the correct decision regarding the null
Hypothesis and correct conclusion.
Unlock Deck
Unlock for access to all 60 flashcards in this deck.
Unlock Deck
k this deck
33
Which of the following is not one of the conditions that must be checked in order for the calculated F-statistic to follow the F-distribution.
A) The distribution of the observations is Normal in each group's population or the sample size is large.
B) The variances or standard deviations of the groups must be equal.
C) The groups are independent of each other.
D) Each group's population must be at least 10 times larger than its respective sample.
Unlock Deck
Unlock for access to all 60 flashcards in this deck.
Unlock Deck
k this deck
34
Use the following information for the question. Researchers conducted a study that examined marital status and stress levels.
A hypothesis test was conducted to test the claim that people with different marital statuses have a different mean stress
level. The TI-84 output for the test is shown below.
What is the value of the test statistic? Round to the nearest hundredth if necessary.
A) 5.21
B) 76.70
C) Can't be determined with the given information
D) 25.27
Unlock Deck
Unlock for access to all 60 flashcards in this deck.
Unlock Deck
k this deck
35
Choose the statement that best describes the F-statistic for the ANOVA test.
A) The F-statistic is the probability of getting the sample results, assuming that there is no difference in the groups.
B) The F-statistic compares the variation between groups to the variation within groups. A small F-statistic indicates that variation between groups is large relative to variation within groups.
C) The F-statistic compares the variation between groups to the variation within groups. A small F-statistic indicates that variation between groups is small relative to variation within
Groups.
D) None of these
Unlock Deck
Unlock for access to all 60 flashcards in this deck.
Unlock Deck
k this deck
36
Choose the statement that best describes the purpose of ANOVA.
A) ANOVA is a procedure for comparing the means of several groups.
B) ANOVA is a procedure for comparing different categories for several groups.
C) The ANOVA procedure will reveal whether the means of several groups are different and which group or groups have a different mean.
D) None of these
A) ANOVA is a procedure for comparing the means of several groups.
B) ANOVA is a procedure for comparing different categories for several groups.
C) The ANOVA procedure will reveal whether the means of several groups are different and which group or groups have a different mean.
D) None of these
Unlock Deck
Unlock for access to all 60 flashcards in this deck.
Unlock Deck
k this deck
37
Identify the test statistic used for the ANOVA procedure and how it is calculated.
A) The test statistic is z and is the ratio of the mean within a group to the variation between groups.
B) The test statistic is z and is calculated by finding the mean z-score between groups.
C) The test statistic is F and is the ratio of the variation between groups to the variation within groups.
D) The test statistic is F and is calculated by finding the difference between group means.
Unlock Deck
Unlock for access to all 60 flashcards in this deck.
Unlock Deck
k this deck
38
Use the following information for the question. A group of home gardeners want to test whether the type of soil used to grow
heirloom tomatoes has an effect on the number of tomatoes harvested. Gardeners randomly assigned tomato plants to be
grown in soil with no fertilizer, commercial plant food, and homemade compost. All other growing conditions were kept the
same. Forty plants were assigned to each group. At the end of the growing season the number of tomatoes harvested was
counted. Assume that all other conditions for the ANOVA test have been met.
State the null and alternative hypothesis.
Unlock Deck
Unlock for access to all 60 flashcards in this deck.
Unlock Deck
k this deck
39
Choose the appropriate test for the following situation: You wish to test whether the mean number of words recalled from short term memory is different for males and females.
A) Two-sample t-test
B) Chi-square test
C) One-sample t-test
D) ANOVA
A) Two-sample t-test
B) Chi-square test
C) One-sample t-test
D) ANOVA
Unlock Deck
Unlock for access to all 60 flashcards in this deck.
Unlock Deck
k this deck
40
Suppose a researcher collected data to compare whether dogs of different size categories differed in mean cost to a pet owner. Dogs were categorized as small, medium, or large. Cost was calculated as
The average annual amount spent on food, veterinary visits, and medications. The calculated
F-statistic was 421.58. Given this test statistic, which of the following is the most reasonable
Conclusion?
A) The F-statistic shows that variation within groups is larger than variation between groups, therefore, the researcher will likely conclude that there is not an association between dog size
And mean cost to the pet owner.
B) The F-statistic shows that large dogs have a significantly higher cost to the pet own than the other categories, therefore, the researcher will conclude that there is an association between
Dog size and mean cost to the pet owner.
C) The F-statistic shows that variation between groups is larger than variation within groups, therefore, the researcher will likely conclude that there is an association between dog size and
Mean cost to the pet owner.
D) None of these
Unlock Deck
Unlock for access to all 60 flashcards in this deck.
Unlock Deck
k this deck
41
Suppose you have observations from six different school districts within your state and you wish to do hypothesis tests to compare the mean home value across groups. Using the Bonferroni Correction, what significance level should you use for each hypothesis test if you want an overall significance of 0.10?
Round to the nearest thousandth.
Round to the nearest thousandth.
Unlock Deck
Unlock for access to all 60 flashcards in this deck.
Unlock Deck
k this deck
42
Use the following information for the questions. A group of home gardeners want to test whether the type of soil used to grow carrots has an effect on the number of carrots harvested. Gardeners randomly assigned carrot plants to be grown in soil with no fertilizer, commercial plant food, and homemade compost. All other growing conditions were kept the same. Fifty plants were assigned to each group. At the end of the growing season the number of carrots harvested was counted. Use the output below to answer the question. Assume that all other conditions for the ANOVA test have been met.
-Using the test results provided, test the hypothesis that soil treatment affects the number of carrots harvested. Use a significance level of 5%. State the correct decision regarding the null hypothesis and write a sentence summarizing the conclusion.
-Using the test results provided, test the hypothesis that soil treatment affects the number of carrots harvested. Use a significance level of 5%. State the correct decision regarding the null hypothesis and write a sentence summarizing the conclusion.
Unlock Deck
Unlock for access to all 60 flashcards in this deck.
Unlock Deck
k this deck
43
Use the following information to answer the question. Researchers want to test whether the color of a cyclist's jersey has an effect on race finish times. Four jersey colors were used for the study--red, green, blue, and yellow. Thirty cyclists were randomly assigned to each group. Use the output below to answer the question. One-way ANOVA Variation between groups Variation within groups
-Do the ANOVA test results warrant a post-hoc procedure?
Explain why or why not.
-Do the ANOVA test results warrant a post-hoc procedure?
Explain why or why not.
Unlock Deck
Unlock for access to all 60 flashcards in this deck.
Unlock Deck
k this deck
44
Describe two of the four conditions that must be checked in order for the calculated F-statistic to follow the F-distribution.
Unlock Deck
Unlock for access to all 60 flashcards in this deck.
Unlock Deck
k this deck
45
An ANOVA test was conducted to see whether running shoe sole type (Type A, Type B, or type C) had an effect on shoe wear over a six month period. Test results warranted post-hoc procedures. The Tukey HSD approach was used with the following results:
Is there evidence that one type of running shoe sole wears better than the others?
Which type of running shoe sole appears to wear the best?
Explain.
Is there evidence that one type of running shoe sole wears better than the others?
Which type of running shoe sole appears to wear the best?
Explain.
Unlock Deck
Unlock for access to all 60 flashcards in this deck.
Unlock Deck
k this deck
46
Use the following information for the questions. A group of home gardeners want to test whether the type of soil used to grow carrots has an effect on the number of carrots harvested. Gardeners randomly assigned carrot plants to be grown in soil with no fertilizer, commercial plant food, and homemade compost. All other growing conditions were kept the same. Fifty plants were assigned to each group. At the end of the growing season the number of carrots harvested was counted. Use the output below to answer the question. Assume that all other conditions for the ANOVA test have been met.
-State the null and alternative hypothesis.
-State the null and alternative hypothesis.
Unlock Deck
Unlock for access to all 60 flashcards in this deck.
Unlock Deck
k this deck
47
Use the following information to answer the question. Researchers want to test whether the color of a cyclist's jersey has an effect on race finish times. Four jersey colors were used for the study--red, green, blue, and yellow. Thirty cyclists were randomly assigned to each group. Use the output below to answer the question. One-way ANOVA Variation between groups Variation within groups
-Assume that all ANOVA test conditions have been satisfied. State the correct decision regarding the null hypothesis for the claim that jersey color affects race finish times. Write a sentence summarizing your conclusion.
-Assume that all ANOVA test conditions have been satisfied. State the correct decision regarding the null hypothesis for the claim that jersey color affects race finish times. Write a sentence summarizing your conclusion.
Unlock Deck
Unlock for access to all 60 flashcards in this deck.
Unlock Deck
k this deck
48
Suppose you have observations from six different school districts within your state and you wish to do hypothesis tests to compare the mean home value across school districts. How many comparisons can be done with six groups?
Unlock Deck
Unlock for access to all 60 flashcards in this deck.
Unlock Deck
k this deck
49
Use the following information for the questions. A group of home gardeners want to test whether the type of soil used to grow carrots has an effect on the number of carrots harvested. Gardeners randomly assigned carrot plants to be grown in soil with no fertilizer, commercial plant food, and homemade compost. All other growing conditions were kept the same. Fifty plants were assigned to each group. At the end of the growing season the number of carrots harvested was counted. Use the output below to answer the question. Assume that all other conditions for the ANOVA test have been met.
-Interpret the boxplots given. Compare medians, interquartile ranges, and shapes, and mention any potential outliers.
-Interpret the boxplots given. Compare medians, interquartile ranges, and shapes, and mention any potential outliers.
Unlock Deck
Unlock for access to all 60 flashcards in this deck.
Unlock Deck
k this deck
50
The figure below shows the F-distribution with 5 and 10 degrees of freedom to test the hypothesis that age groups and reading speed are associated. The shaded area represents the p-value. Assume that all conditions for ANOVA have been met. Should the null hypothesis that the age group population means are equal be rejected?
What conclusion can be drawn about the association between age group and reading speed?
What conclusion can be drawn about the association between age group and reading speed?
Unlock Deck
Unlock for access to all 60 flashcards in this deck.
Unlock Deck
k this deck
51
What is the test statistic used for the ANOVA procedure?
Explain how it is calculated.
Explain how it is calculated.
Unlock Deck
Unlock for access to all 60 flashcards in this deck.
Unlock Deck
k this deck
52
In the context of the ANOVA test, do the phrases "variation due to treatment", "explained variation", and "variation due to factors", describe variation within groups or variation between groups?
Unlock Deck
Unlock for access to all 60 flashcards in this deck.
Unlock Deck
k this deck
53
Use the following information to answer the question. Researchers want to test whether the color of a cyclist's jersey has an effect on race finish times. Four jersey colors were used for the study--red, green, blue, and yellow. Thirty cyclists were randomly assigned to each group. Use the output below to answer the question. One-way ANOVA Variation between groups Variation within groups
-Compute the F-statistic. Show your work. Round to the nearest hundredth.
-Compute the F-statistic. Show your work. Round to the nearest hundredth.
Unlock Deck
Unlock for access to all 60 flashcards in this deck.
Unlock Deck
k this deck
54
Choose the appropriate test for the following situation:
You wish to test whether an association exists between type of vehicle transmission purchased--automatic or manual--and gender of the purchaser.
You wish to test whether an association exists between type of vehicle transmission purchased--automatic or manual--and gender of the purchaser.
Unlock Deck
Unlock for access to all 60 flashcards in this deck.
Unlock Deck
k this deck
55
Choose the appropriate test for the following situation:
Suppose that researchers wish to study whether dieting affects alertness levels. Three popular dieting plans were included in the study. After following the diet for several weeks, participants were given a test that measured response time to a stimulus.
Suppose that researchers wish to study whether dieting affects alertness levels. Three popular dieting plans were included in the study. After following the diet for several weeks, participants were given a test that measured response time to a stimulus.
Unlock Deck
Unlock for access to all 60 flashcards in this deck.
Unlock Deck
k this deck
56
A television studio did a poll to determine whether women in different age groups watched different amounts of comedy programming. Check the TI-84 output to see whether the same-variance condition for ANOVA holds. Show your work. Is ANOVA appropriate?
Unlock Deck
Unlock for access to all 60 flashcards in this deck.
Unlock Deck
k this deck
57
Use the following information for the question. Researchers conducted a study that examined marital status and work hours. A hypothesis test was conducted to test the claim that people with different marital statuses have a different mean number of work hours. Participants were categorized as married, single, or divorced. Assume that all conditions for the ANOVA test have been met. The TI-84 output for the test is shown below.
-What is the value of the test statistic?
Round to the nearest hundredth if necessary.
-What is the value of the test statistic?
Round to the nearest hundredth if necessary.
Unlock Deck
Unlock for access to all 60 flashcards in this deck.
Unlock Deck
k this deck
58
Use the following information for the question. Researchers conducted a study that examined marital status and work hours. A hypothesis test was conducted to test the claim that people with different marital statuses have a different mean number of work hours. Participants were categorized as married, single, or divorced. Assume that all conditions for the ANOVA test have been met. The TI-84 output for the test is shown below.
-State the null and alternative hypothesis.
-State the null and alternative hypothesis.
Unlock Deck
Unlock for access to all 60 flashcards in this deck.
Unlock Deck
k this deck
59
What is the meaning the overall significance level of a test?
Explain what happens to the overall significance level when multiple comparisons are made, that is, when multiple hypothesis tests are conducted in an effort to compare the means of several groups.
Explain what happens to the overall significance level when multiple comparisons are made, that is, when multiple hypothesis tests are conducted in an effort to compare the means of several groups.
Unlock Deck
Unlock for access to all 60 flashcards in this deck.
Unlock Deck
k this deck
60
Suppose a researcher collected data to compare whether cats of different size categories differed in mean number of hours slept per day. Cats were categorized as small, medium, or large. The calculated F-statistic was 220.41. Given this test statistic, can we conclude that there is more variation between groups or within groups?
Based on the test statistic, is it likely that an association exists between cat size and mean number of hours that a cat sleeps per day?
Explain.
Based on the test statistic, is it likely that an association exists between cat size and mean number of hours that a cat sleeps per day?
Explain.
Unlock Deck
Unlock for access to all 60 flashcards in this deck.
Unlock Deck
k this deck
Unlock Deck
Unlock for access to all 60 flashcards in this deck.


