Deck 1: Exploring and Understanding Data
Full screen (f)
Question
Question
The standard deviation of the data displayed in this dotplot is most likely to be … 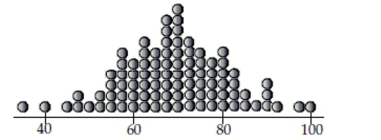
A) 8.
B) 5.
C) 20.
D) 12.
E) 18.
A) 8.
B) 5.
C) 20.
D) 12.
E) 18.
Question
Question
Suppose that a Normal model describes fuel economy (miles per gallon) for automobiles and that a
Saturn has a standardized score (z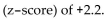
2) This means that Saturns . . .
A) get 2.2 mpg more than the average car.
B) achieve fuel economy that is 2.2 standard deviations better than the average car.
C) get 2.2 times the gas mileage of the average car.
D) get 2.2 miles per gallon.
E) have a standard deviation of 2.2 mpg.
Question
Question
Question
Question
Question
Which is true of the data shown in the histogram? 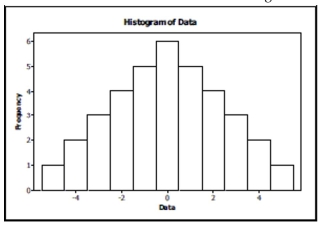 I. The distribution is approximately symmetric.
II) The mean and median are approximately equal.
III) The median and IQR summarize the data better than the mean and standard deviation.
A) I and II
B) I, II, and III
C) I only
D) III only
E) I and III
I. The distribution is approximately symmetric.II) The mean and median are approximately equal.
III) The median and IQR summarize the data better than the mean and standard deviation.
A) I and II
B) I, II, and III
C) I only
D) III only
E) I and III
Question
Question
Question
The average scores for Wisconsin schools on the ACT are summarized in the ogive shown. Estimate
The IQR of the average scores.
A) 7
B) 50
C) 2.8
D) 6
E) 1.6
The IQR of the average scores.
A) 7
B) 50
C) 2.8
D) 6
E) 1.6
Question
The veterinary bills for the dogs are summarized in the ogive shown. Estimate the IQR of these
Expenses.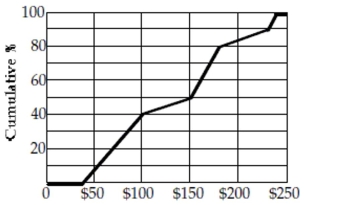
A) $75
B) $50
C) $100
D) $150
E) $200
Expenses.
A) $75
B) $50
C) $100
D) $150
E) $200
Question
Question
Question
Question
Question
Question
The standard deviation of the data displayed in this dotplot is closest to… 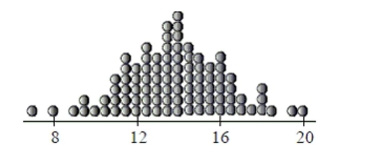
A) 2.
B) 4.
C) 1.
D) 3.5.
E) 0.5.
A) 2.
B) 4.
C) 1.
D) 3.5.
E) 0.5.
Question
Question
Question
Question
Question
Which is true of the data shown in the histogram? 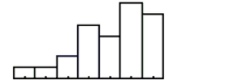 I. The distribution is skewed to the right.
II) The mean is probably smaller than the median.
III) We should use median and IQR to summarize these data.
A) I, II, and III
B) II only
C) I only
D) III only
E) II and III
I. The distribution is skewed to the right.II) The mean is probably smaller than the median.
III) We should use median and IQR to summarize these data.
A) I, II, and III
B) II only
C) I only
D) III only
E) II and III
Question
The best estimate of the standard deviation of the mens' weights displayed in this dotplot is 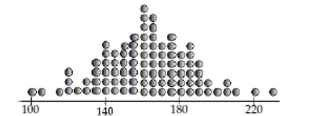
A) 10
B) 40
C) 15
D) 25
E) 35
A) 10
B) 40
C) 15
D) 25
E) 35
Question
Question
The five-number summary of credit hours for 24 students in a statistics class is: 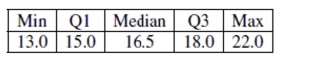 Which statement is true?
A) There is at least one high outlier in the data.
B) There are no outliers in the data.
C) none of these
D) There is at least one low outlier in the data.
E) There are both low and high outliers in the data.
Which statement is true?A) There is at least one high outlier in the data.
B) There are no outliers in the data.
C) none of these
D) There is at least one low outlier in the data.
E) There are both low and high outliers in the data.
Question
Question
Question
Question
Question
Question
Question
Question
The ages of people attending the opening show of a new movie are summarized in the ogive
Shown. Estimate the IQR of the ages.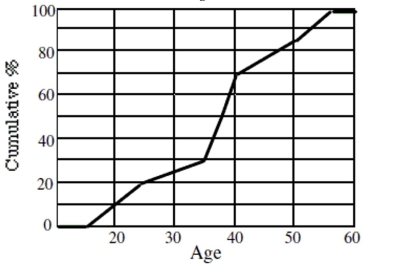
A) 13
B) 5
C) 37
D) 30
E) 21
Shown. Estimate the IQR of the ages.
A) 13
B) 5
C) 37
D) 30
E) 21
Question
Question
The distribution below is the number of family members reported by 25 people in the 2010 Census.
The best description for the shape of this distribution is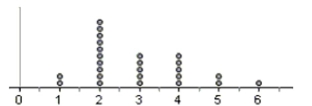
A) approximately normal
B) normal
C) bimodal
D) skewed right
E) skewed left
The best description for the shape of this distribution is
A) approximately normal
B) normal
C) bimodal
D) skewed right
E) skewed left
Question
Which is true of the data whose distribution is shown?
I) The distribution is skewed to the right.
II) The mean is probably smaller than the median.
III) We should summarize with median and IQR.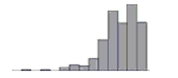
A) I only
B) I and II
C) II only
D) II and III
E) I, II, and III
I) The distribution is skewed to the right.
II) The mean is probably smaller than the median.
III) We should summarize with median and IQR.
A) I only
B) I and II
C) II only
D) II and III
E) I, II, and III
Question
Question
Question
Question
The boxplots show the age of people involved in accidents according to their role in
the accident.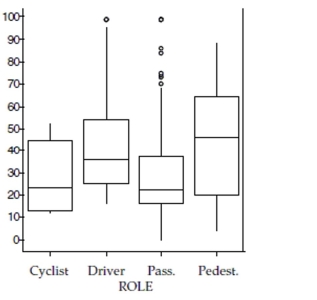
a. Which role involved the youngest person, and what is the age?
b. Which role had the lowest median age, and what is the age?
c. Which role had smallest range of ages, and what is it?
d. Which role had the largest IQR of ages, and what is it?
e. Which role generally involves the oldest people? Explain.
Question
Question
The five-number summary for the fuel economy (in miles per gallon) of year 2011 midsize
cars is: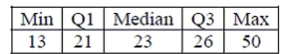
a. Would you expect the mean gas mileage of all midsize cars to be higher or lower than
the median? Explain.
b. One model of Volkswagon gets 34 mpg, one model of Toyota gets 28 mpg, and one
model of Bentley gets 13 mpg. Are any of these cars outliers (according to the original
statistics above)? Explain.
Question
Question
To determine if people's preference in dogs had changed in the recent years, organizers of a local dog show asked people
who attended the show to indicate which breed was their favorite. This information was compiled by dog breed and gender
of the people who responded. The table summarizes the responses.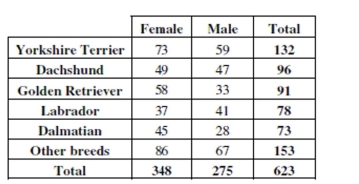
Find each percent.
a. What percent of the responses were from males who favor Labradors?
b. What percent of the male responses favor Labradors?
c. What percent of the people who choose Labradors were males?
Question
Health insurance The World Almanac and Book of Facts 2004 reported the percent of people
not covered by health insurance in the 50 states and Washington, D.C., for the year 2002.
Computer output gives these summaries for the percent of people not covered by health
insurance:
Is it more appropriate to use the mean and standard deviation or the median and IQR to
describe these data? Explain.
Question
Question
Has the percentage of young girls drinking milk changed over time? The following table is consistent with the results from
"Beverage Choices of Young Females: Changes and Impact on Nutrient Intakes" (Shanthy A. Bowman, Journal of the American
Dietetic Association, 102(9), pp. 1234-1239):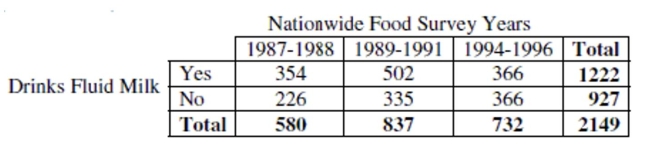
Consider the following pie charts of the a subset of the data above: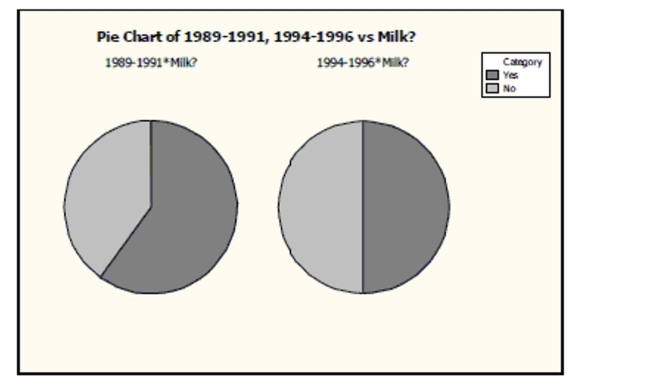
Do the pie charts above indicate that milk consumption by young girls is independent of
the nationwide survey year? Explain.
Question
Copy machines A manufacturer claims that lifespans for their copy machines (in months)
can be described by a Normal model N(42,7). Show your work.
a. Draw and clearly label the model.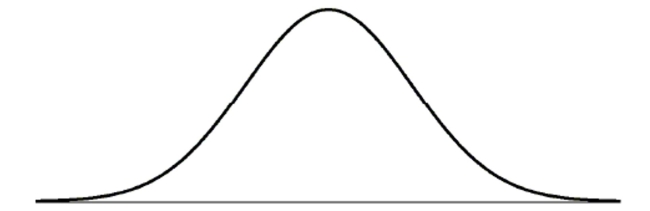
b. A company with a several large office buildings buys 200 of these copiers. The salesman
tells the boss "190 (95%) of your new copiers will last between _____ and _____ months."
Comment on this claim.
c. What is the 3rd quartile of copier lifespans?
d. What percent of the copiers are expected to fail before 36 months?
mean lifespan will stay the same, what standard deviation must they achieve?
f. Briefly explain what that change in standard deviation means in this context.
g. A competing manufacturer says that not only will 90% of their copiers last at least 36
months, 65% will last at least 42 months. What Normal model parameters is that
manufacturer claiming? Show your work.
Question
A research company frequently monitors trends in the use of social media by American Adults. The results of one survey of
1846 randomly selected adults looked at social media use versus age group. The table summarizes the survey results.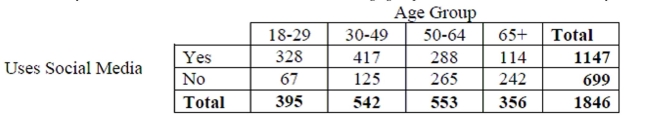
Write a sentence or two about the conditional relative frequency distribution of ages of
social media users.
1846 randomly selected adults looked at social media use versus age group. The table summarizes the survey results.
Write a sentence or two about the conditional relative frequency distribution of ages of
social media users.
Question
To determine if people's preference in dogs had changed in the recent years, organizers of a local dog show asked people
who attended the show to indicate which breed was their favorite. This information was compiled by dog breed and gender
of the people who responded. The table summarizes the responses.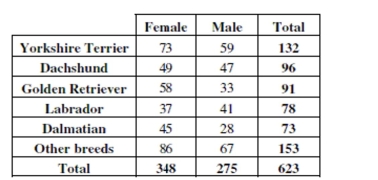
Identify the variables and tell whether each is categorical or quantitative.
who attended the show to indicate which breed was their favorite. This information was compiled by dog breed and gender
of the people who responded. The table summarizes the responses.
Identify the variables and tell whether each is categorical or quantitative.
Question
A research company frequently monitors trends in the use of social media by American Adults. The results of one survey of
1846 randomly selected adults looked at social media use versus age group. The table summarizes the survey results.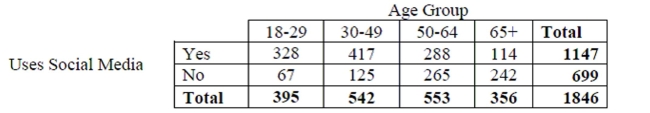
Identify the variables and tell whether each is categorical or quantitative.
1846 randomly selected adults looked at social media use versus age group. The table summarizes the survey results.
Identify the variables and tell whether each is categorical or quantitative.
Question
Question
Question
A survey conducted in a college intro stats class asked students about the number of credit hours they were taking that
quarter. The number of credit hours for a random sample of 16 students is given in the table.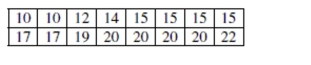
a. Sketch a histogram of these data
b. Find the mean and standard deviation for the number of credit hours.
c. Find the median and IQR for the number of credit hours.
d. Is it more appropriate to use the mean and standard deviation or the median and IQR to
summarize theses data? Explain.
Question
Question
A research company frequently monitors trends in the use of social media by American Adults. The results of one survey of
1846 randomly selected adults looked at social media use versus age group. The table summarizes the survey results.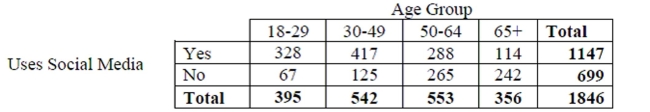
Do you think social media use is independent of age? Give statistical evidence to support
your conclusion.
1846 randomly selected adults looked at social media use versus age group. The table summarizes the survey results.
Do you think social media use is independent of age? Give statistical evidence to support
your conclusion.
Question
One thousand students from a local university were sampled to gather information such as
gender, high school GPA, college GPA, and total SAT scores. The results were used to
create histograms displaying high school grade point averages (GPAs) for both males and
females. Compare the grade distribution of males and females.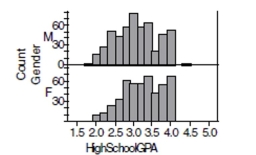
gender, high school GPA, college GPA, and total SAT scores. The results were used to
create histograms displaying high school grade point averages (GPAs) for both males and
females. Compare the grade distribution of males and females.
Question
The boxplots show prices of used cars (in thousands of dollars) advertised for sale at three
different car dealers.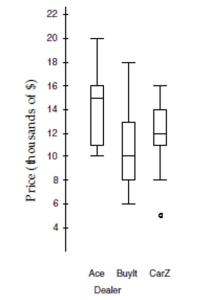
a. Which dealer offers the cheapest car offered, and at what price?
b. Which dealer has the lowest median price, and how much is it?
c. Which dealer has the smallest price range, and what is it?
d. Which dealer's prices have the smallest IQR, and what is it?
e. Which dealer generally sells cars cheapest? Explain.
Question
A research company frequently monitors trends in the use of social media by American Adults. The results of one survey of
1846 randomly selected adults looked at social media use versus age group. The table summarizes the survey results.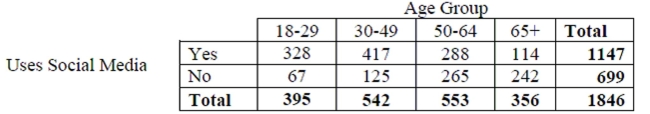
Find each percent.
a) What percent of adults surveyed are social media users aged 30-49?
b) What percent of the social media users are aged 30-49?
c) What percent of adults aged 30-49 are social media users?
Question
Question
Commuting to work The table shows how a company's employees commute to work. 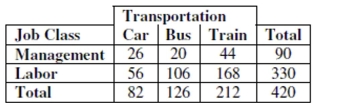
a. What is the marginal distribution (in %) of mode of transportation (Car, Bus, Train)?
b. What is the conditional distribution (in %) of mode of transportation (Car, Bus, Train) for
management?
c. What kind of display would you use to show the association between job class and mode
of transportation? (Just name a graph.)
d. Do job classification and mode of transportation appear to be independent? Give
statistical evidence to support your conclusion.
Question
Soft drinks A restaurant owner wanted to improve the efficiency of his employees. One
way he tried to do this was to buy a machine that will automatically dispense 16 oz. of
soda into a glass rather than have the employee hold the button on the dispenser. The
actual amount dispensed by the machine can be represented by the model N(16.2, 0.3)
a. Draw and clearly label the model.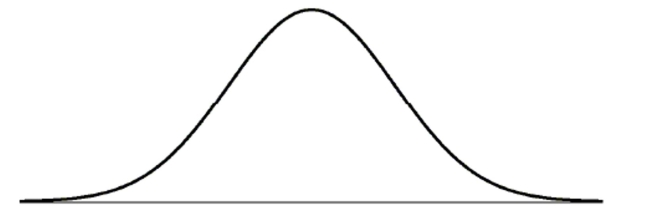
b. The sales representative who sold him the machine said, "95% of the glasses you fill
with soda will fall between _________ and _________." Fill in the blanks based on the
normal model, then comment on this claim.
c. What is the 3rd quartile of amounts dispensed?
d. If a glass will actually hold 16.7 oz. of soda, what percent of the time would you expect
the glass to overflow?
e. The manufacturer wants to reduce the overflow rate to only 1%. Assuming the mean
amount dispensed will stay the same, what standard deviation must they achieve?
f. Briefly explain what that change in standard deviation means in this context.
g. A competing manufacturer says that not only will 98% of their glasses be safe from
overflowing, but 70% will have more than 16 oz., reducing customer complaints. What
Normal model parameters is that manufacturer claiming? Show your work.
Question
Question
Owners of a minor league baseball team believe that a Normal model is useful in
projecting the number of fans who will attend home games. They use a mean of 8500 fans
and a standard deviation of 1500 fans. Draw and clearly label this model.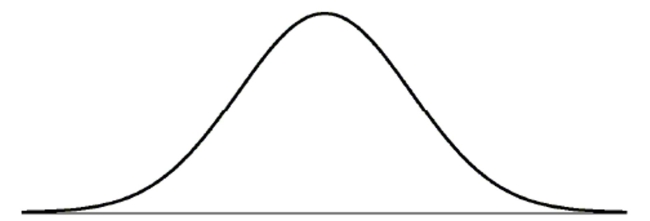
projecting the number of fans who will attend home games. They use a mean of 8500 fans
and a standard deviation of 1500 fans. Draw and clearly label this model.
Question
In order to plan transportation and parking needs at a private high school, administrators asked students how they get to
school. Some rode a school bus, some rode in with parents or friends, and others used "personal" transportation - bikes,
skateboards, or just walked. The table summarizes the responses from boys and girls.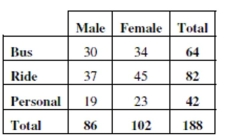
Write a sentence or two about the conditional relative frequency distribution of modes of
transportation for the boys.
Question
Question
Cellphones ConsumerReports.org evaluated the price and performance of 99 models of
cellphones. Computer output gives these summaries for the prices:
a. Were any of the prices outliers? Explain how you made your decision.
b. One of the manufacturers advertises a cellphone "economy-priced at only $31.95".
Would you consider that to be a very low price? Explain.
cellphones. Computer output gives these summaries for the prices:
a. Were any of the prices outliers? Explain how you made your decision.
b. One of the manufacturers advertises a cellphone "economy-priced at only $31.95".
Would you consider that to be a very low price? Explain.
Question
There are 18 roller coasters in Virginia for which the lengths (in feet) were reported. Those lengths are listed in the table. 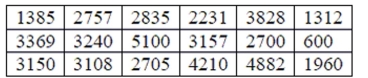
a. Sketch a histogram for these data.
b. Find the mean and standard deviation of the roller coaster lengths.
c. Is it appropriate to use the mean and standard deviation to summarize these data?
Explain.
d. Describe the distribution of roller coaster lengths.
a. Sketch a histogram for these data.
b. Find the mean and standard deviation of the roller coaster lengths.
c. Is it appropriate to use the mean and standard deviation to summarize these data?
Explain.
d. Describe the distribution of roller coaster lengths.
Question
To determine if people's preference in dogs had changed in the recent years, organizers of a local dog show asked people
who attended the show to indicate which breed was their favorite. This information was compiled by dog breed and gender
of the people who responded. The table summarizes the responses.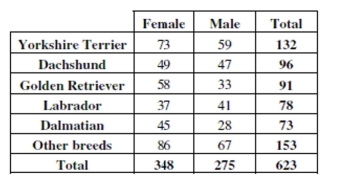
What is the marginal distribution of breeds?
who attended the show to indicate which breed was their favorite. This information was compiled by dog breed and gender
of the people who responded. The table summarizes the responses.
What is the marginal distribution of breeds?
Question
Consider the following part of a data set: 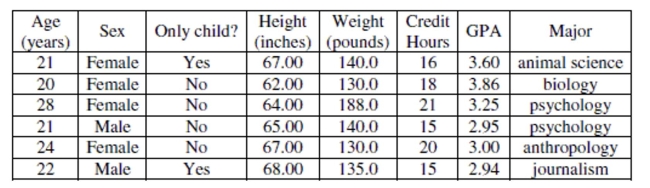
List the variables in the data set. Indicate whether each variable is treated as categorical or
quantitative in this data set. If the variable is quantitative, state the units.
List the variables in the data set. Indicate whether each variable is treated as categorical or
quantitative in this data set. If the variable is quantitative, state the units.
Question
Question
Question
Veterinary costs Costs for standard veterinary services at a local animal hospital follow a
Normal model with a mean of $80 and a standard deviation of $20.
a. Draw and clearly label this model.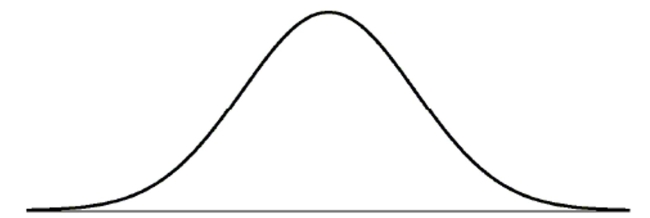
b. Is it unusual to have a veterinary bill for $125? Explain.
c. What is the IQR for the costs of standard veterinary services? Show your work
Normal model with a mean of $80 and a standard deviation of $20.
a. Draw and clearly label this model.
b. Is it unusual to have a veterinary bill for $125? Explain.
c. What is the IQR for the costs of standard veterinary services? Show your work
Question
To determine if people's preference in dogs had changed in the recent years, organizers of a local dog show asked people
who attended the show to indicate which breed was their favorite. This information was compiled by dog breed and gender
of the people who responded. The table summarizes the responses.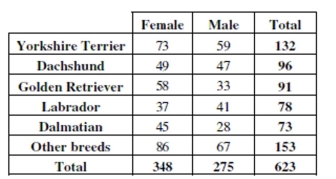
Do you think the breed selection is independent of gender? Give statistical evidence to
support your conclusion.
who attended the show to indicate which breed was their favorite. This information was compiled by dog breed and gender
of the people who responded. The table summarizes the responses.
Do you think the breed selection is independent of gender? Give statistical evidence to
support your conclusion.
Question
In order to plan transportation and parking needs at a private high school, administrators asked students how they get to
school. Some rode a school bus, some rode in with parents or friends, and others used "personal" transportation
skateboards, or just walked. The table summarizes the responses from boys and girls.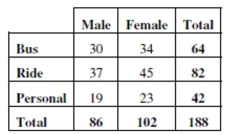
Identify the variables and tell whether each is categorical or quantitative.
school. Some rode a school bus, some rode in with parents or friends, and others used "personal" transportation
skateboards, or just walked. The table summarizes the responses from boys and girls.
Identify the variables and tell whether each is categorical or quantitative.
Question
Question
During a budget meeting, local school board members decided to review class size
information to determine if budgets were correct. Summary statistics are shown in the
table.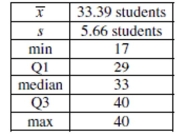
a. Notice that the third quartile and maximum class sizes are the same. Explain how this
can be.
b. The school district declares that classes with enrollments fewer than 20 students are "too
small". Would you consider a class of 20 students to be unusually small? Explain.
c. The school district sets the office supply budgets of their high schools on the enrollment
of students. The district budgets each class $12 plus $0.75 per student, so a class with one
student receives $12.75 and the classes with 40 students receive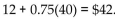
What is
the median class budget for office supplies? And the IQR?
d. What are the mean and standard deviation of the class office supply budgets?
Question
In order to plan transportation and parking needs at a private high school, administrators asked students how they get to
school. Some rode a school bus, some rode in with parents or friends, and others used "personal" transportation - bikes,
skateboards, or just walked. The table summarizes the responses from boys and girls.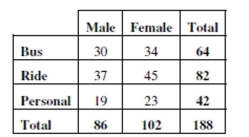
Find each percent.
a) What percent of the students are girls who ride the bus?
b) What percent of the girls ride the bus?
c) What percent of the bus riders are girls?

Unlock Deck
Sign up to unlock the cards in this deck!
Unlock Deck
Unlock Deck
1/125
Play
Full screen (f)
Deck 1: Exploring and Understanding Data
1
Which of the following variables would most likely follow a Normal model?
A) family income
B) scores on an easy test
C) heights of singers in a co-ed choir
D) all of these
E) weights of adult male elephants
A) family income
B) scores on an easy test
C) heights of singers in a co-ed choir
D) all of these
E) weights of adult male elephants
E
2
The standard deviation of the data displayed in this dotplot is most likely to be …
A) 8.
B) 5.
C) 20.
D) 12.
E) 18.
A) 8.
B) 5.
C) 20.
D) 12.
E) 18.
D
3
Which of these variables about German Shepherds is most likely to be described by a Normal
Model?
A) number of days housed
B) age
C) weight
D) breed
E) veterinary costs
Model?
A) number of days housed
B) age
C) weight
D) breed
E) veterinary costs
C
4
Suppose that a Normal model describes fuel economy (miles per gallon) for automobiles and that a
Saturn has a standardized score (z
2) This means that Saturns . . .
A) get 2.2 mpg more than the average car.
B) achieve fuel economy that is 2.2 standard deviations better than the average car.
C) get 2.2 times the gas mileage of the average car.
D) get 2.2 miles per gallon.
E) have a standard deviation of 2.2 mpg.
Saturn has a standardized score (z
2) This means that Saturns . . .
A) get 2.2 mpg more than the average car.
B) achieve fuel economy that is 2.2 standard deviations better than the average car.
C) get 2.2 times the gas mileage of the average car.
D) get 2.2 miles per gallon.
E) have a standard deviation of 2.2 mpg.
Unlock Deck
Unlock for access to all 125 flashcards in this deck.
Unlock Deck
k this deck
5
Which of these variables is most likely to follow a Normal model?
A) number of TV sets at home
B) hours of homework last week
C) number of cigarettes smoked daily
D) eye color
E) head circumference
A) number of TV sets at home
B) hours of homework last week
C) number of cigarettes smoked daily
D) eye color
E) head circumference
Unlock Deck
Unlock for access to all 125 flashcards in this deck.
Unlock Deck
k this deck
6
Your Stats teacher tells you your test score was the 3rd quartile for the class. Which is true?
I) You got 75% on the test.
II) You can't really tell what this means without knowing the standard deviation.
III) You can't really tell what this means unless the class distribution is nearly Normal.
A) II only
B) I only
C) III only
D) none of these
E) II and III
I) You got 75% on the test.
II) You can't really tell what this means without knowing the standard deviation.
III) You can't really tell what this means unless the class distribution is nearly Normal.
A) II only
B) I only
C) III only
D) none of these
E) II and III
Unlock Deck
Unlock for access to all 125 flashcards in this deck.
Unlock Deck
k this deck
7
Which of these variables is most likely to be bimodal?
A) number of cigarettes smoked daily
B) head circumference
C) number of TV sets at home
D) hours of homework last week
E) eye color
A) number of cigarettes smoked daily
B) head circumference
C) number of TV sets at home
D) hours of homework last week
E) eye color
Unlock Deck
Unlock for access to all 125 flashcards in this deck.
Unlock Deck
k this deck
8
The United States Census collects data on many variables about individuals and households.
Which variable is categorical?
A) hours worked per week
B) annual electricity cost
C) family size
D) type of residence
E) monthly mortgage
Which variable is categorical?
A) hours worked per week
B) annual electricity cost
C) family size
D) type of residence
E) monthly mortgage
Unlock Deck
Unlock for access to all 125 flashcards in this deck.
Unlock Deck
k this deck
9
Which is true of the data shown in the histogram? I. The distribution is approximately symmetric.
II) The mean and median are approximately equal.
III) The median and IQR summarize the data better than the mean and standard deviation.
A) I and II
B) I, II, and III
C) I only
D) III only
E) I and III
I. The distribution is approximately symmetric.II) The mean and median are approximately equal.
III) The median and IQR summarize the data better than the mean and standard deviation.
A) I and II
B) I, II, and III
C) I only
D) III only
E) I and III
Unlock Deck
Unlock for access to all 125 flashcards in this deck.
Unlock Deck
k this deck
10
The mean number of hours worked for the 30 males was 6, and for the 20 females was 9. The
Overall mean number of hours worked …
A) is 7.2
B) is none of these.
C) cannot be determined.
D) is 7.5
E) is 6.5
Overall mean number of hours worked …
A) is 7.2
B) is none of these.
C) cannot be determined.
D) is 7.5
E) is 6.5
Unlock Deck
Unlock for access to all 125 flashcards in this deck.
Unlock Deck
k this deck
11
School administrators collect data on students attending the school. Which of the following
Variables is quantitative?
A) none of these
B) whether the student is in AP* classes
C) whether the student has taken the SAT
D) class (freshman, soph., junior, senior)
E) grade point average
Variables is quantitative?
A) none of these
B) whether the student is in AP* classes
C) whether the student has taken the SAT
D) class (freshman, soph., junior, senior)
E) grade point average
Unlock Deck
Unlock for access to all 125 flashcards in this deck.
Unlock Deck
k this deck
12
The average scores for Wisconsin schools on the ACT are summarized in the ogive shown. Estimate
The IQR of the average scores.
A) 7
B) 50
C) 2.8
D) 6
E) 1.6
The IQR of the average scores.
A) 7
B) 50
C) 2.8
D) 6
E) 1.6
Unlock Deck
Unlock for access to all 125 flashcards in this deck.
Unlock Deck
k this deck
13
The veterinary bills for the dogs are summarized in the ogive shown. Estimate the IQR of these
Expenses.
A) $75
B) $50
C) $100
D) $150
E) $200
Expenses.
A) $75
B) $50
C) $100
D) $150
E) $200
Unlock Deck
Unlock for access to all 125 flashcards in this deck.
Unlock Deck
k this deck
14
Environmental researchers have collected rain acidity data for several decades. They want to see if
There is any evidence that attempts to reduce industrial pollution have produced a trend toward
Less acidic rainfall. They should display their data in a(n)…
A) timeplot
B) contingency table
C) histogram
D) bar graph
E) boxplot
There is any evidence that attempts to reduce industrial pollution have produced a trend toward
Less acidic rainfall. They should display their data in a(n)…
A) timeplot
B) contingency table
C) histogram
D) bar graph
E) boxplot
Unlock Deck
Unlock for access to all 125 flashcards in this deck.
Unlock Deck
k this deck
15
A professor has kept records on grades that students have earned in his class. If he wants to
Examine the percentage of students earning the grades A, B, C, D, and F during the most recent
Term, which kind of plot could he make?
A) boxplot
B) timeplot
C) pie chart
D) dotplot
E) histogram
Examine the percentage of students earning the grades A, B, C, D, and F during the most recent
Term, which kind of plot could he make?
A) boxplot
B) timeplot
C) pie chart
D) dotplot
E) histogram
Unlock Deck
Unlock for access to all 125 flashcards in this deck.
Unlock Deck
k this deck
16
Which type of plot would be most appropriate to display the responses to type of residence?
A) pie chart
B) boxplot
C) histogram
D) timeplot
E) dotplot
A) pie chart
B) boxplot
C) histogram
D) timeplot
E) dotplot
Unlock Deck
Unlock for access to all 125 flashcards in this deck.
Unlock Deck
k this deck
17
Which type of plot would be least likely to reveal that a distribution is bimodal?
A) histogram
B) dotplot
C) ogive
D) boxplot
E) stemplot
A) histogram
B) dotplot
C) ogive
D) boxplot
E) stemplot
Unlock Deck
Unlock for access to all 125 flashcards in this deck.
Unlock Deck
k this deck
18
Which of these variables is most likely to follow a Normal model for U.S. adults?
A) ACT scores
B) eye color
C) monthly mortgage
D) income
E) commuting time
A) ACT scores
B) eye color
C) monthly mortgage
D) income
E) commuting time
Unlock Deck
Unlock for access to all 125 flashcards in this deck.
Unlock Deck
k this deck
19
The standard deviation of the data displayed in this dotplot is closest to…
A) 2.
B) 4.
C) 1.
D) 3.5.
E) 0.5.
A) 2.
B) 4.
C) 1.
D) 3.5.
E) 0.5.
Unlock Deck
Unlock for access to all 125 flashcards in this deck.
Unlock Deck
k this deck
20
Which of the following summaries are changed by adding a constant to each data value?
I) the mean
II) the median
III) the standard deviation
A) I, II, and III
B) I and II
C) I only
D) I and III
E) III only
I) the mean
II) the median
III) the standard deviation
A) I, II, and III
B) I and II
C) I only
D) I and III
E) III only
Unlock Deck
Unlock for access to all 125 flashcards in this deck.
Unlock Deck
k this deck
21
The SPCA has kept these data records for the past 20 years. If they want to show the trend in the
Number of dogs they have housed, what kind of plot should they make?
A) pie chart
B) bar graph
C) boxplot
D) histogram
E) timeplot
Number of dogs they have housed, what kind of plot should they make?
A) pie chart
B) bar graph
C) boxplot
D) histogram
E) timeplot
Unlock Deck
Unlock for access to all 125 flashcards in this deck.
Unlock Deck
k this deck
22
Which is true of the data whose distribution is shown?
I) The distribution is skewed to the right.
II) The mean is probably smaller than the median.
III) We should summarize with mean and standard deviation.
A) II only
B) II and III
C) I, II, and III
D) I only
E) I and II
I) The distribution is skewed to the right.
II) The mean is probably smaller than the median.
III) We should summarize with mean and standard deviation.
A) II only
B) II and III
C) I, II, and III
D) I only
E) I and II
Unlock Deck
Unlock for access to all 125 flashcards in this deck.
Unlock Deck
k this deck
23
The SPCA collects the following data about the dogs they house. Which is categorical?
A) number of days housed
B) veterinary costs
C) breed
D) weight
E) age
A) number of days housed
B) veterinary costs
C) breed
D) weight
E) age
Unlock Deck
Unlock for access to all 125 flashcards in this deck.
Unlock Deck
k this deck
24
Which is true of the data shown in the histogram? I. The distribution is skewed to the right.
II) The mean is probably smaller than the median.
III) We should use median and IQR to summarize these data.
A) I, II, and III
B) II only
C) I only
D) III only
E) II and III
I. The distribution is skewed to the right.II) The mean is probably smaller than the median.
III) We should use median and IQR to summarize these data.
A) I, II, and III
B) II only
C) I only
D) III only
E) II and III
Unlock Deck
Unlock for access to all 125 flashcards in this deck.
Unlock Deck
k this deck
25
The best estimate of the standard deviation of the mens' weights displayed in this dotplot is
A) 10
B) 40
C) 15
D) 25
E) 35
A) 10
B) 40
C) 15
D) 25
E) 35
Unlock Deck
Unlock for access to all 125 flashcards in this deck.
Unlock Deck
k this deck
26
Last weekend police ticketed 18 men whose mean speed was 72 miles per hour, and 30 women
Going an average of 64 mph. Overall, what was the mean speed of all the people ticketed?
A) It cannot be determined.
B) none of these
C) 68 mph
D) 67 mph
E) 69 mph
Going an average of 64 mph. Overall, what was the mean speed of all the people ticketed?
A) It cannot be determined.
B) none of these
C) 68 mph
D) 67 mph
E) 69 mph
Unlock Deck
Unlock for access to all 125 flashcards in this deck.
Unlock Deck
k this deck
27
The five-number summary of credit hours for 24 students in a statistics class is: Which statement is true?
A) There is at least one high outlier in the data.
B) There are no outliers in the data.
C) none of these
D) There is at least one low outlier in the data.
E) There are both low and high outliers in the data.
Which statement is true?A) There is at least one high outlier in the data.
B) There are no outliers in the data.
C) none of these
D) There is at least one low outlier in the data.
E) There are both low and high outliers in the data.
Unlock Deck
Unlock for access to all 125 flashcards in this deck.
Unlock Deck
k this deck
28
Suppose that a Normal model described student scores in a history class. Parker has a standardized
Score (z-score) of +2.5. This means that Parker
A) none of these
B) has a score that is 2.5 times the average for the class.
C) has a standard deviation of 2.5.
D) is 2.5 point above average for the class.
E) is 2.5 standard deviations above average for the class.
Score (z-score) of +2.5. This means that Parker
A) none of these
B) has a score that is 2.5 times the average for the class.
C) has a standard deviation of 2.5.
D) is 2.5 point above average for the class.
E) is 2.5 standard deviations above average for the class.
Unlock Deck
Unlock for access to all 125 flashcards in this deck.
Unlock Deck
k this deck
29
Suppose that a Normal model describes the acidity (pH) of rainwater, and that water tested after
Last week's storm had a z-score of 1.8. This means that the acidity of that rain …
A) varied with a standard deviation of 1.8
B) had pH 1.8 times that of average rainwater.
C) had pH of 1.8.
D) had pH 1.8 standard deviations higher than that of average rainwater.
E) had pH 1.8 higher than avg, rainfall.
Unlock Deck
Unlock for access to all 125 flashcards in this deck.
Unlock Deck
k this deck
30
We might choose to display data with a stemplot rather than a boxplot because a stemplot
I) reveals the shape of the distribution.
II) is better for large data sets.
III) displays the actual data.
A) I and III
B) III only
C) II only
D) I only
E) I, II, and III
I) reveals the shape of the distribution.
II) is better for large data sets.
III) displays the actual data.
A) I and III
B) III only
C) II only
D) I only
E) I, II, and III
Unlock Deck
Unlock for access to all 125 flashcards in this deck.
Unlock Deck
k this deck
31
Suppose that a Normal model describes the acidity (pH) of rainwater, and that water tested after
Last week's storm had a z-score of 1.8. This means that the acidity of that rain …
A) varied with a standard deviation of 1.8.
B) had a pH 1.8 higher than average rainfall.
C) had a pH 1.8 standard deviations higher than that of average rainwater.
D) had a pH of 1.8.
E) had a pH 1.8 times that of average rainwater.
Unlock Deck
Unlock for access to all 125 flashcards in this deck.
Unlock Deck
k this deck
32
We collect these data from 50 male students. Which variable is categorical?
A) head circumference
B) hours of homework last week
C) eye color
D) number of cigarettes smoked daily
E) number of TV sets at home
A) head circumference
B) hours of homework last week
C) eye color
D) number of cigarettes smoked daily
E) number of TV sets at home
Unlock Deck
Unlock for access to all 125 flashcards in this deck.
Unlock Deck
k this deck
33
If we want to discuss any gaps and clusters in a data set, which of the following should not be
Chosen to display the data set?
A) dotplot
B) boxplot
C) histogram
D) Any of these would work.
E) stem-and-leaf plot
Chosen to display the data set?
A) dotplot
B) boxplot
C) histogram
D) Any of these would work.
E) stem-and-leaf plot
Unlock Deck
Unlock for access to all 125 flashcards in this deck.
Unlock Deck
k this deck
34
Two sections of a class took the same quiz. Section A had 15 students who had a mean score of 80,
And Section B had 20 students who had a mean score of 90. Overall, what was the approximate
Mean score for all of the students on the quiz?
A) 84.3
B) none of these
C) 85.0
D) It cannot be determined.
E) 85.7
And Section B had 20 students who had a mean score of 90. Overall, what was the approximate
Mean score for all of the students on the quiz?
A) 84.3
B) none of these
C) 85.0
D) It cannot be determined.
E) 85.7
Unlock Deck
Unlock for access to all 125 flashcards in this deck.
Unlock Deck
k this deck
35
The ages of people attending the opening show of a new movie are summarized in the ogive
Shown. Estimate the IQR of the ages.
A) 13
B) 5
C) 37
D) 30
E) 21
Shown. Estimate the IQR of the ages.
A) 13
B) 5
C) 37
D) 30
E) 21
Unlock Deck
Unlock for access to all 125 flashcards in this deck.
Unlock Deck
k this deck
36
Suppose a Normal model describes the number of pages printer ink cartridges last. If we keep track
Of printed pages for the 47 printers at a company's office, which must be true?
I) The page counts for those ink cartridges will be normally distributed.
II) The histogram for those page counts will be symmetric.
III) 95% of those page counts will be within 2 standard deviations of the mean.
A) II only
B) I only
C) I, II, and III
D) none of these
E) II and III
Unlock Deck
Unlock for access to all 125 flashcards in this deck.
Unlock Deck
k this deck
37
The distribution below is the number of family members reported by 25 people in the 2010 Census.
The best description for the shape of this distribution is
A) approximately normal
B) normal
C) bimodal
D) skewed right
E) skewed left
The best description for the shape of this distribution is
A) approximately normal
B) normal
C) bimodal
D) skewed right
E) skewed left
Unlock Deck
Unlock for access to all 125 flashcards in this deck.
Unlock Deck
k this deck
38
Which is true of the data whose distribution is shown?
I) The distribution is skewed to the right.
II) The mean is probably smaller than the median.
III) We should summarize with median and IQR.
A) I only
B) I and II
C) II only
D) II and III
E) I, II, and III
I) The distribution is skewed to the right.
II) The mean is probably smaller than the median.
III) We should summarize with median and IQR.
A) I only
B) I and II
C) II only
D) II and III
E) I, II, and III
Unlock Deck
Unlock for access to all 125 flashcards in this deck.
Unlock Deck
k this deck
39
The advantage of making a stem-and-leaf display instead of a dotplot is that a stem-and-leaf
Display
A) shows the shape of the distribution better than a dotplot.
B) satisfies the area principle.
C) preserves the individual data values.
D) none of these
E) is for quantitative data, while a dotplot shows categorical data.
Display
A) shows the shape of the distribution better than a dotplot.
B) satisfies the area principle.
C) preserves the individual data values.
D) none of these
E) is for quantitative data, while a dotplot shows categorical data.
Unlock Deck
Unlock for access to all 125 flashcards in this deck.
Unlock Deck
k this deck
40
To see if your school's ACT scores are improving since implementing a new program, the ACT
Scores for the past several years should be displayed in a
A) boxplot
B) contingency table
C) timeplot
D) bar graph
E) histogram
Scores for the past several years should be displayed in a
A) boxplot
B) contingency table
C) timeplot
D) bar graph
E) histogram
Unlock Deck
Unlock for access to all 125 flashcards in this deck.
Unlock Deck
k this deck
41
One of the reasons that the Monitoring the Future (MTF) project was started was "to study
changes in the beliefs, attitudes, and behavior of young people in the United States." Data
are collected from 8th, 10th, and 12th graders each year. To get a representative nationwide
sample, surveys are given to a randomly selected group of students. In Spring 2004,
students were asked about alcohol, illegal drug, and cigarette use. Describe the W's, if the
information is given. If the information is not given, state that it is not specified.
• Who:
• What:
• When:
• Where:
• How:
• Why:
Unlock Deck
Unlock for access to all 125 flashcards in this deck.
Unlock Deck
k this deck
42
The boxplots show the age of people involved in accidents according to their role in
the accident.
a. Which role involved the youngest person, and what is the age?
b. Which role had the lowest median age, and what is the age?
c. Which role had smallest range of ages, and what is it?
d. Which role had the largest IQR of ages, and what is it?
e. Which role generally involves the oldest people? Explain.
the accident.
a. Which role involved the youngest person, and what is the age?
b. Which role had the lowest median age, and what is the age?
c. Which role had smallest range of ages, and what is it?
d. Which role had the largest IQR of ages, and what is it?
e. Which role generally involves the oldest people? Explain.
Unlock Deck
Unlock for access to all 125 flashcards in this deck.
Unlock Deck
k this deck
43
In November 2003 Discover published an article on the colonies of ants. They reported some basic information about many
species of ants and the results of some discoveries found by myrmecologist Walter Tschinkel of the University of Florida.
Information included the scientific name of the ant species, the geographic location, the depth of the nest (in feet), the number
of chambers in the nest, and the number of ants in the colony. The article documented how new ant colonies begin, the
ant-nest design, and how nests differ in shape, number, size of chambers, and how they are connected, depending on the
species. It reported that nest designs include vertical, horizontal, or inclined tunnels for movement and transport of food and
ants.
List the variables. Indicate whether each variable is categorical or quantitative. If the
variable is quantitative, tell the units.
Unlock Deck
Unlock for access to all 125 flashcards in this deck.
Unlock Deck
k this deck
44
The five-number summary for the fuel economy (in miles per gallon) of year 2011 midsize
cars is:
a. Would you expect the mean gas mileage of all midsize cars to be higher or lower than
the median? Explain.
b. One model of Volkswagon gets 34 mpg, one model of Toyota gets 28 mpg, and one
model of Bentley gets 13 mpg. Are any of these cars outliers (according to the original
statistics above)? Explain.
cars is:
a. Would you expect the mean gas mileage of all midsize cars to be higher or lower than
the median? Explain.
b. One model of Volkswagon gets 34 mpg, one model of Toyota gets 28 mpg, and one
model of Bentley gets 13 mpg. Are any of these cars outliers (according to the original
statistics above)? Explain.
Unlock Deck
Unlock for access to all 125 flashcards in this deck.
Unlock Deck
k this deck
45
What is the marginal distribution of age groups?
Unlock Deck
Unlock for access to all 125 flashcards in this deck.
Unlock Deck
k this deck
46
To determine if people's preference in dogs had changed in the recent years, organizers of a local dog show asked people
who attended the show to indicate which breed was their favorite. This information was compiled by dog breed and gender
of the people who responded. The table summarizes the responses.
Find each percent.
a. What percent of the responses were from males who favor Labradors?
b. What percent of the male responses favor Labradors?
c. What percent of the people who choose Labradors were males?
Unlock Deck
Unlock for access to all 125 flashcards in this deck.
Unlock Deck
k this deck
47
Health insurance The World Almanac and Book of Facts 2004 reported the percent of people
not covered by health insurance in the 50 states and Washington, D.C., for the year 2002.
Computer output gives these summaries for the percent of people not covered by health
insurance:
Is it more appropriate to use the mean and standard deviation or the median and IQR to
describe these data? Explain.
not covered by health insurance in the 50 states and Washington, D.C., for the year 2002.
Computer output gives these summaries for the percent of people not covered by health
insurance:
Is it more appropriate to use the mean and standard deviation or the median and IQR to
describe these data? Explain.
Unlock Deck
Unlock for access to all 125 flashcards in this deck.
Unlock Deck
k this deck
48
In July 2013, the Federal Drug Administration approved a new version of a drug used to treat opium dependence. The old
version of the drug had received complaints about a bitter taste, an aftertaste, and that it took a long time to dissolve. The
goal of the new version was to get more patients to take the drug as prescribed by addressing these issues. In addition to
these improvements, experimenters monitored the existence and types of side effects of the drug.
List the variables. Indicate whether each variable is categorical or quantitative. If the
variable is quantitative, tell the units.
Unlock Deck
Unlock for access to all 125 flashcards in this deck.
Unlock Deck
k this deck
49
Has the percentage of young girls drinking milk changed over time? The following table is consistent with the results from
"Beverage Choices of Young Females: Changes and Impact on Nutrient Intakes" (Shanthy A. Bowman, Journal of the American
Dietetic Association, 102(9), pp. 1234-1239):
Consider the following pie charts of the a subset of the data above:
Do the pie charts above indicate that milk consumption by young girls is independent of
the nationwide survey year? Explain.
"Beverage Choices of Young Females: Changes and Impact on Nutrient Intakes" (Shanthy A. Bowman, Journal of the American
Dietetic Association, 102(9), pp. 1234-1239):
Consider the following pie charts of the a subset of the data above:
Do the pie charts above indicate that milk consumption by young girls is independent of
the nationwide survey year? Explain.
Unlock Deck
Unlock for access to all 125 flashcards in this deck.
Unlock Deck
k this deck
50
Copy machines A manufacturer claims that lifespans for their copy machines (in months)
can be described by a Normal model N(42,7). Show your work.
a. Draw and clearly label the model.
b. A company with a several large office buildings buys 200 of these copiers. The salesman
tells the boss "190 (95%) of your new copiers will last between _____ and _____ months."
Comment on this claim.
c. What is the 3rd quartile of copier lifespans?
d. What percent of the copiers are expected to fail before 36 months?
mean lifespan will stay the same, what standard deviation must they achieve?
f. Briefly explain what that change in standard deviation means in this context.
g. A competing manufacturer says that not only will 90% of their copiers last at least 36
months, 65% will last at least 42 months. What Normal model parameters is that
manufacturer claiming? Show your work.
can be described by a Normal model N(42,7). Show your work.
a. Draw and clearly label the model.
b. A company with a several large office buildings buys 200 of these copiers. The salesman
tells the boss "190 (95%) of your new copiers will last between _____ and _____ months."
Comment on this claim.
c. What is the 3rd quartile of copier lifespans?
d. What percent of the copiers are expected to fail before 36 months?
mean lifespan will stay the same, what standard deviation must they achieve?
f. Briefly explain what that change in standard deviation means in this context.
g. A competing manufacturer says that not only will 90% of their copiers last at least 36
months, 65% will last at least 42 months. What Normal model parameters is that
manufacturer claiming? Show your work.
Unlock Deck
Unlock for access to all 125 flashcards in this deck.
Unlock Deck
k this deck
51
A research company frequently monitors trends in the use of social media by American Adults. The results of one survey of
1846 randomly selected adults looked at social media use versus age group. The table summarizes the survey results.
Write a sentence or two about the conditional relative frequency distribution of ages of
social media users.
1846 randomly selected adults looked at social media use versus age group. The table summarizes the survey results.
Write a sentence or two about the conditional relative frequency distribution of ages of
social media users.
Unlock Deck
Unlock for access to all 125 flashcards in this deck.
Unlock Deck
k this deck
52
To determine if people's preference in dogs had changed in the recent years, organizers of a local dog show asked people
who attended the show to indicate which breed was their favorite. This information was compiled by dog breed and gender
of the people who responded. The table summarizes the responses.
Identify the variables and tell whether each is categorical or quantitative.
who attended the show to indicate which breed was their favorite. This information was compiled by dog breed and gender
of the people who responded. The table summarizes the responses.
Identify the variables and tell whether each is categorical or quantitative.
Unlock Deck
Unlock for access to all 125 flashcards in this deck.
Unlock Deck
k this deck
53
A research company frequently monitors trends in the use of social media by American Adults. The results of one survey of
1846 randomly selected adults looked at social media use versus age group. The table summarizes the survey results.
Identify the variables and tell whether each is categorical or quantitative.
1846 randomly selected adults looked at social media use versus age group. The table summarizes the survey results.
Identify the variables and tell whether each is categorical or quantitative.
Unlock Deck
Unlock for access to all 125 flashcards in this deck.
Unlock Deck
k this deck
54
Suppose that the student taking 22 credit hours in the data set was actually taking 28 credit
hours instead of 22 (so we would replace the 22 in the data set with 28). Indicate whether
changing the number of credit hours for that student would make each of the following
summary statistics increase, decrease, or stay about the same:
a. mean
b. median
c. range
d. IQR
e. standard deviation
hours instead of 22 (so we would replace the 22 in the data set with 28). Indicate whether
changing the number of credit hours for that student would make each of the following
summary statistics increase, decrease, or stay about the same:
a. mean
b. median
c. range
d. IQR
e. standard deviation
Unlock Deck
Unlock for access to all 125 flashcards in this deck.
Unlock Deck
k this deck
55
At www.census.gov you can create a "population pyramid" for any country. These
pyramids are back-to-back histograms. This pyramid shows Mexico's 2000 female
population and the census bureau's projection for 2050. Write a few sentences
summarizing the changes that are forecast.
pyramids are back-to-back histograms. This pyramid shows Mexico's 2000 female
population and the census bureau's projection for 2050. Write a few sentences
summarizing the changes that are forecast.
Unlock Deck
Unlock for access to all 125 flashcards in this deck.
Unlock Deck
k this deck
56
A survey conducted in a college intro stats class asked students about the number of credit hours they were taking that
quarter. The number of credit hours for a random sample of 16 students is given in the table.
a. Sketch a histogram of these data
b. Find the mean and standard deviation for the number of credit hours.
c. Find the median and IQR for the number of credit hours.
d. Is it more appropriate to use the mean and standard deviation or the median and IQR to
summarize theses data? Explain.
quarter. The number of credit hours for a random sample of 16 students is given in the table.
a. Sketch a histogram of these data
b. Find the mean and standard deviation for the number of credit hours.
c. Find the median and IQR for the number of credit hours.
d. Is it more appropriate to use the mean and standard deviation or the median and IQR to
summarize theses data? Explain.
Unlock Deck
Unlock for access to all 125 flashcards in this deck.
Unlock Deck
k this deck
57
On Monday, a class of students took a big test, and the highest score was 92. The next day,
a student who had been absent made up the test, scoring 100. Indicate whether adding that
student's score to the rest of the data made each of these summary statistics increase,
decrease, or stay about the same:
a. mean
b. median
c. range
d. IQR
e. standard deviation
a student who had been absent made up the test, scoring 100. Indicate whether adding that
student's score to the rest of the data made each of these summary statistics increase,
decrease, or stay about the same:
a. mean
b. median
c. range
d. IQR
e. standard deviation
Unlock Deck
Unlock for access to all 125 flashcards in this deck.
Unlock Deck
k this deck
58
A research company frequently monitors trends in the use of social media by American Adults. The results of one survey of
1846 randomly selected adults looked at social media use versus age group. The table summarizes the survey results.
Do you think social media use is independent of age? Give statistical evidence to support
your conclusion.
1846 randomly selected adults looked at social media use versus age group. The table summarizes the survey results.
Do you think social media use is independent of age? Give statistical evidence to support
your conclusion.
Unlock Deck
Unlock for access to all 125 flashcards in this deck.
Unlock Deck
k this deck
59
One thousand students from a local university were sampled to gather information such as
gender, high school GPA, college GPA, and total SAT scores. The results were used to
create histograms displaying high school grade point averages (GPAs) for both males and
females. Compare the grade distribution of males and females.
gender, high school GPA, college GPA, and total SAT scores. The results were used to
create histograms displaying high school grade point averages (GPAs) for both males and
females. Compare the grade distribution of males and females.
Unlock Deck
Unlock for access to all 125 flashcards in this deck.
Unlock Deck
k this deck
60
The boxplots show prices of used cars (in thousands of dollars) advertised for sale at three
different car dealers.
a. Which dealer offers the cheapest car offered, and at what price?
b. Which dealer has the lowest median price, and how much is it?
c. Which dealer has the smallest price range, and what is it?
d. Which dealer's prices have the smallest IQR, and what is it?
e. Which dealer generally sells cars cheapest? Explain.
different car dealers.
a. Which dealer offers the cheapest car offered, and at what price?
b. Which dealer has the lowest median price, and how much is it?
c. Which dealer has the smallest price range, and what is it?
d. Which dealer's prices have the smallest IQR, and what is it?
e. Which dealer generally sells cars cheapest? Explain.
Unlock Deck
Unlock for access to all 125 flashcards in this deck.
Unlock Deck
k this deck
61
A research company frequently monitors trends in the use of social media by American Adults. The results of one survey of
1846 randomly selected adults looked at social media use versus age group. The table summarizes the survey results.
Find each percent.
a) What percent of adults surveyed are social media users aged 30-49?
b) What percent of the social media users are aged 30-49?
c) What percent of adults aged 30-49 are social media users?
Unlock Deck
Unlock for access to all 125 flashcards in this deck.
Unlock Deck
k this deck
62
All students in a physical education class completed a basketball free-throw shooting
event and the highest number of shots made was 32. The next day a student who had just
transferred into the school completed the event, making 35 shots. Indicate whether adding
the new student's score to the rest of the data made each of these summary statistics
increase, decrease, or stay about the same:
a. mean
b. median
c. range
d. IQR
e. standard deviation
Unlock Deck
Unlock for access to all 125 flashcards in this deck.
Unlock Deck
k this deck
63
Commuting to work The table shows how a company's employees commute to work.
a. What is the marginal distribution (in %) of mode of transportation (Car, Bus, Train)?
b. What is the conditional distribution (in %) of mode of transportation (Car, Bus, Train) for
management?
c. What kind of display would you use to show the association between job class and mode
of transportation? (Just name a graph.)
d. Do job classification and mode of transportation appear to be independent? Give
statistical evidence to support your conclusion.
Unlock Deck
Unlock for access to all 125 flashcards in this deck.
Unlock Deck
k this deck
64
Soft drinks A restaurant owner wanted to improve the efficiency of his employees. One
way he tried to do this was to buy a machine that will automatically dispense 16 oz. of
soda into a glass rather than have the employee hold the button on the dispenser. The
actual amount dispensed by the machine can be represented by the model N(16.2, 0.3)
a. Draw and clearly label the model.
b. The sales representative who sold him the machine said, "95% of the glasses you fill
with soda will fall between _________ and _________." Fill in the blanks based on the
normal model, then comment on this claim.
c. What is the 3rd quartile of amounts dispensed?
d. If a glass will actually hold 16.7 oz. of soda, what percent of the time would you expect
the glass to overflow?
e. The manufacturer wants to reduce the overflow rate to only 1%. Assuming the mean
amount dispensed will stay the same, what standard deviation must they achieve?
f. Briefly explain what that change in standard deviation means in this context.
g. A competing manufacturer says that not only will 98% of their glasses be safe from
overflowing, but 70% will have more than 16 oz., reducing customer complaints. What
Normal model parameters is that manufacturer claiming? Show your work.
way he tried to do this was to buy a machine that will automatically dispense 16 oz. of
soda into a glass rather than have the employee hold the button on the dispenser. The
actual amount dispensed by the machine can be represented by the model N(16.2, 0.3)
a. Draw and clearly label the model.
b. The sales representative who sold him the machine said, "95% of the glasses you fill
with soda will fall between _________ and _________." Fill in the blanks based on the
normal model, then comment on this claim.
c. What is the 3rd quartile of amounts dispensed?
d. If a glass will actually hold 16.7 oz. of soda, what percent of the time would you expect
the glass to overflow?
e. The manufacturer wants to reduce the overflow rate to only 1%. Assuming the mean
amount dispensed will stay the same, what standard deviation must they achieve?
f. Briefly explain what that change in standard deviation means in this context.
g. A competing manufacturer says that not only will 98% of their glasses be safe from
overflowing, but 70% will have more than 16 oz., reducing customer complaints. What
Normal model parameters is that manufacturer claiming? Show your work.
Unlock Deck
Unlock for access to all 125 flashcards in this deck.
Unlock Deck
k this deck
65
Adult female Dalmatians weigh an average of 50 pounds with a standard deviation of 3.3
pounds. Adult female Boxers weigh an average of 57.5 pounds with a standard deviation
of 1.7 pounds. One statistics teacher owns an underweight Dalmatian and an underweight
Boxer. The Dalmatian weighs 45 pounds, and the Boxer weighs 52 pounds. Which dog is
more underweight? Explain.
pounds. Adult female Boxers weigh an average of 57.5 pounds with a standard deviation
of 1.7 pounds. One statistics teacher owns an underweight Dalmatian and an underweight
Boxer. The Dalmatian weighs 45 pounds, and the Boxer weighs 52 pounds. Which dog is
more underweight? Explain.
Unlock Deck
Unlock for access to all 125 flashcards in this deck.
Unlock Deck
k this deck
66
Owners of a minor league baseball team believe that a Normal model is useful in
projecting the number of fans who will attend home games. They use a mean of 8500 fans
and a standard deviation of 1500 fans. Draw and clearly label this model.
projecting the number of fans who will attend home games. They use a mean of 8500 fans
and a standard deviation of 1500 fans. Draw and clearly label this model.
Unlock Deck
Unlock for access to all 125 flashcards in this deck.
Unlock Deck
k this deck
67
In order to plan transportation and parking needs at a private high school, administrators asked students how they get to
school. Some rode a school bus, some rode in with parents or friends, and others used "personal" transportation - bikes,
skateboards, or just walked. The table summarizes the responses from boys and girls.
Write a sentence or two about the conditional relative frequency distribution of modes of
transportation for the boys.
Unlock Deck
Unlock for access to all 125 flashcards in this deck.
Unlock Deck
k this deck
68
Human body temperatures taken through the ear are typically 0.5° F higher than body
temperatures taken orally. Making this adjustment and using the 1992 Journal of the
American Medical Association article that reports average oral body temperature as 98.2° F, we will assume that a Normal model with an average of 98.7° F and a standard deviation
of 0.7° F is appropriate for body temperatures taken through the ear.
a. An ear temperature of 97° F may indicate hypothermia (low body temperature). What
percent of people have ear temperatures that may indicate hypothermia?
b. Find the interquartile range for ear temperatures.
c. A new thermometer for the ear reports that it is more accurate than the ear thermometers
currently on the market. If the average ear temperature reading remains the same and the
company reports an IQR of 0.5° F, find the standard deviation for this new ear
thermometer.
Unlock Deck
Unlock for access to all 125 flashcards in this deck.
Unlock Deck
k this deck
69
Cellphones ConsumerReports.org evaluated the price and performance of 99 models of
cellphones. Computer output gives these summaries for the prices:
a. Were any of the prices outliers? Explain how you made your decision.
b. One of the manufacturers advertises a cellphone "economy-priced at only $31.95".
Would you consider that to be a very low price? Explain.
cellphones. Computer output gives these summaries for the prices:
a. Were any of the prices outliers? Explain how you made your decision.
b. One of the manufacturers advertises a cellphone "economy-priced at only $31.95".
Would you consider that to be a very low price? Explain.
Unlock Deck
Unlock for access to all 125 flashcards in this deck.
Unlock Deck
k this deck
70
There are 18 roller coasters in Virginia for which the lengths (in feet) were reported. Those lengths are listed in the table.
a. Sketch a histogram for these data.
b. Find the mean and standard deviation of the roller coaster lengths.
c. Is it appropriate to use the mean and standard deviation to summarize these data?
Explain.
d. Describe the distribution of roller coaster lengths.
a. Sketch a histogram for these data.
b. Find the mean and standard deviation of the roller coaster lengths.
c. Is it appropriate to use the mean and standard deviation to summarize these data?
Explain.
d. Describe the distribution of roller coaster lengths.
Unlock Deck
Unlock for access to all 125 flashcards in this deck.
Unlock Deck
k this deck
71
To determine if people's preference in dogs had changed in the recent years, organizers of a local dog show asked people
who attended the show to indicate which breed was their favorite. This information was compiled by dog breed and gender
of the people who responded. The table summarizes the responses.
What is the marginal distribution of breeds?
who attended the show to indicate which breed was their favorite. This information was compiled by dog breed and gender
of the people who responded. The table summarizes the responses.
What is the marginal distribution of breeds?
Unlock Deck
Unlock for access to all 125 flashcards in this deck.
Unlock Deck
k this deck
72
Consider the following part of a data set:
List the variables in the data set. Indicate whether each variable is treated as categorical or
quantitative in this data set. If the variable is quantitative, state the units.
List the variables in the data set. Indicate whether each variable is treated as categorical or
quantitative in this data set. If the variable is quantitative, state the units.
Unlock Deck
Unlock for access to all 125 flashcards in this deck.
Unlock Deck
k this deck
73
Concrete thickness A roadway construction process uses a machine that pours concrete
onto the roadway and measures the thickness of the concrete so the roadway will measure
up to the required depth in inches. The concrete thickness needs to be consistent across the
road, but the machine isn't perfect and it is costly to operate. Since there's a safety hazard if
the roadway is thinner than the minimum 23 inch thickness, the company sets the machine
to average 26 inches for the batches of concrete. They believe the thickness level of the
machine's concrete output can be described by a Normal model with standard deviation
1.75 inches. [Show work]
a. What percent of the concrete roadway is under the minimum depth?
b. The company's lawyers insist that no more than 3% of the output be under the limit.
Because of the expense of operating the machine, they cannot afford to reset the mean to a
higher value. Instead they will try to reduce the standard deviation to achieve the "only 3%
under" goal. What standard deviation must they attain?
c. Explain what achieving a smaller standard deviation means in this context.
Unlock Deck
Unlock for access to all 125 flashcards in this deck.
Unlock Deck
k this deck
74
A company's manufacturing process uses 500 gallons of water at a time. A "scrubbing"
machine then removes most of a chemical pollutant before pumping the water into a
nearby lake. Legally the treated water should contain no more than 80 parts per million of
the chemical, but the machine isn't perfect and it is costly to operate. Since there's a fine if
the discharged water exceeds the legal maximum, the company sets the machine to attain
an average of 75 ppm for the batches of water treated. They believe the machine's output
can be described by a Normal model with standard deviation 4.2 ppm. (SHOW
WORK)
a. What percent of the batches of water discharged exceed the 80ppm standard?
b. The company's lawyers insist that they not have more than 2% of the water over the
limit. To what mean value should the company set the scrubbing machine? Assume the
standard deviation does not change.
c. Because achieving a mean that low would raise the costs too much, they decide to leave
the mean set at 75 ppm and try to reduce the standard deviation to achieve the "only 2%
over" goal. Find the new standard deviation needed.
d. Explain what achieving a smaller standard deviation means in this context.
Unlock Deck
Unlock for access to all 125 flashcards in this deck.
Unlock Deck
k this deck
75
Veterinary costs Costs for standard veterinary services at a local animal hospital follow a
Normal model with a mean of $80 and a standard deviation of $20.
a. Draw and clearly label this model.
b. Is it unusual to have a veterinary bill for $125? Explain.
c. What is the IQR for the costs of standard veterinary services? Show your work
Normal model with a mean of $80 and a standard deviation of $20.
a. Draw and clearly label this model.
b. Is it unusual to have a veterinary bill for $125? Explain.
c. What is the IQR for the costs of standard veterinary services? Show your work
Unlock Deck
Unlock for access to all 125 flashcards in this deck.
Unlock Deck
k this deck
76
To determine if people's preference in dogs had changed in the recent years, organizers of a local dog show asked people
who attended the show to indicate which breed was their favorite. This information was compiled by dog breed and gender
of the people who responded. The table summarizes the responses.
Do you think the breed selection is independent of gender? Give statistical evidence to
support your conclusion.
who attended the show to indicate which breed was their favorite. This information was compiled by dog breed and gender
of the people who responded. The table summarizes the responses.
Do you think the breed selection is independent of gender? Give statistical evidence to
support your conclusion.
Unlock Deck
Unlock for access to all 125 flashcards in this deck.
Unlock Deck
k this deck
77
In order to plan transportation and parking needs at a private high school, administrators asked students how they get to
school. Some rode a school bus, some rode in with parents or friends, and others used "personal" transportation
skateboards, or just walked. The table summarizes the responses from boys and girls.
Identify the variables and tell whether each is categorical or quantitative.
school. Some rode a school bus, some rode in with parents or friends, and others used "personal" transportation
skateboards, or just walked. The table summarizes the responses from boys and girls.
Identify the variables and tell whether each is categorical or quantitative.
Unlock Deck
Unlock for access to all 125 flashcards in this deck.
Unlock Deck
k this deck
78
Light bulbs are measured in lumens (light output), watts (energy used), and hours (life). A
standard white light bulb has a mean life of 675 hours and a standard deviation of 50
hours. A soft white light bulb has a mean life of 700 hours and a standard deviation of 35
hours. At a local science competition, both light bulbs lasted 750 hours. Which light bulb's
life span was better? Explain.
Unlock Deck
Unlock for access to all 125 flashcards in this deck.
Unlock Deck
k this deck
79
During a budget meeting, local school board members decided to review class size
information to determine if budgets were correct. Summary statistics are shown in the
table.
a. Notice that the third quartile and maximum class sizes are the same. Explain how this
can be.
b. The school district declares that classes with enrollments fewer than 20 students are "too
small". Would you consider a class of 20 students to be unusually small? Explain.
c. The school district sets the office supply budgets of their high schools on the enrollment
of students. The district budgets each class $12 plus $0.75 per student, so a class with one
student receives $12.75 and the classes with 40 students receive
What is
the median class budget for office supplies? And the IQR?
d. What are the mean and standard deviation of the class office supply budgets?
information to determine if budgets were correct. Summary statistics are shown in the
table.
a. Notice that the third quartile and maximum class sizes are the same. Explain how this
can be.
b. The school district declares that classes with enrollments fewer than 20 students are "too
small". Would you consider a class of 20 students to be unusually small? Explain.
c. The school district sets the office supply budgets of their high schools on the enrollment
of students. The district budgets each class $12 plus $0.75 per student, so a class with one
student receives $12.75 and the classes with 40 students receive
What is
the median class budget for office supplies? And the IQR?
d. What are the mean and standard deviation of the class office supply budgets?
Unlock Deck
Unlock for access to all 125 flashcards in this deck.
Unlock Deck
k this deck
80
In order to plan transportation and parking needs at a private high school, administrators asked students how they get to
school. Some rode a school bus, some rode in with parents or friends, and others used "personal" transportation - bikes,
skateboards, or just walked. The table summarizes the responses from boys and girls.
Find each percent.
a) What percent of the students are girls who ride the bus?
b) What percent of the girls ride the bus?
c) What percent of the bus riders are girls?
Unlock Deck
Unlock for access to all 125 flashcards in this deck.
Unlock Deck
k this deck
Unlock Deck
Unlock for access to all 125 flashcards in this deck.


