Deck 2: Frequency Distributions and Graphs
Full screen (f)
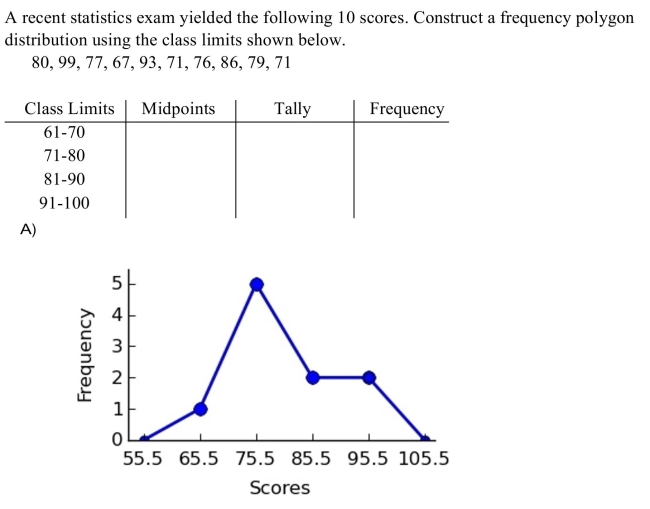
Question
Question
Question
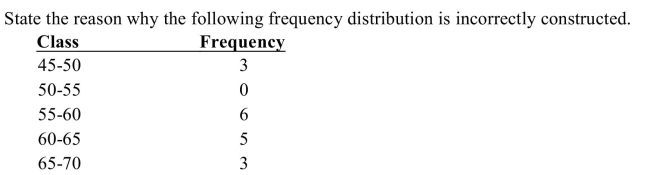
A) class limits overlap
B) a class has been omitted
C) there is no percent column
D) class width is not uniform
Question
Question
Question
Question
Question
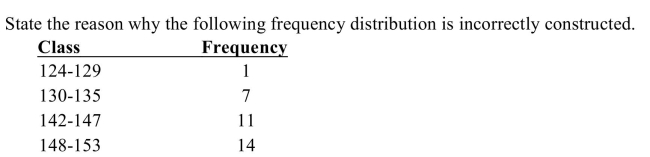
A) a class has been omitted
B) class width is not uniform
C) there is no percent column
D) class limits overlap
Question
Question
Question
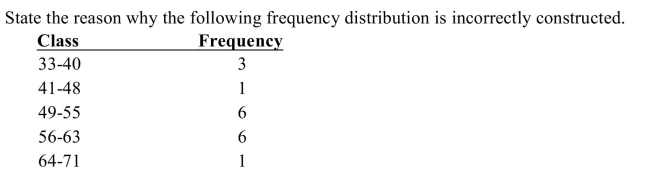
A) class limits overlap
B) there is no percent column
C) class width is not uniform
D) a class has been omitted
Question
Question
Question
Question
Question
Question
Question
Question
Question
 What is the class width?
A) 11
B) 80
C) 10
D) 9
Question
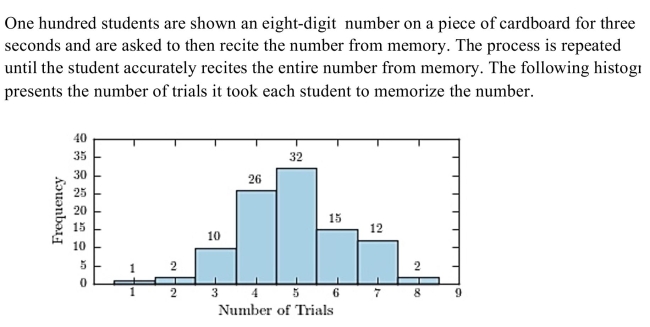 How many students memorized the number in three trials or less?
A) 3
B) 14
C) 87
D) 13
Question
Question
Question
Question
Question
Question
 nternet.
 Question
Question
Question
Question
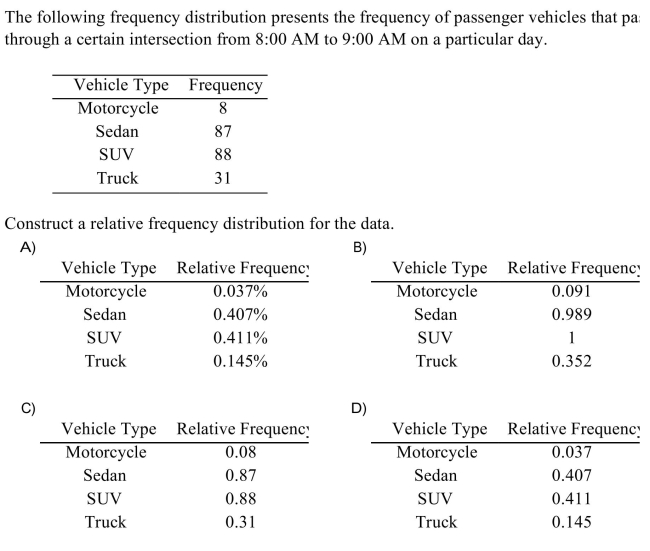
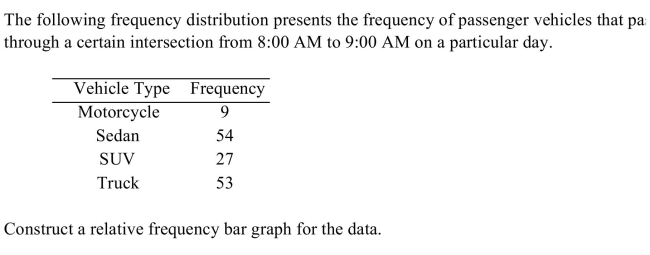
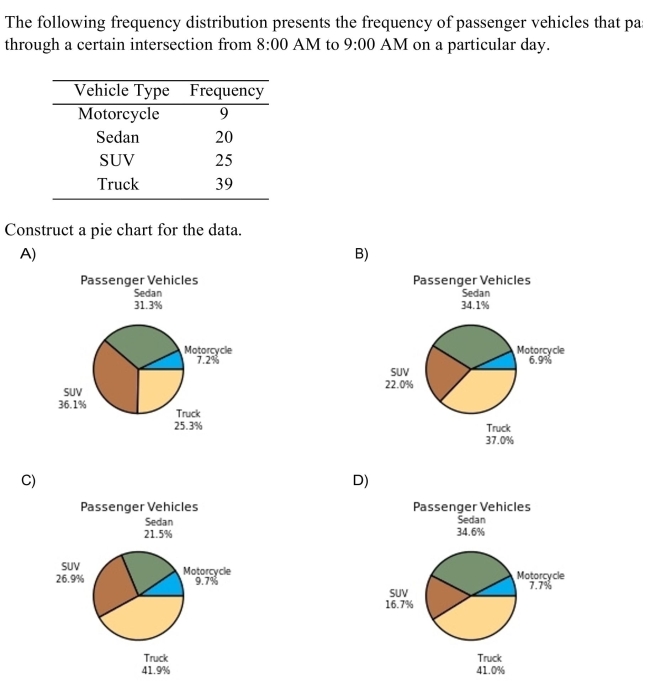
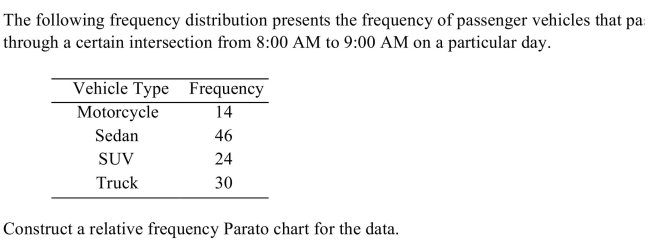
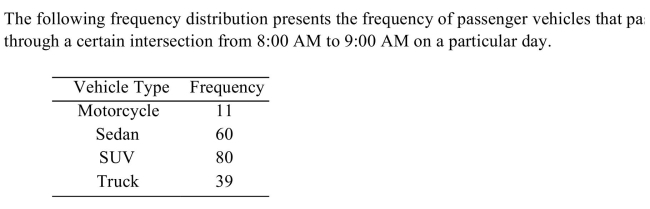 s What is the relative frequency of the Motorcyle category?
A) 0.138
B) 11%
C) 0.058
D) 11
Question
Question
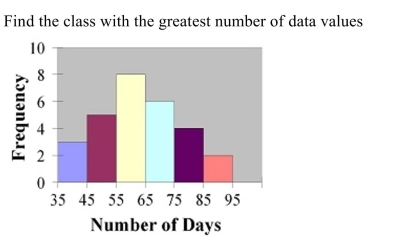
Question
Question
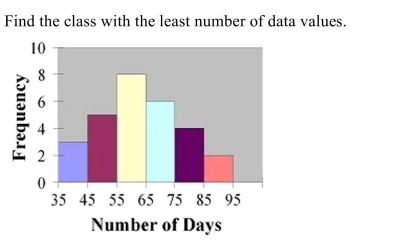
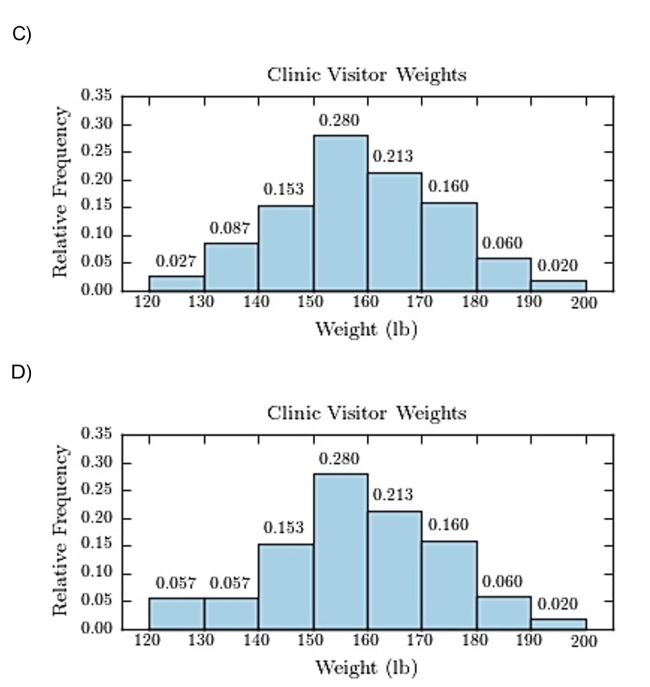
A) 55-65
B) 85-95
C) 65-75
D) 75-85
Question
Question
Question
Question
Question
A) 65-75
B) 75-85
C) 55-65
D) 85-95
Question
Question
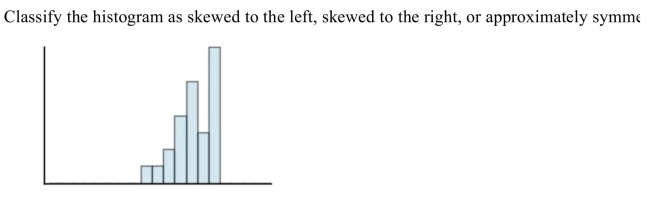 ic.
ic.A) skewed to the left
B) skewed to the right
C) approximately symmetric
Question
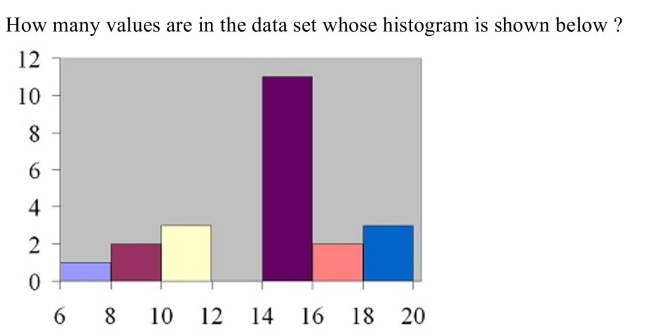
A) 72
B) 76
C) 6
D) 22
Question
Question
Question
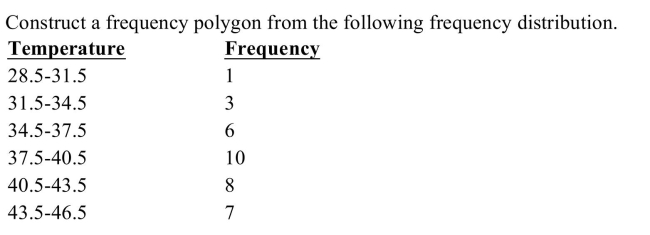
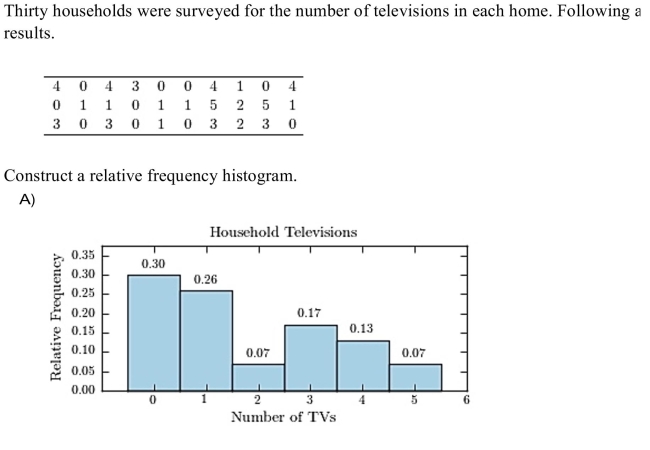
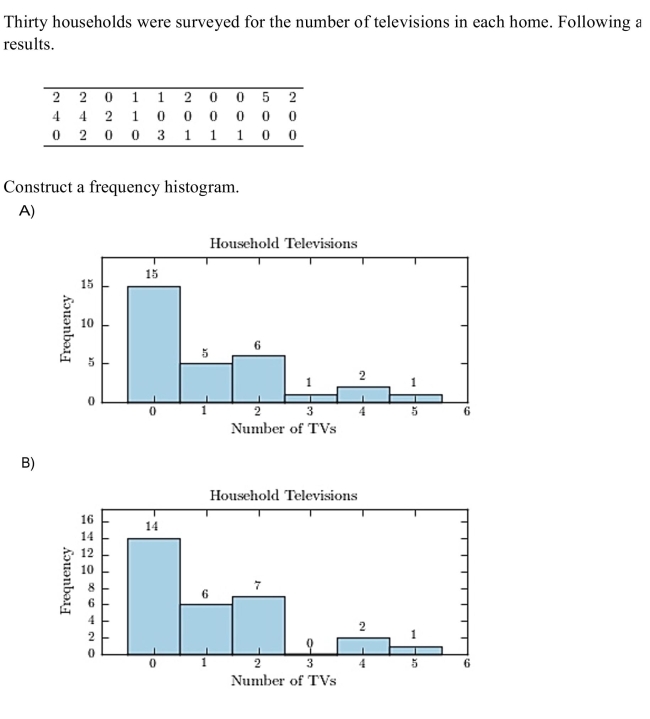
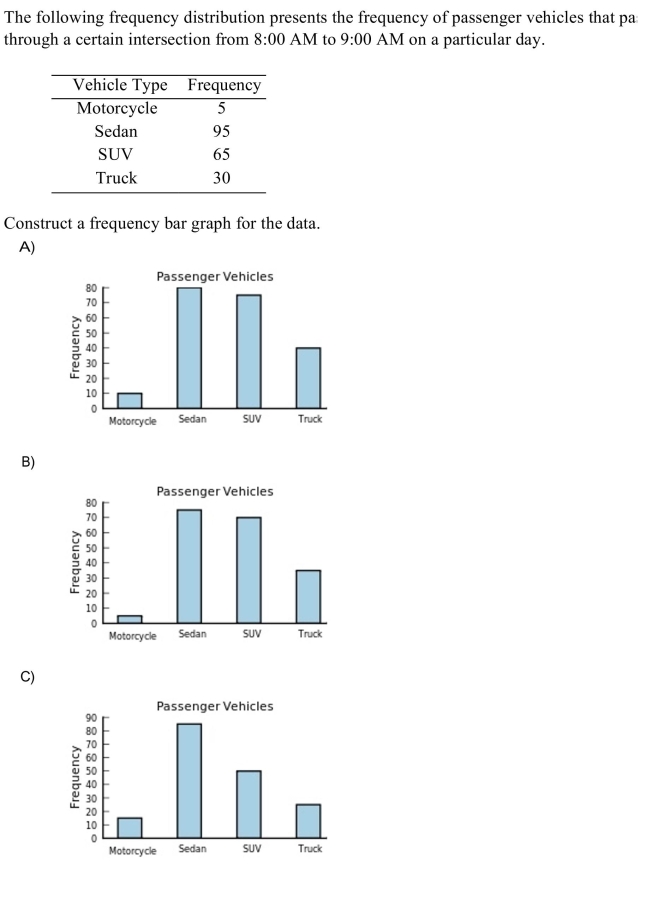
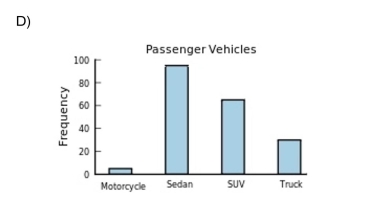
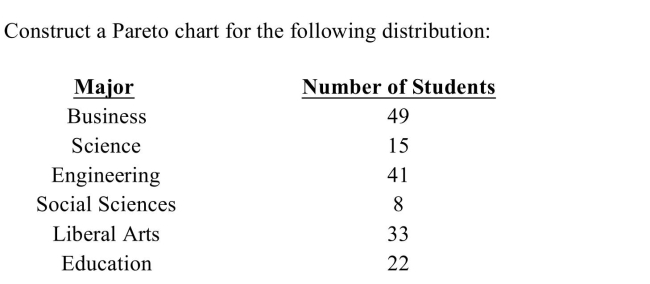
 Construct a frequency histogram.
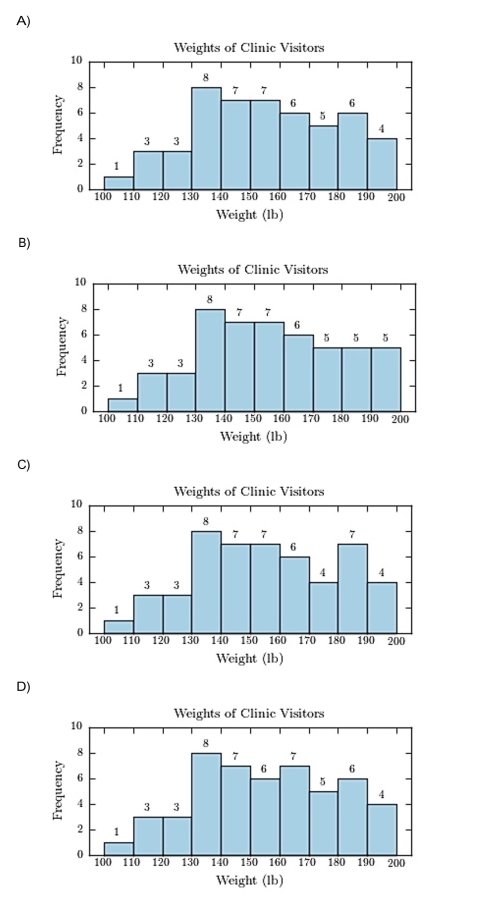
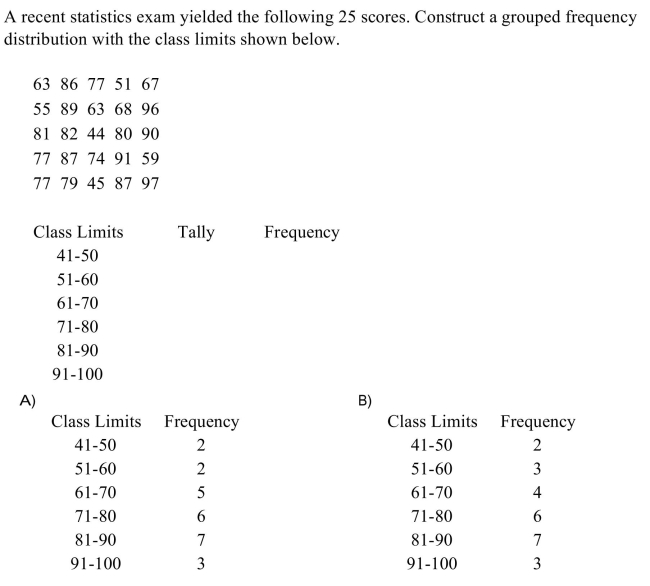
Question
A) 13
B) 12
C) 25
D) 44
Question
Question
 r equal
A) 20
B) 30
C) 66
D) 60
Question
Question
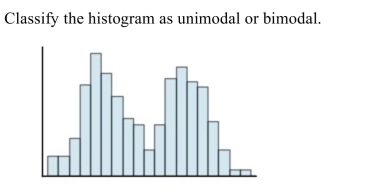
A) unimodal
B) bimodal
Question
Question
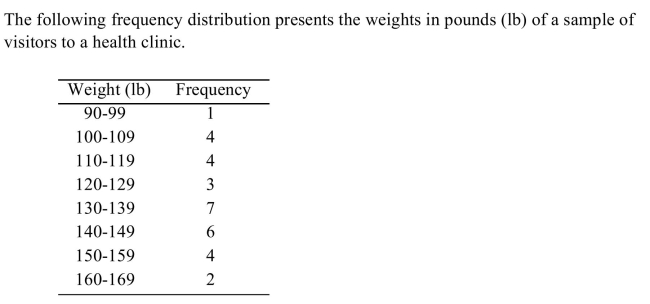
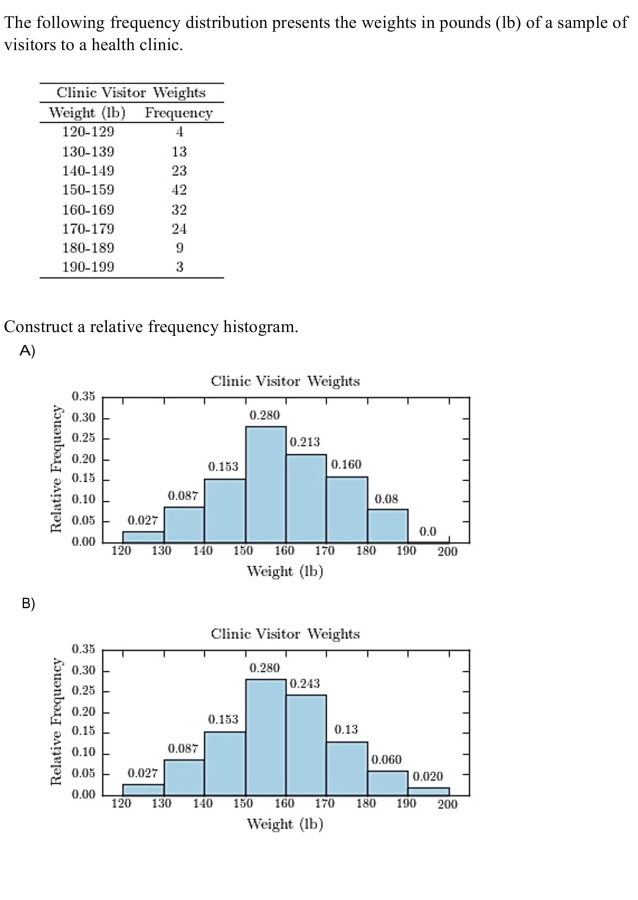
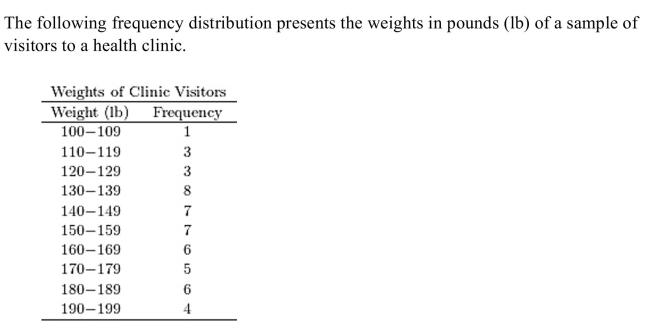
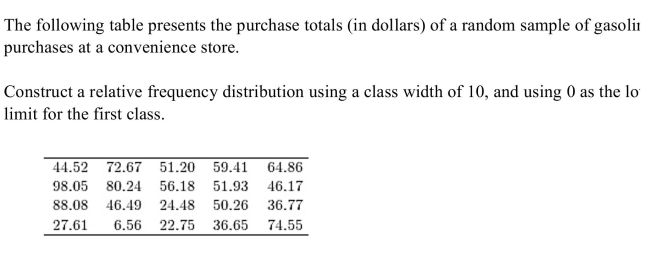
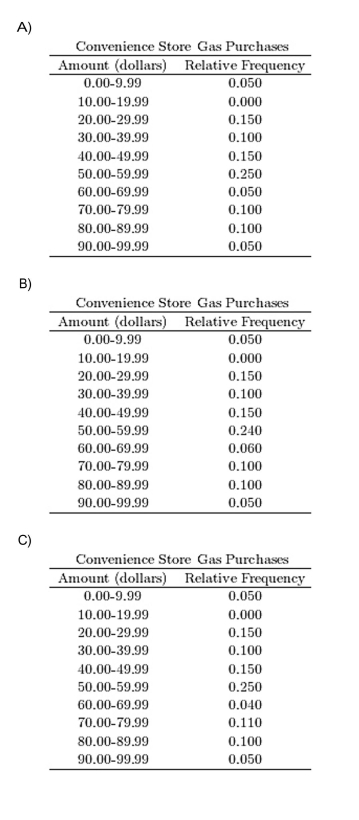
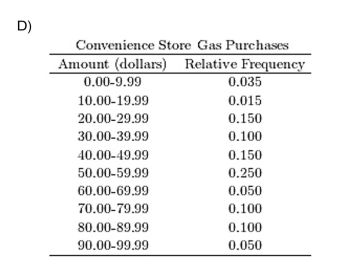
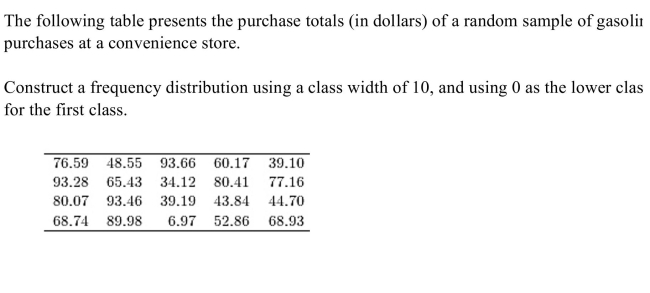
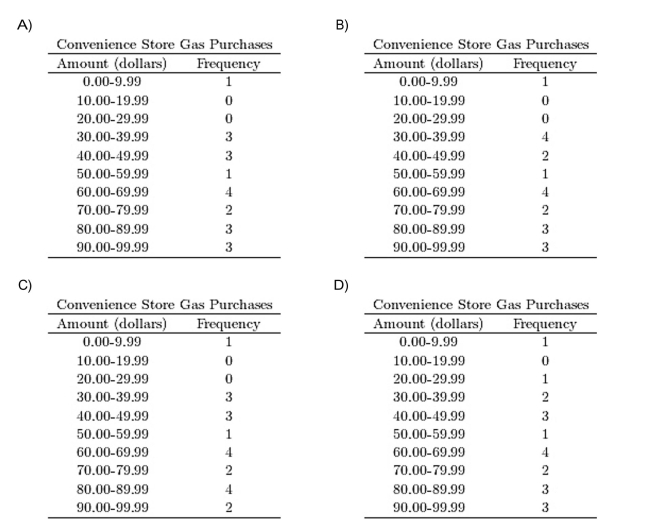
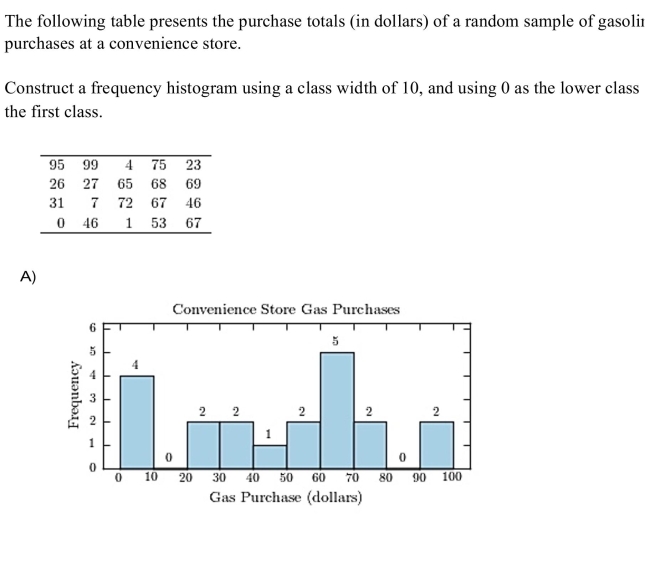
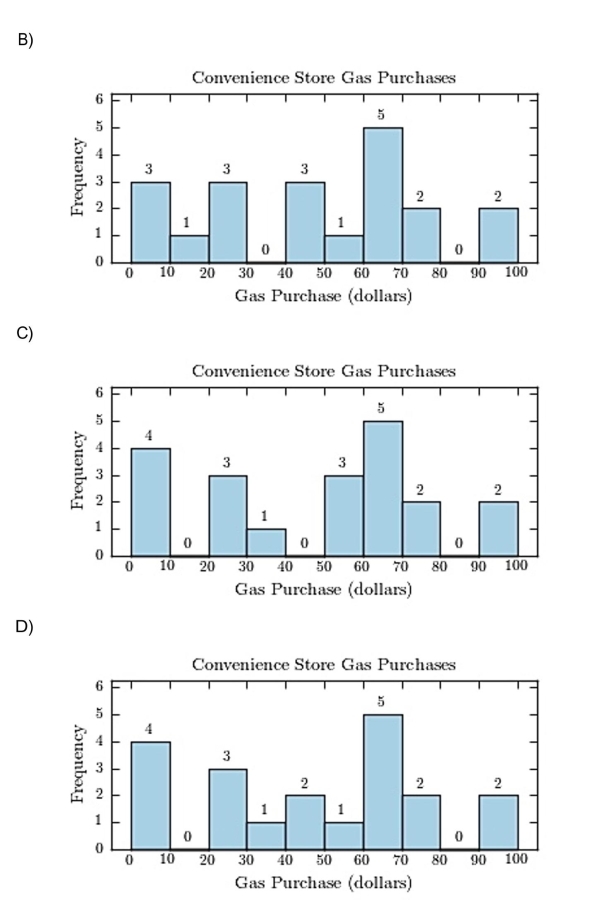
The following table presents the purchase totals (in dollars) of a random sample of gasoline purchases at a convenience store.
Construct a relative frequency histogram using a class width of 10, and using 0 as the lower class
Limit for the first class.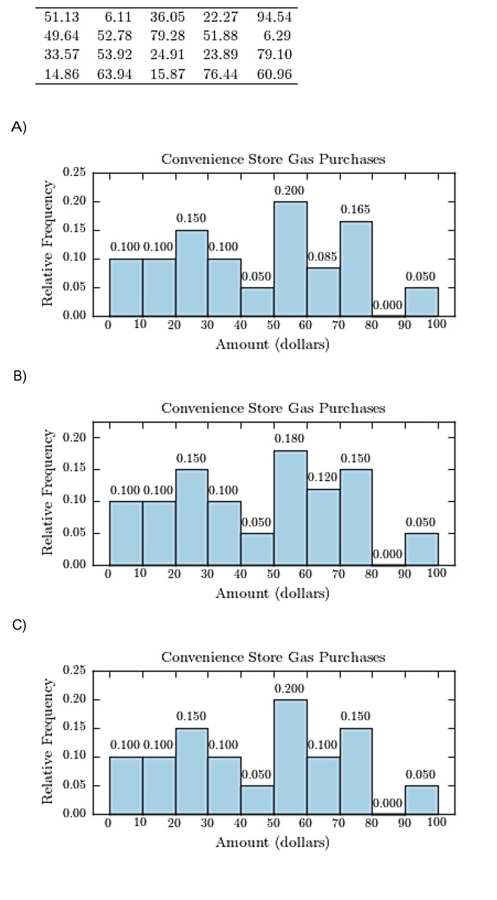
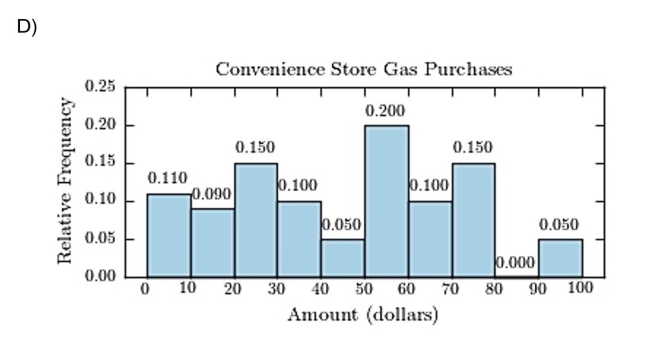
Construct a relative frequency histogram using a class width of 10, and using 0 as the lower class
Limit for the first class.
Question
Question
Question
Question
Question
Question
Question
Question
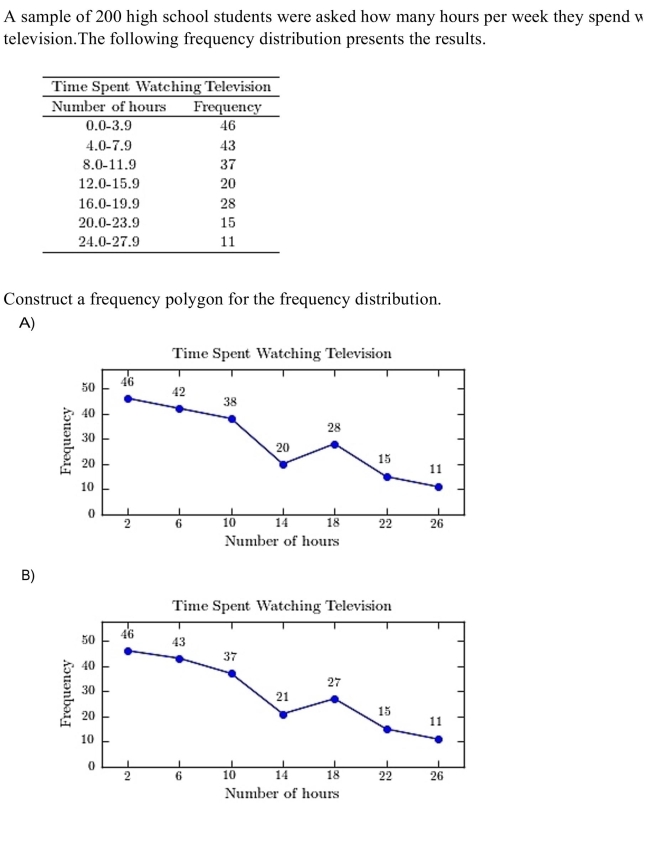
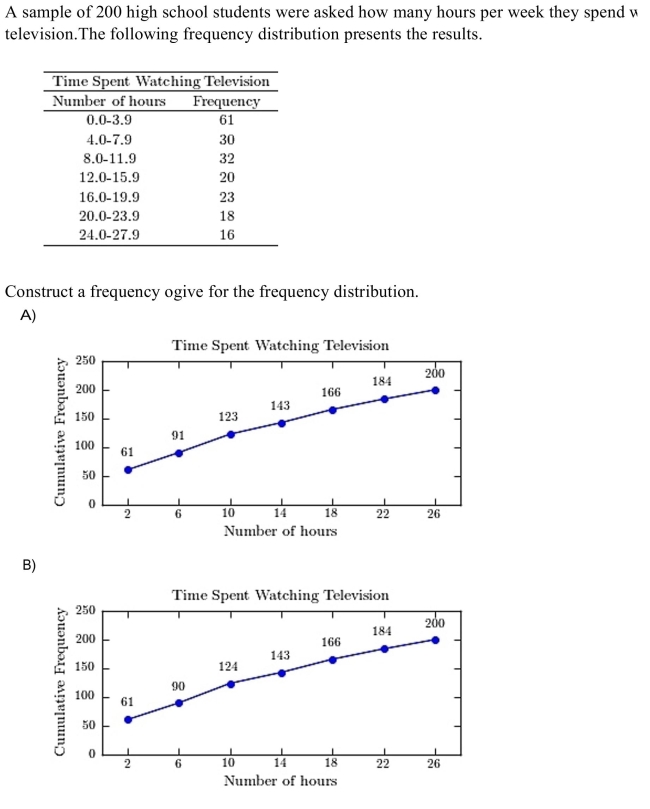
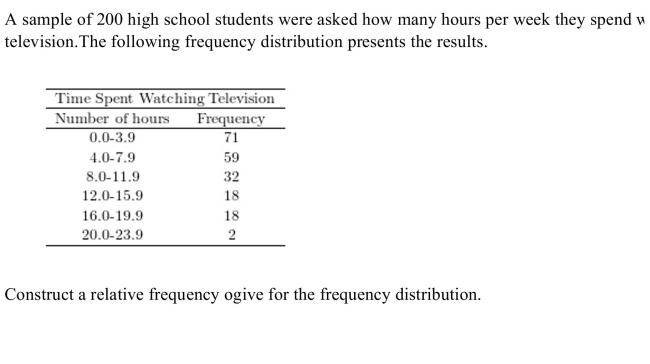 watching
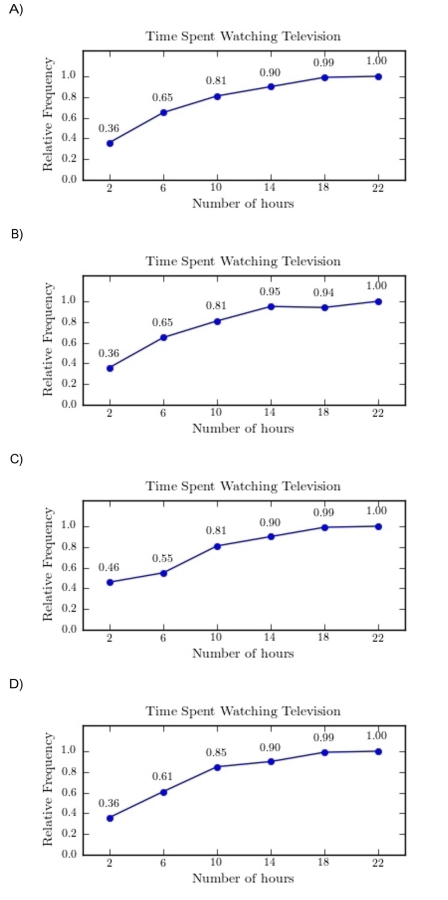
Question
Question
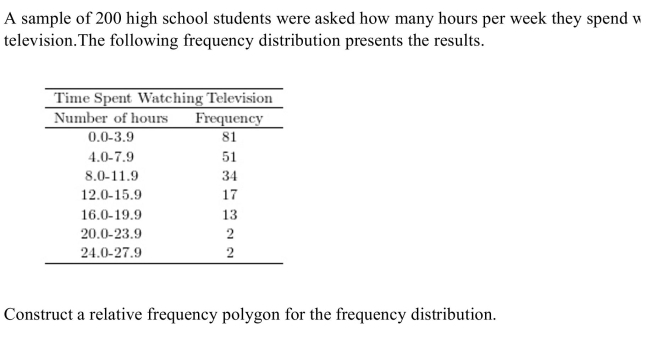
 s
s 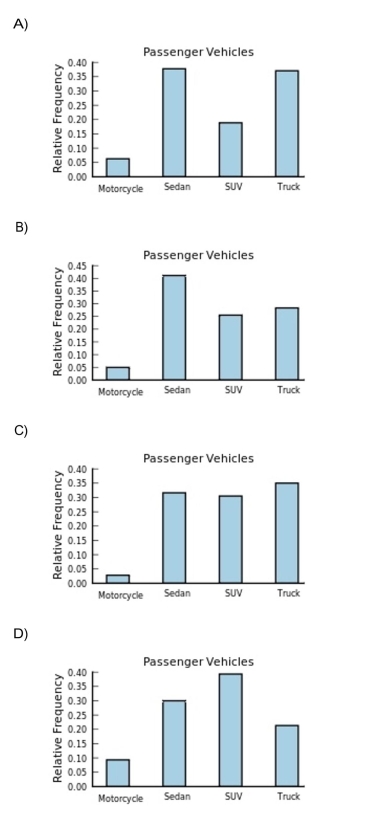
Question
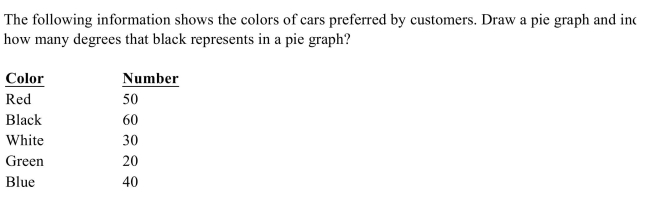
Karen is constructing a pie graph to represent the number of hours her classmates do homework each day. She found that 8 of 24 classmates did homework for three hours
Each day. In her pie graph, this would represent how many degrees?
Each day. In her pie graph, this would represent how many degrees?
Question
 the
the 
Question
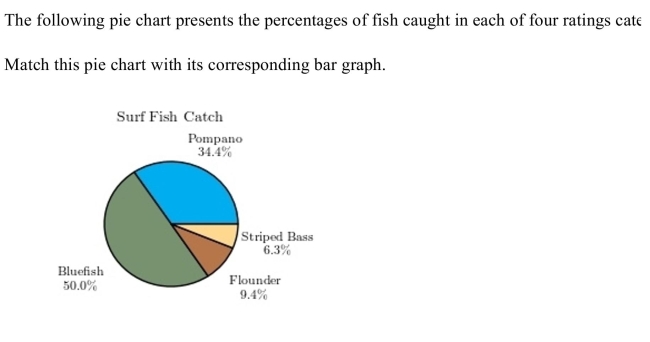
 gories.
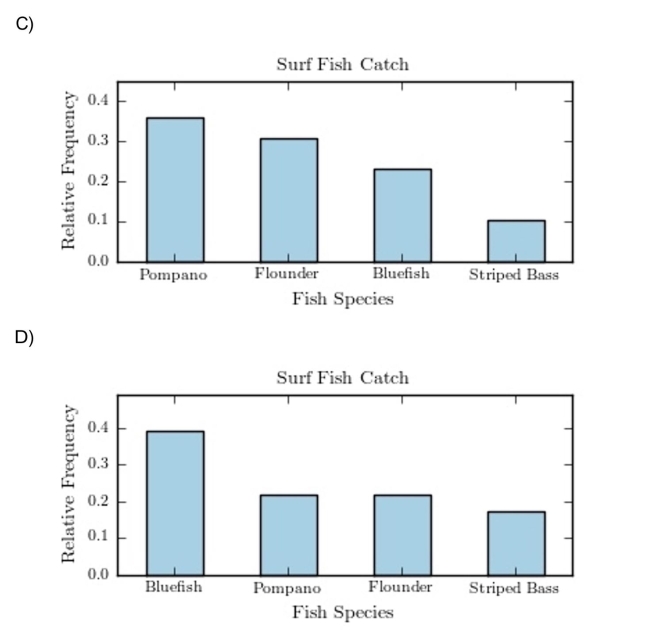
Question
 hing
hing 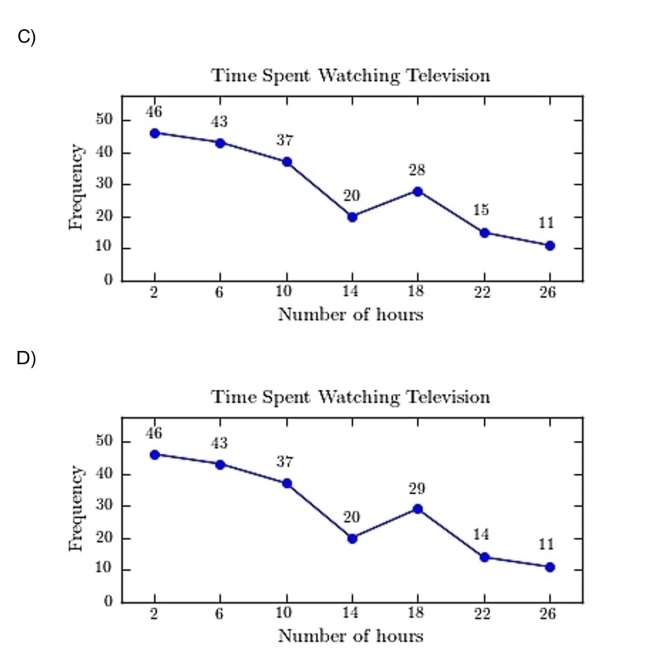
Question
 the
the 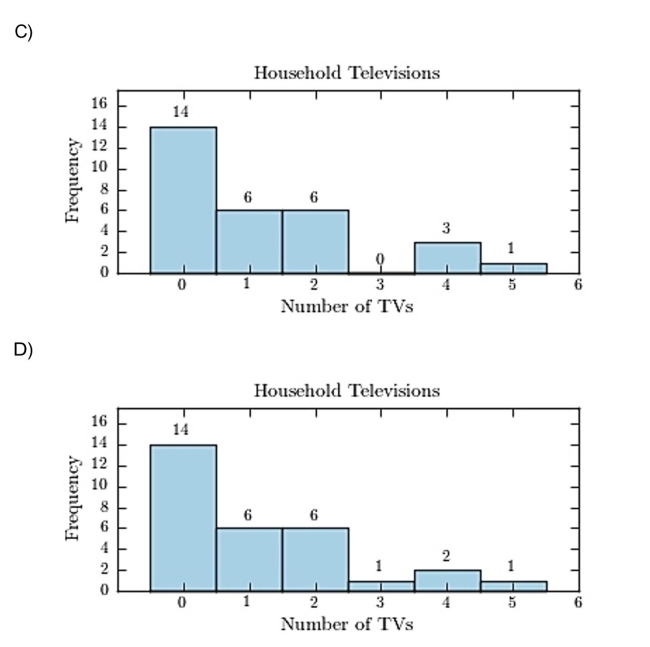
Question
Question
Question
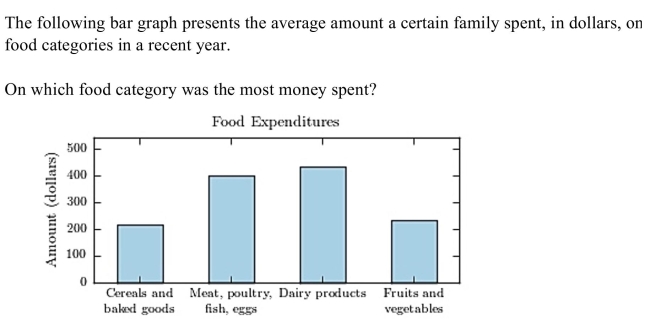 various
A) Cereals and baked goods
B) Fruits and vegetables
C) Dairy products
D) Meat poultry, fish, eggs
Question
 s
s Question
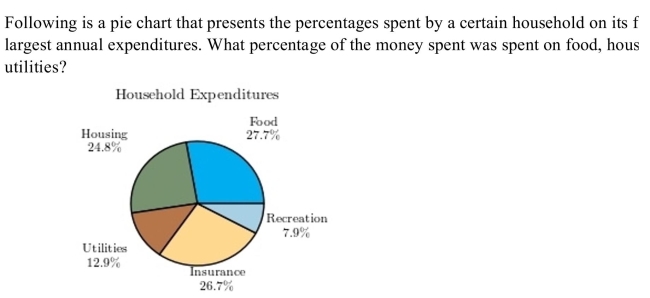
A) 65.4%
B) 47%
C) 60.4%
D) 52.5%
Question
Question
Question
 s
s 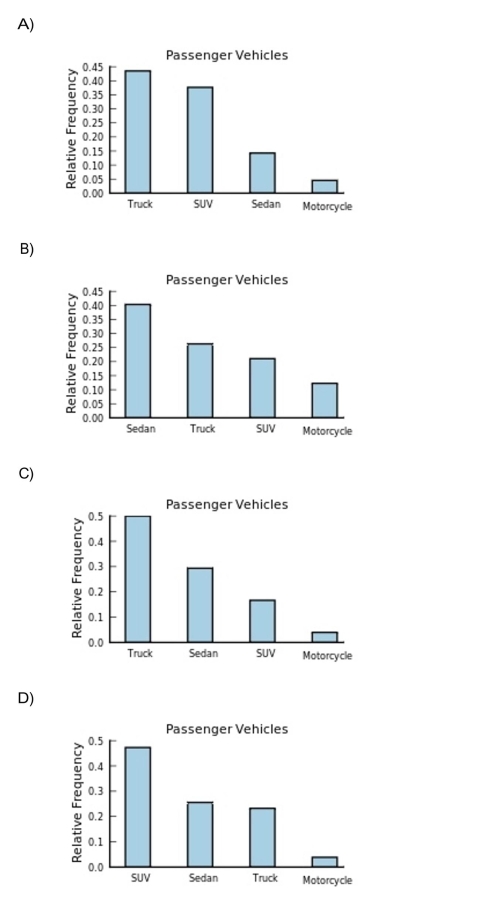
Question
 ate
ate Question
 6h6)ing
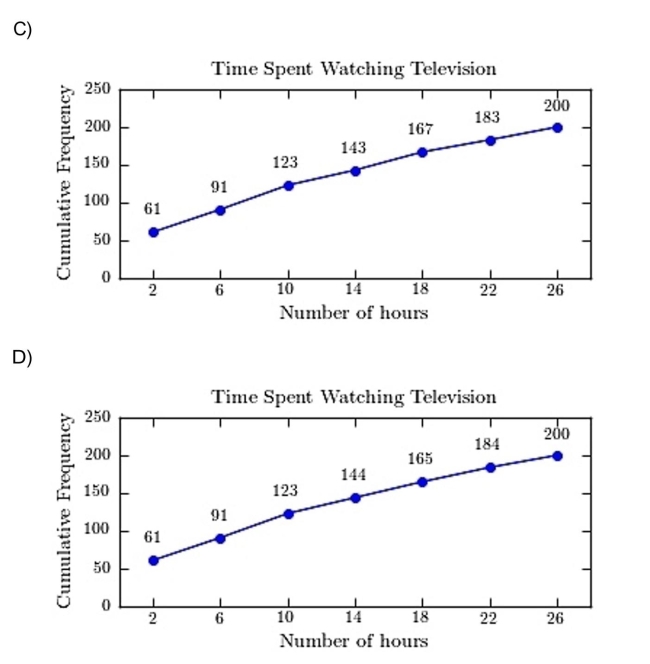
Question
 hing
hing 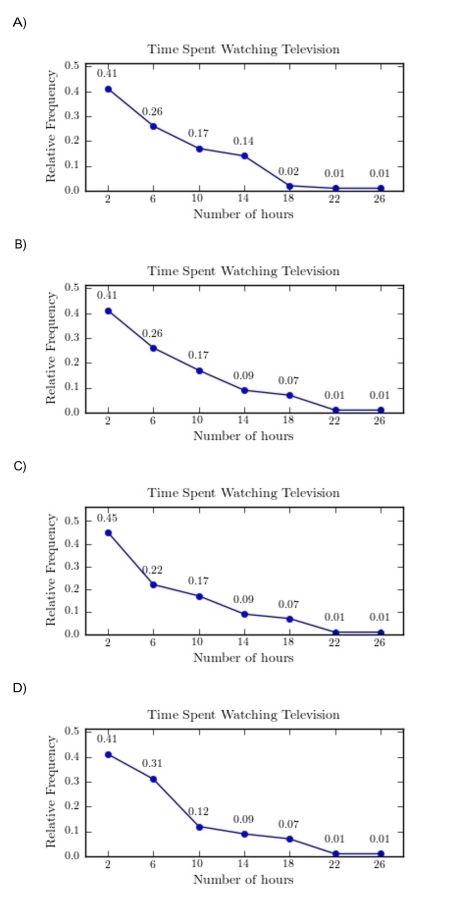
Question
 gories.
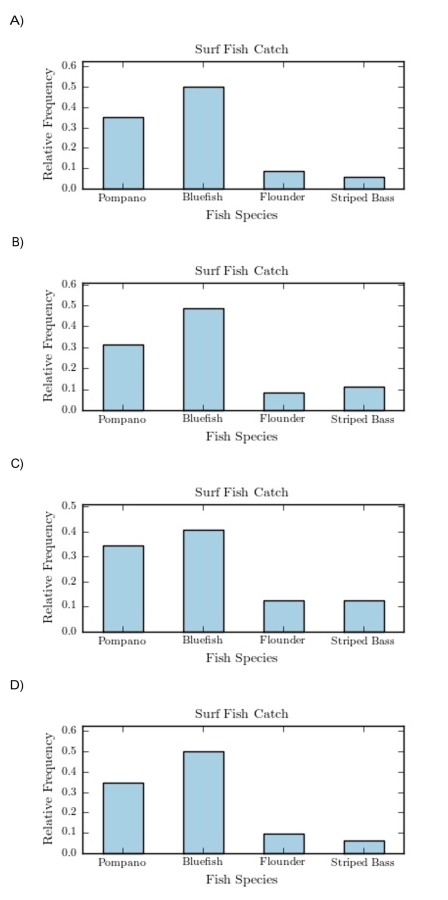

Unlock Deck
Sign up to unlock the cards in this deck!
Unlock Deck
Unlock Deck
1/107
Play
Full screen (f)
Deck 2: Frequency Distributions and Graphs
1
Greg wants to construct a frequency distribution for the political affiliation of the employees at Owen's Hardware Store. What type of distribution would be best?
A) cumulative
B) ungrouped
C) categorical
D) grouped
A) cumulative
B) ungrouped
C) categorical
D) grouped
C
2
For grouped frequency distributions, the is obtained by adding the
lower and upper limits and dividing by 2.
lower and upper limits and dividing by 2.
class midpoint
3
A) class limits overlap
B) a class has been omitted
C) there is no percent column
D) class width is not uniform
A
4
When data are collected in original form, they are called .
Unlock Deck
Unlock for access to all 107 flashcards in this deck.
Unlock Deck
k this deck
5
What is the upper class boundary of the class 23-35 ?
A) 7
B) 7.5
C) 35.5
D) 35
A) 7
B) 7.5
C) 35.5
D) 35
Unlock Deck
Unlock for access to all 107 flashcards in this deck.
Unlock Deck
k this deck
6
Which of the following does not need to be done when constructing a frequency distribution?
A) select the number of classes desired
B) find the range
C) use classes that are mutually exclusive
D) make the class width an even number
A) select the number of classes desired
B) find the range
C) use classes that are mutually exclusive
D) make the class width an even number
Unlock Deck
Unlock for access to all 107 flashcards in this deck.
Unlock Deck
k this deck
7
The lower class limit represents the smallest data value that can be included in the class.
Unlock Deck
Unlock for access to all 107 flashcards in this deck.
Unlock Deck
k this deck
8
A) a class has been omitted
B) class width is not uniform
C) there is no percent column
D) class limits overlap
Unlock Deck
Unlock for access to all 107 flashcards in this deck.
Unlock Deck
k this deck
9
What are the boundaries of the class 11-18?
A) 11 and 18
B) 10.5 and 18.5
C) 7.5 and 21.5
D) 7
A) 11 and 18
B) 10.5 and 18.5
C) 7.5 and 21.5
D) 7
Unlock Deck
Unlock for access to all 107 flashcards in this deck.
Unlock Deck
k this deck
10
For the class 5-19, the upper class limit is
A) 4.5
B) 5
C) 19.5
D) 19
A) 4.5
B) 5
C) 19.5
D) 19
Unlock Deck
Unlock for access to all 107 flashcards in this deck.
Unlock Deck
k this deck
11
A) class limits overlap
B) there is no percent column
C) class width is not uniform
D) a class has been omitted
Unlock Deck
Unlock for access to all 107 flashcards in this deck.
Unlock Deck
k this deck
12
What is the lower class limit of the class 13-17?
A) 15
B) 17
C) 12.5
D) 13
A) 15
B) 17
C) 12.5
D) 13
Unlock Deck
Unlock for access to all 107 flashcards in this deck.
Unlock Deck
k this deck
13
Find the class boundaries, midpoint, and width of the class 28-34?
Unlock Deck
Unlock for access to all 107 flashcards in this deck.
Unlock Deck
k this deck
14
If the limits for a class were 20-38, the boundaries would be 19.5-38.5.
Unlock Deck
Unlock for access to all 107 flashcards in this deck.
Unlock Deck
k this deck
15
What is the midpoint of the class 17-20?
A) 1.5
B) 18
C) 18.5
D) 3
A) 1.5
B) 18
C) 18.5
D) 3
Unlock Deck
Unlock for access to all 107 flashcards in this deck.
Unlock Deck
k this deck
16
Find the class boundaries, midpoint, and width of the class 15.2-18.1?
Unlock Deck
Unlock for access to all 107 flashcards in this deck.
Unlock Deck
k this deck
17
The of a specific class is the number of data values contained in it.
Unlock Deck
Unlock for access to all 107 flashcards in this deck.
Unlock Deck
k this deck
18
What is the midpoint of the class 6-10?
A) 4
B) 8
C) 5
D) 8.5
A) 4
B) 8
C) 5
D) 8.5
Unlock Deck
Unlock for access to all 107 flashcards in this deck.
Unlock Deck
k this deck
19
In an ungrouped frequency distribution of the average age of high school graduates, what would be the boundaries for the class of graduates who were reported to be 18 years old?
A) 17.5-18.5 years old
B) 17.6-19.5 years old
C) 17.6-18.5 years old
D) 17-19 years old
A) 17.5-18.5 years old
B) 17.6-19.5 years old
C) 17.6-18.5 years old
D) 17-19 years old
Unlock Deck
Unlock for access to all 107 flashcards in this deck.
Unlock Deck
k this deck
20
What is the class width?A) 11
B) 80
C) 10
D) 9
Unlock Deck
Unlock for access to all 107 flashcards in this deck.
Unlock Deck
k this deck
21
How many students memorized the number in three trials or less?A) 3
B) 14
C) 87
D) 13
Unlock Deck
Unlock for access to all 107 flashcards in this deck.
Unlock Deck
k this deck
22
Unlock Deck
Unlock for access to all 107 flashcards in this deck.
Unlock Deck
k this deck
23
Unlock Deck
Unlock for access to all 107 flashcards in this deck.
Unlock Deck
k this deck
24
Unlock Deck
Unlock for access to all 107 flashcards in this deck.
Unlock Deck
k this deck
25
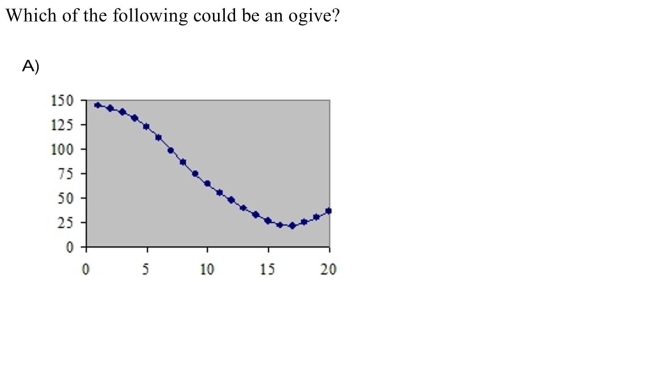
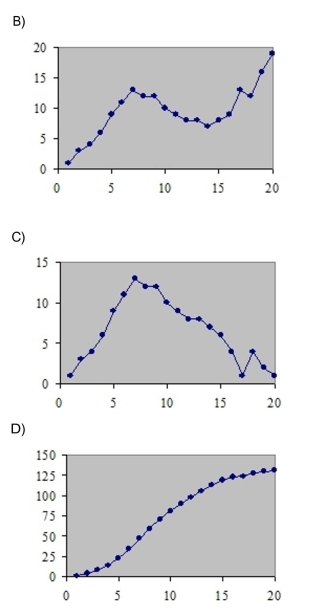
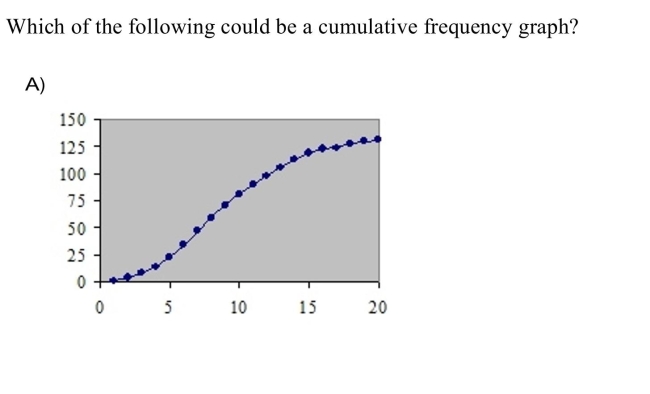
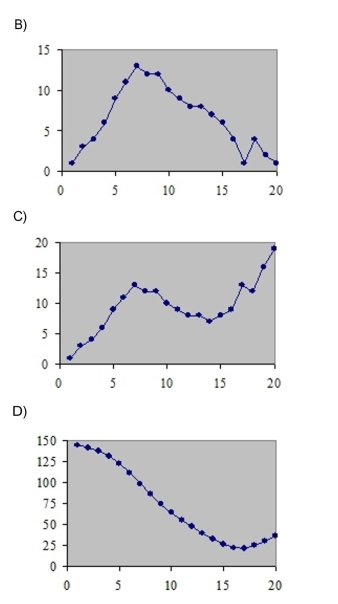
An ogive is also called a cumulative frequency graph.
Unlock Deck
Unlock for access to all 107 flashcards in this deck.
Unlock Deck
k this deck
26
What are the boundaries of the class 1.87-3.43?
A) 1.879-3.439
B) 1.865-3.435
C) 1.82-3.48
D) 1.87-3.43
A) 1.879-3.439
B) 1.865-3.435
C) 1.82-3.48
D) 1.87-3.43
Unlock Deck
Unlock for access to all 107 flashcards in this deck.
Unlock Deck
k this deck
27
nternet. Unlock Deck
Unlock for access to all 107 flashcards in this deck.
Unlock Deck
k this deck
28
The cumulative frequency for a class is the sum of the frequencies of the classes less
than and equal to the upper boundary of the specific class.
than and equal to the upper boundary of the specific class.
Unlock Deck
Unlock for access to all 107 flashcards in this deck.
Unlock Deck
k this deck
29
Unlock Deck
Unlock for access to all 107 flashcards in this deck.
Unlock Deck
k this deck
30
The three most commonly used graphs in research are the histogram, the
, and the cumulative frequency graph (ogive).
, and the cumulative frequency graph (ogive).
Unlock Deck
Unlock for access to all 107 flashcards in this deck.
Unlock Deck
k this deck
31
s What is the relative frequency of the Motorcyle category?A) 0.138
B) 11%
C) 0.058
D) 11
Unlock Deck
Unlock for access to all 107 flashcards in this deck.
Unlock Deck
k this deck
32
For the class 16.3-23.8, the width is 8.5.
Unlock Deck
Unlock for access to all 107 flashcards in this deck.
Unlock Deck
k this deck
33
Unlock Deck
Unlock for access to all 107 flashcards in this deck.
Unlock Deck
k this deck
34
When the range is large, and classes that are several units in width are needed, a
frequency distribution is used.
frequency distribution is used.
Unlock Deck
Unlock for access to all 107 flashcards in this deck.
Unlock Deck
k this deck
35
A) 55-65
B) 85-95
C) 65-75
D) 75-85
Unlock Deck
Unlock for access to all 107 flashcards in this deck.
Unlock Deck
k this deck
36
Unlock Deck
Unlock for access to all 107 flashcards in this deck.
Unlock Deck
k this deck
37
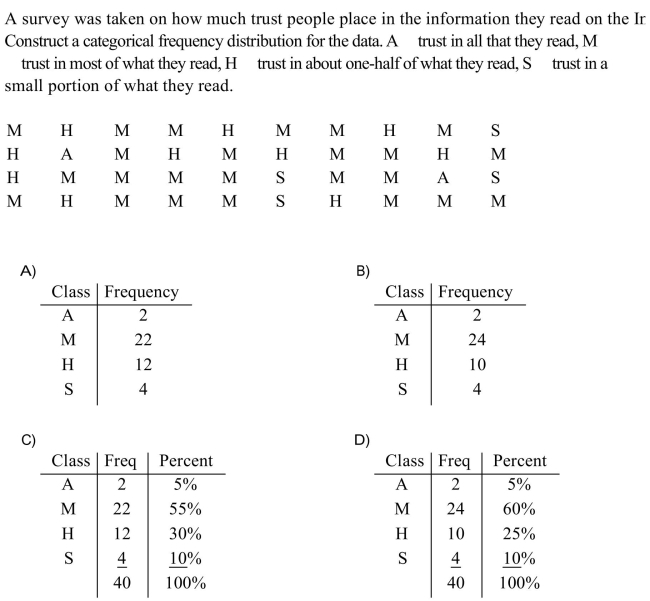
Thirty students recorded the colors of their eyes, choosing from the colors brown, blue, green, hazel, and black. This data can be appropriately summarized in a(n)
)
A) open-ended distribution
B) upper boundary
C) categorical frequency distribution
D) grouped frequency distribution
)
A) open-ended distribution
B) upper boundary
C) categorical frequency distribution
D) grouped frequency distribution
Unlock Deck
Unlock for access to all 107 flashcards in this deck.
Unlock Deck
k this deck
38
What is the lower class limit in the class 8-12?
A) 7.5
B) 8.5
C) 10
D) 8
A) 7.5
B) 8.5
C) 10
D) 8
Unlock Deck
Unlock for access to all 107 flashcards in this deck.
Unlock Deck
k this deck
39
Which of the following pairs of class limits would be appropriate for grouping the numbers 11, 14, 9, and 16?
A) 9-12 and 13-16
B) 9-11 and 14-16
C) 9-11 and 12-16
D) 8-12 and 12-16
A) 9-12 and 13-16
B) 9-11 and 14-16
C) 9-11 and 12-16
D) 8-12 and 12-16
Unlock Deck
Unlock for access to all 107 flashcards in this deck.
Unlock Deck
k this deck
40
A) 65-75
B) 75-85
C) 55-65
D) 85-95
Unlock Deck
Unlock for access to all 107 flashcards in this deck.
Unlock Deck
k this deck
41
Unlock Deck
Unlock for access to all 107 flashcards in this deck.
Unlock Deck
k this deck
42
ic.A) skewed to the left
B) skewed to the right
C) approximately symmetric
Unlock Deck
Unlock for access to all 107 flashcards in this deck.
Unlock Deck
k this deck
43
A) 72
B) 76
C) 6
D) 22
Unlock Deck
Unlock for access to all 107 flashcards in this deck.
Unlock Deck
k this deck
44
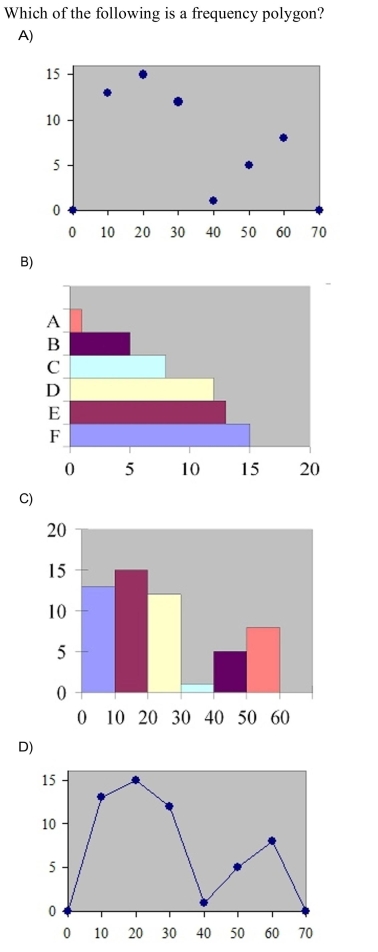
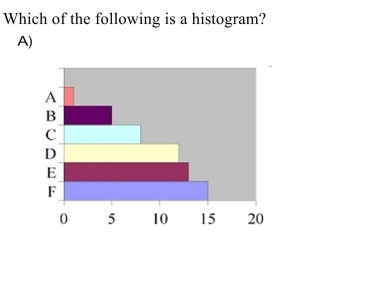
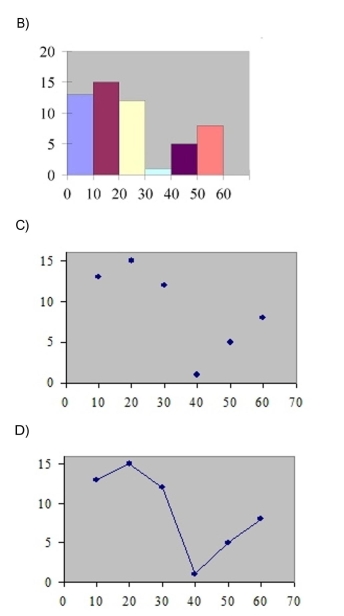
Which type of graph represents the data by using vertical bars of various heights to indicate frequencies?
A) cumulative frequency
B) ogive
C) histogram
D) frequency polygon
A) cumulative frequency
B) ogive
C) histogram
D) frequency polygon
Unlock Deck
Unlock for access to all 107 flashcards in this deck.
Unlock Deck
k this deck
45
Unlock Deck
Unlock for access to all 107 flashcards in this deck.
Unlock Deck
k this deck
46
Construct a frequency histogram. Unlock Deck
Unlock for access to all 107 flashcards in this deck.
Unlock Deck
k this deck
47
A) 13
B) 12
C) 25
D) 44
Unlock Deck
Unlock for access to all 107 flashcards in this deck.
Unlock Deck
k this deck
48
The frequency polygon is a graph that displays the data by using lines that connect points
plotted for the frequencies at the midpoints of the classes.
plotted for the frequencies at the midpoints of the classes.
Unlock Deck
Unlock for access to all 107 flashcards in this deck.
Unlock Deck
k this deck
49
r equalA) 20
B) 30
C) 66
D) 60
Unlock Deck
Unlock for access to all 107 flashcards in this deck.
Unlock Deck
k this deck
50
Unlock Deck
Unlock for access to all 107 flashcards in this deck.
Unlock Deck
k this deck
51
A) unimodal
B) bimodal
Unlock Deck
Unlock for access to all 107 flashcards in this deck.
Unlock Deck
k this deck
52
The frequency polygon and the histogram are two different ways to represent the same
data set.
data set.
Unlock Deck
Unlock for access to all 107 flashcards in this deck.
Unlock Deck
k this deck
53
The following table presents the purchase totals (in dollars) of a random sample of gasoline purchases at a convenience store.
Construct a relative frequency histogram using a class width of 10, and using 0 as the lower class
Limit for the first class.
Construct a relative frequency histogram using a class width of 10, and using 0 as the lower class
Limit for the first class.
Unlock Deck
Unlock for access to all 107 flashcards in this deck.
Unlock Deck
k this deck
54
A histogram is a graph that represents the cumulative frequencies for the classes in a
frequency distribution.
frequency distribution.
Unlock Deck
Unlock for access to all 107 flashcards in this deck.
Unlock Deck
k this deck
55
For a given data set, the ogive and the frequency polygon will have the same overall
shape.
shape.
Unlock Deck
Unlock for access to all 107 flashcards in this deck.
Unlock Deck
k this deck
56
Unlock Deck
Unlock for access to all 107 flashcards in this deck.
Unlock Deck
k this deck
57
Graphs that show distributions using proportions instead of raw data as frequencies are called
A) ogive graphs.
B) relative frequency graphs.
C) frequency polygons.
D) histograms.
A) ogive graphs.
B) relative frequency graphs.
C) frequency polygons.
D) histograms.
Unlock Deck
Unlock for access to all 107 flashcards in this deck.
Unlock Deck
k this deck
58
Unlock Deck
Unlock for access to all 107 flashcards in this deck.
Unlock Deck
k this deck
59
Unlock Deck
Unlock for access to all 107 flashcards in this deck.
Unlock Deck
k this deck
60
If the graph of a frequency distribution has a peak and the data tapers off more
slowly to the right and more quickly to the left, the distribution is said to be
.
slowly to the right and more quickly to the left, the distribution is said to be
.
Unlock Deck
Unlock for access to all 107 flashcards in this deck.
Unlock Deck
k this deck
61
watching Unlock Deck
Unlock for access to all 107 flashcards in this deck.
Unlock Deck
k this deck
62
Unlock Deck
Unlock for access to all 107 flashcards in this deck.
Unlock Deck
k this deck
63
s Unlock Deck
Unlock for access to all 107 flashcards in this deck.
Unlock Deck
k this deck
64
Karen is constructing a pie graph to represent the number of hours her classmates do homework each day. She found that 8 of 24 classmates did homework for three hours
Each day. In her pie graph, this would represent how many degrees?
Each day. In her pie graph, this would represent how many degrees?
Unlock Deck
Unlock for access to all 107 flashcards in this deck.
Unlock Deck
k this deck
65
the Unlock Deck
Unlock for access to all 107 flashcards in this deck.
Unlock Deck
k this deck
66
gories. Unlock Deck
Unlock for access to all 107 flashcards in this deck.
Unlock Deck
k this deck
67
hing Unlock Deck
Unlock for access to all 107 flashcards in this deck.
Unlock Deck
k this deck
68
the Unlock Deck
Unlock for access to all 107 flashcards in this deck.
Unlock Deck
k this deck
69
Unlock Deck
Unlock for access to all 107 flashcards in this deck.
Unlock Deck
k this deck
70
Unlock Deck
Unlock for access to all 107 flashcards in this deck.
Unlock Deck
k this deck
71
variousA) Cereals and baked goods
B) Fruits and vegetables
C) Dairy products
D) Meat poultry, fish, eggs
Unlock Deck
Unlock for access to all 107 flashcards in this deck.
Unlock Deck
k this deck
72
s Unlock Deck
Unlock for access to all 107 flashcards in this deck.
Unlock Deck
k this deck
73
A) 65.4%
B) 47%
C) 60.4%
D) 52.5%
Unlock Deck
Unlock for access to all 107 flashcards in this deck.
Unlock Deck
k this deck
74
Unlock Deck
Unlock for access to all 107 flashcards in this deck.
Unlock Deck
k this deck
75
Unlock Deck
Unlock for access to all 107 flashcards in this deck.
Unlock Deck
k this deck
76
s Unlock Deck
Unlock for access to all 107 flashcards in this deck.
Unlock Deck
k this deck
77
ate Unlock Deck
Unlock for access to all 107 flashcards in this deck.
Unlock Deck
k this deck
78
6h6)ing Unlock Deck
Unlock for access to all 107 flashcards in this deck.
Unlock Deck
k this deck
79
hing Unlock Deck
Unlock for access to all 107 flashcards in this deck.
Unlock Deck
k this deck
80
gories. Unlock Deck
Unlock for access to all 107 flashcards in this deck.
Unlock Deck
k this deck
Unlock Deck
Unlock for access to all 107 flashcards in this deck.


