Deck 7: Confidence Intervals and Sample Size
Full screen (f)
Question
Question
Question
Question

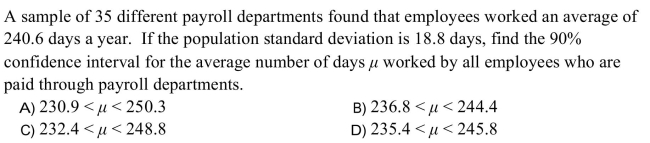
A) 0.60
B) 3.26
C) 0.56
D) 1.18
Question
Question
A) confidence interval
B) maximum error of estimate
C) unbiased estimator
D) interval estimate
Question

A) 3.71
B) 2.58
C) 2.81
D) 2.53
Question
Question
Question
Question
Question
A student looked up the number of years served by 35 of the more than 100 Supreme Court justices. The average number of years served by those 35 justices was 13.8. If the
Standard deviation of the entire population is 7.3 years, find the 95% confidence interval
For the average number of years served by all Supreme Court justices.
Standard deviation of the entire population is 7.3 years, find the 95% confidence interval
For the average number of years served by all Supreme Court justices.
Question
Question
Question
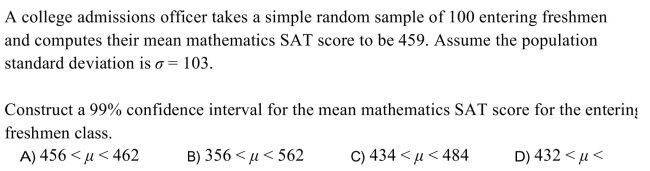
An economics professor randomly selected 100 millionaires in the United States. The average age of these millionaires was 54.8 years. If the standard deviation of the entire
Population of millionaires is 7.9 years, find the 95% confidence interval for the mean age
Of all United States millionaires.
Population of millionaires is 7.9 years, find the 95% confidence interval for the mean age
Of all United States millionaires.
Question
 owing
owingA) (139.7, 148.8)
B) (136.9, 151.6)
C) (124.6, 163.8)
D) (85.4, 203.0
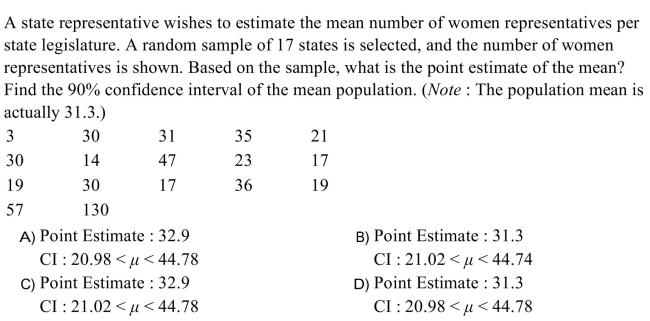
Question

A) 1.25
B) 0.97
C) 0.81
D) 1.98
Question
Question
Question
Question
Question
The three confidence intervals below were constructed from the same sample. One of them was computed at a confidence level of 90%, another at a confidence level of 95%, and another at a
Confidence level of 98%.
Which is the confidence level at 98%?
Confidence level of 98%.
Which is the confidence level at 98%?
Question
A) The likelihood cannot be determined.
B) Yes
C) No
Question

A) 215
B) 118
C) 7
D) 11
Question
Question
Question
A) 117
B) 5
C) 6
D) 34
Question
Question
Question
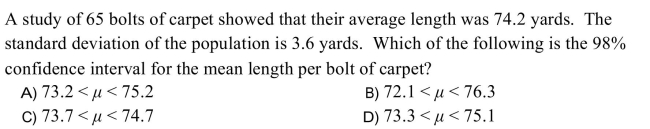
A study of 95 apple trees showed that the average number of apples per tree was 525 The standard deviation of the population is 200. Which of the following is the 80%
Confidence interval for the mean number of apples per tree for all trees?
Confidence interval for the mean number of apples per tree for all trees?
Question
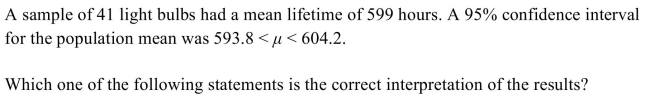
A) None of these are true.
B) The probability that the population mean is between 593.8 hours and 604.2 hours is 0.95.
C) 95% of the light bulbs in the sample had lifetimes between 593.8 hours and 604.2 hours
D) We are 95% confident that the mean lifetime of all the bulbs in the population is between 593.8 hours and 604.2 hours.
Question
A study of 40 white mice showed that their average weight was 3.20 ounces. The standard deviation of the population is 0.8 ounces. Which of the following is the 80%
Confidence interval for the mean weight per white mouse?
Confidence interval for the mean weight per white mouse?
Question
A study of 55 professors showed that the average time they spent creating test questions was 16.5 minutes per question. The standard deviation of the population is 5.8. Which
Of the following is the 99% confidence interval for the average number of minutes it
Takes to create a test question?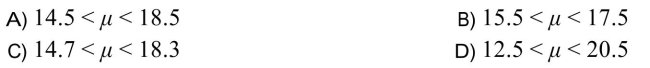
Of the following is the 99% confidence interval for the average number of minutes it
Takes to create a test question?
Question
Question
Question
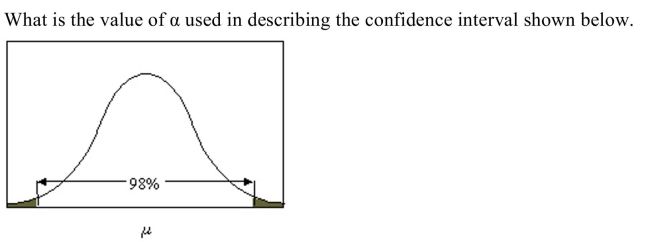
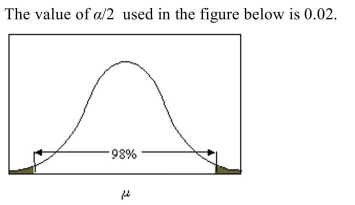
A) 0.05
B) 0.04
C) 0.02
D) 0.01
Question
Question
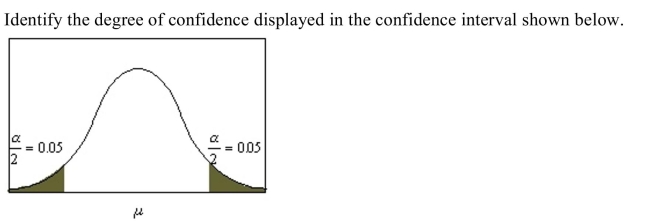
A) 98%
B) 95%
C) 90%
D) 99%
Question
 _ and
_ andA) 95%, 29.856, 39.608
B) 5%, 0, 34.732
C) 95%, 0, 34.732
D) 5%, 29.856, 39.608
Question
Question
Question
 _ and
_ andA) 5%, 0, 49.304
B) 95%, 0, 49.304
C) 5%, 46.915, 51.693
D) 95%, 46.915, 51.693
Question

Question
A) 1.960
B) 2.228
C) 1.812
D) 2.201
Question
Question
Question
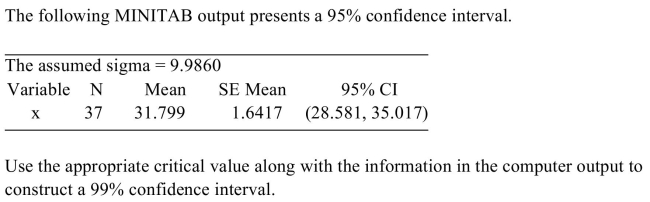
A) (30.461, 33.137)
B) (28.581, 35.017)
C) (27.980, 35.618)
D) (27.570, 36.028)
Question
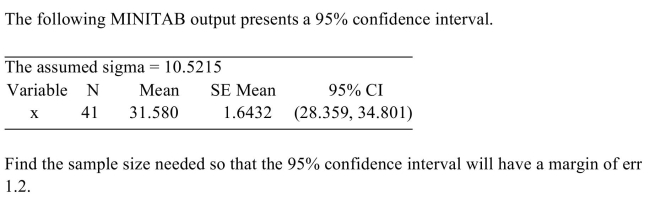 rror of
A) 511
B) 18
C) 416
D) 296
Question

A) 1.721
B) 1.645
C) 1.725
D) 1.325
Question
Question

Question
 rror of
A) 284
B) 15
C) 348
D) 202
Question
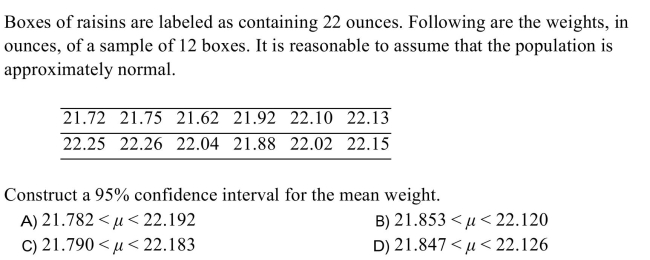
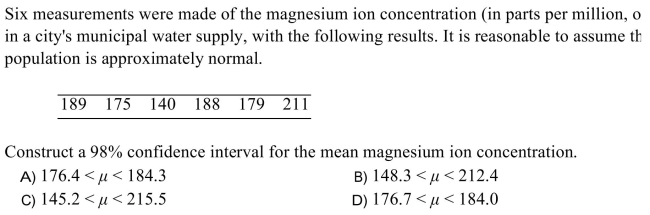
The prices (in dollars) for a graphing calculator are shown below for 8 online vendors. Estimate the true mean price for this particular calculator with 95% confidence.
121 125 151 129
127 133 121 125
121 125 151 129
127 133 121 125
Question
A sample of 125 tobacco smokers who recently completed a new smoking-cessation program were asked to rate the effectiveness of the program on a scale of 1 to 10, with
10 corresponding to "completely effective" and 1 corresponding to "completely
Ineffective". The average rating was 4.1 and the standard deviation was 4.0.
Construct a 95% confidence interval for the mean score.
10 corresponding to "completely effective" and 1 corresponding to "completely
Ineffective". The average rating was 4.1 and the standard deviation was 4.0.
Construct a 95% confidence interval for the mean score.
Question
A food snack manufacturer samples 11 bags of pretzels off the assembly line and weighs their contents. If the sample mean is 15.2 oz. and the sample standard deviation is
0)50 oz., find the 95% confidence interval of the true mean.
0)50 oz., find the 95% confidence interval of the true mean.
Question
 )
)A) The likelihood cannot be determined.
B) No
C) Yes
Question

Question

A) 2.20
B) 1.52
C) 1.80
D) 2.92
Question
Question
 )
) Question
7 squirrels were found to have an average weight of 8.7 ounces with a sample standard deviation is 1.1. Find the 95% confidence interval of the true mean weight. 
Question
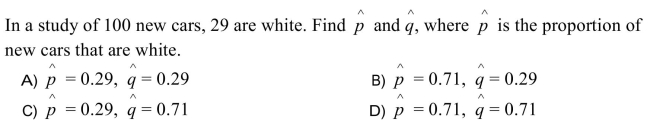
A survey of 800 women shoppers found that 17% of them shop on impulse. What is the 98% confidence interval for the true proportion of women shoppers who shop on
Impulse?
Impulse?
Question
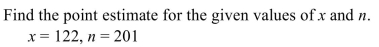
A) 125
B) 0.483
C) 0.031
D) 0.517
Question
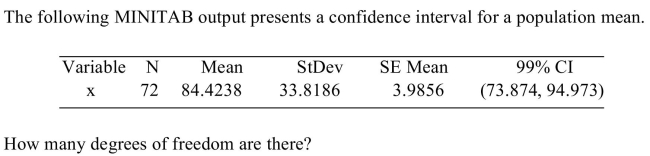
A) 3.9856
B) 72
C) 73
D) 71
Question
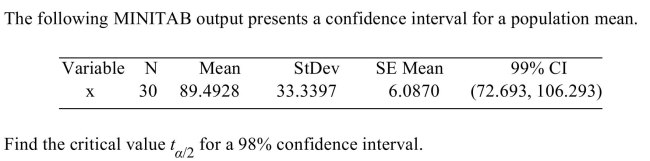
A) 2.462
B) 2.750
C) 2.760
D) 2.457
Question
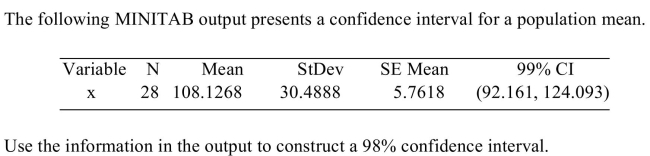
A) (92.161, 124.093)
B) (105.235, 111.018)
C) (93.878, 122.376)
D) (105.546, 110.707)
Question
Question

A) 0.428
B) 0.572
C) r0.036
D) 0.093
Question
Question
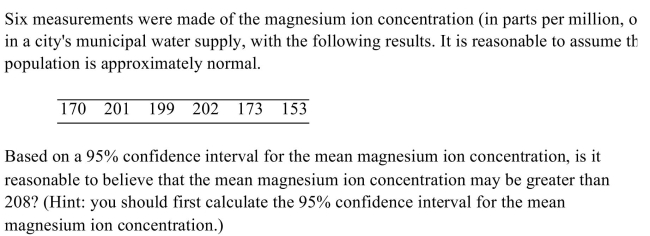
In a survey of 305 registered voters, 130 of them wished to see Mayor Waffleskate lose her next election. Construct a 95% confidence interval for the proportion of registered
Voter who want to see Mayor Waffleskate defeated.
Voter who want to see Mayor Waffleskate defeated.
Question
In a sample of 45 mice, a biologist found that 40% were able to run a maze in 30 seconds or less. Find the 95% limit for the population proportion of mice who can run a maze in
30 seconds or less.
30 seconds or less.
Question
A recent study of 750 internet users in Europe found that 35% of internet users were women. What is the 95% confidence interval of the true proportion of women in Europe
Who use the internet?
Who use the internet?
Question
Question
A random sample of 50 voters found that 46% were going to vote for a certain candidate. Find the 95% limit for the population proportion of voters who will vote for that
Candidate.
Candidate.
Question
A) 0.607
B) 0.034
C) 122
D) 0.393
Question
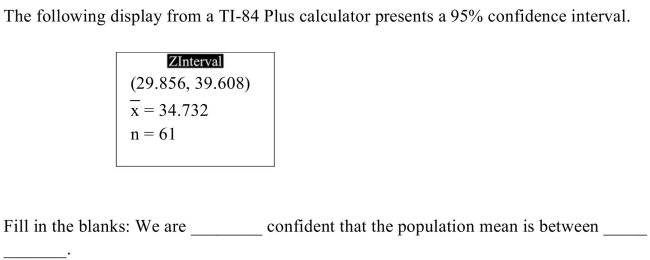
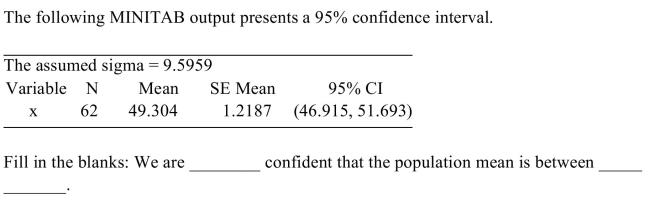
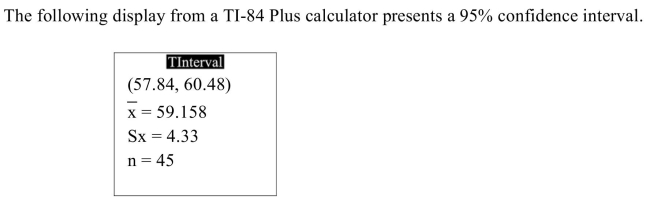 Fill in the blanks: We are ________ confident that the population mean is between _______ and _______.
A) 5%, 57.84, 60.48
B) 95%, 0, 59.158
C) 5%, 0, 59.158
D) 95%, 57.84, 60.48
Question
Question
It was found that in a sample of 90 teenage boys, 70% of them have received speeding tickets. What is the 90% confidence interval of the true proportion of teenage boys who
Have received speeding tickets?
Have received speeding tickets?
Question
Question
The winning team's score in 13 high school basketball games was recorded. If the sample mean is 54.3 points and the sample standard deviation is 13.0 points, find the
98% confidence interval of the true mean.
98% confidence interval of the true mean.

Unlock Deck
Sign up to unlock the cards in this deck!
Unlock Deck
Unlock Deck
1/122
Play
Full screen (f)
Deck 7: Confidence Intervals and Sample Size
1
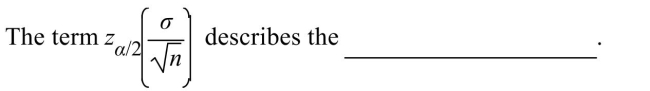
The is the maximum likely difference between the
point estimate of a parameter and the actual value of the parameter.
point estimate of a parameter and the actual value of the parameter.
maximum error of estimate
2
A
3
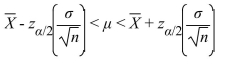
The formula for the confidence interval of the mean for a specific is
.
.
4
A) 0.60
B) 3.26
C) 0.56
D) 1.18
Unlock Deck
Unlock for access to all 122 flashcards in this deck.
Unlock Deck
k this deck
5
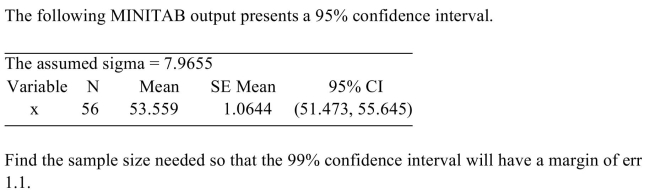
When computing a confidence interval for a population mean using raw data, round off
to two more decimal places than the number of decimal places in the original data.
to two more decimal places than the number of decimal places in the original data.
Unlock Deck
Unlock for access to all 122 flashcards in this deck.
Unlock Deck
k this deck
6
A) confidence interval
B) maximum error of estimate
C) unbiased estimator
D) interval estimate
Unlock Deck
Unlock for access to all 122 flashcards in this deck.
Unlock Deck
k this deck
7
A) 3.71
B) 2.58
C) 2.81
D) 2.53
Unlock Deck
Unlock for access to all 122 flashcards in this deck.
Unlock Deck
k this deck
8
An interval estimate may or may not contain the true value of the parameter being
estimated.
estimated.
Unlock Deck
Unlock for access to all 122 flashcards in this deck.
Unlock Deck
k this deck
9
Unlock Deck
Unlock for access to all 122 flashcards in this deck.
Unlock Deck
k this deck
10
Unlock Deck
Unlock for access to all 122 flashcards in this deck.
Unlock Deck
k this deck
11
Unlock Deck
Unlock for access to all 122 flashcards in this deck.
Unlock Deck
k this deck
12
A student looked up the number of years served by 35 of the more than 100 Supreme Court justices. The average number of years served by those 35 justices was 13.8. If the
Standard deviation of the entire population is 7.3 years, find the 95% confidence interval
For the average number of years served by all Supreme Court justices.
Standard deviation of the entire population is 7.3 years, find the 95% confidence interval
For the average number of years served by all Supreme Court justices.
Unlock Deck
Unlock for access to all 122 flashcards in this deck.
Unlock Deck
k this deck
13
The average number of mosquitos caught in 64 mosquito traps in a particular
environment was 700 per trap. The standard deviation of mosquitos caught in the
entire population of traps is 100 mosquitos. What is the 99% confidence interval
for the true mean number of mosquitos caught in all mosquito traps?
environment was 700 per trap. The standard deviation of mosquitos caught in the
entire population of traps is 100 mosquitos. What is the 99% confidence interval
for the true mean number of mosquitos caught in all mosquito traps?
Unlock Deck
Unlock for access to all 122 flashcards in this deck.
Unlock Deck
k this deck
14
Unlock Deck
Unlock for access to all 122 flashcards in this deck.
Unlock Deck
k this deck
15
An economics professor randomly selected 100 millionaires in the United States. The average age of these millionaires was 54.8 years. If the standard deviation of the entire
Population of millionaires is 7.9 years, find the 95% confidence interval for the mean age
Of all United States millionaires.
Population of millionaires is 7.9 years, find the 95% confidence interval for the mean age
Of all United States millionaires.
Unlock Deck
Unlock for access to all 122 flashcards in this deck.
Unlock Deck
k this deck
16
owingA) (139.7, 148.8)
B) (136.9, 151.6)
C) (124.6, 163.8)
D) (85.4, 203.0
Unlock Deck
Unlock for access to all 122 flashcards in this deck.
Unlock Deck
k this deck
17
A) 1.25
B) 0.97
C) 0.81
D) 1.98
Unlock Deck
Unlock for access to all 122 flashcards in this deck.
Unlock Deck
k this deck
18
According to a study of 90 truckers, a trucker drives, on average, 540 miles per
day. If the standard deviation of the miles driven per day for the population of
truckers is 40, find the 99% confidence interval of the mean number of miles
driven per day by all truckers.
day. If the standard deviation of the miles driven per day for the population of
truckers is 40, find the 99% confidence interval of the mean number of miles
driven per day by all truckers.
Unlock Deck
Unlock for access to all 122 flashcards in this deck.
Unlock Deck
k this deck
19
Find the level of the confidence interval that has the given critical value. 2.16
A) 98.46%
B) 96.92%
C) 3.08%
D) 1.54%
A) 98.46%
B) 96.92%
C) 3.08%
D) 1.54%
Unlock Deck
Unlock for access to all 122 flashcards in this deck.
Unlock Deck
k this deck
20
The confidence level of an interval estimate of a parameter is the probability that the
interval estimate will contain the parameter.
interval estimate will contain the parameter.
Unlock Deck
Unlock for access to all 122 flashcards in this deck.
Unlock Deck
k this deck
21
A previous analysis of paper boxes showed that the the standard deviation of their lengths is 13 millimeters. A packer wishes to find the 95% confidence interval for the
Average length of a box. How many boxes does he need to measure to be accurate within
4 millimeters?
A) 29
B) 58
C) 41
D) 11
Average length of a box. How many boxes does he need to measure to be accurate within
4 millimeters?
A) 29
B) 58
C) 41
D) 11
Unlock Deck
Unlock for access to all 122 flashcards in this deck.
Unlock Deck
k this deck
22
The three confidence intervals below were constructed from the same sample. One of them was computed at a confidence level of 90%, another at a confidence level of 95%, and another at a
Confidence level of 98%.
Which is the confidence level at 98%?
Confidence level of 98%.
Which is the confidence level at 98%?
Unlock Deck
Unlock for access to all 122 flashcards in this deck.
Unlock Deck
k this deck
23
A) The likelihood cannot be determined.
B) Yes
C) No
Unlock Deck
Unlock for access to all 122 flashcards in this deck.
Unlock Deck
k this deck
24
A) 215
B) 118
C) 7
D) 11
Unlock Deck
Unlock for access to all 122 flashcards in this deck.
Unlock Deck
k this deck
25
A study of nickels showed that the the standard deviation of the weight of nickels is milligrams. A coin counter manufacturer wishes to find the 95% confidence interval for
The average weight of a nickel. How many nickels does he need to weigh to obtain an
Average accurate to within 20 milligrams?
A) 154
B) 57
C) 217
D) 306
The average weight of a nickel. How many nickels does he need to weigh to obtain an
Average accurate to within 20 milligrams?
A) 154
B) 57
C) 217
D) 306
Unlock Deck
Unlock for access to all 122 flashcards in this deck.
Unlock Deck
k this deck
26
Unlock Deck
Unlock for access to all 122 flashcards in this deck.
Unlock Deck
k this deck
27
A) 117
B) 5
C) 6
D) 34
Unlock Deck
Unlock for access to all 122 flashcards in this deck.
Unlock Deck
k this deck
28
A study of elephants is conducted to determine the average weight of a certain subspecies of elephants. The standard deviation for the population is 500 pounds. At a
90% level, how many elephants need to be weighed so the average weight will be
Accurate to within 250 pounds?
A) 16
B) 11
C) 13
D) 36
90% level, how many elephants need to be weighed so the average weight will be
Accurate to within 250 pounds?
A) 16
B) 11
C) 13
D) 36
Unlock Deck
Unlock for access to all 122 flashcards in this deck.
Unlock Deck
k this deck
29
A researcher conducted a study of the access speed of 45 hard drives and concluded that his maximum error of estimate was 24. If he were to conduct a second study to reduce
The maximum error of estimate to 6, about how many hard drives should he include in his
New sample?
A) 720
B) 90
C) 45
D) 180
The maximum error of estimate to 6, about how many hard drives should he include in his
New sample?
A) 720
B) 90
C) 45
D) 180
Unlock Deck
Unlock for access to all 122 flashcards in this deck.
Unlock Deck
k this deck
30
A study of 95 apple trees showed that the average number of apples per tree was 525 The standard deviation of the population is 200. Which of the following is the 80%
Confidence interval for the mean number of apples per tree for all trees?
Confidence interval for the mean number of apples per tree for all trees?
Unlock Deck
Unlock for access to all 122 flashcards in this deck.
Unlock Deck
k this deck
31
A) None of these are true.
B) The probability that the population mean is between 593.8 hours and 604.2 hours is 0.95.
C) 95% of the light bulbs in the sample had lifetimes between 593.8 hours and 604.2 hours
D) We are 95% confident that the mean lifetime of all the bulbs in the population is between 593.8 hours and 604.2 hours.
Unlock Deck
Unlock for access to all 122 flashcards in this deck.
Unlock Deck
k this deck
32
A study of 40 white mice showed that their average weight was 3.20 ounces. The standard deviation of the population is 0.8 ounces. Which of the following is the 80%
Confidence interval for the mean weight per white mouse?
Confidence interval for the mean weight per white mouse?
Unlock Deck
Unlock for access to all 122 flashcards in this deck.
Unlock Deck
k this deck
33
A study of 55 professors showed that the average time they spent creating test questions was 16.5 minutes per question. The standard deviation of the population is 5.8. Which
Of the following is the 99% confidence interval for the average number of minutes it
Takes to create a test question?
Of the following is the 99% confidence interval for the average number of minutes it
Takes to create a test question?
Unlock Deck
Unlock for access to all 122 flashcards in this deck.
Unlock Deck
k this deck
34
Unlock Deck
Unlock for access to all 122 flashcards in this deck.
Unlock Deck
k this deck
35
If a population has a standard deviation of 14, what is the minimum number of samples that need to be averaged in order to be 95% confident that the average of the means is
Within 5 of the true mean?
A) 61
B) 12
C) 31
D) 6
Within 5 of the true mean?
A) 61
B) 12
C) 31
D) 6
Unlock Deck
Unlock for access to all 122 flashcards in this deck.
Unlock Deck
k this deck
36
A) 0.05
B) 0.04
C) 0.02
D) 0.01
Unlock Deck
Unlock for access to all 122 flashcards in this deck.
Unlock Deck
k this deck
37
A study of peach trees found that the average number of peaches per tree was 1025. The standard deviation of the population is 35 peaches per tree. A scientist wishes to find the
99% confidence interval for the mean number of peaches per tree. How many trees does
She need to sample to obtain an average accurate to within 18 peaches per tree?
A) 23
B) 26
C) 21
D) 4
99% confidence interval for the mean number of peaches per tree. How many trees does
She need to sample to obtain an average accurate to within 18 peaches per tree?
A) 23
B) 26
C) 21
D) 4
Unlock Deck
Unlock for access to all 122 flashcards in this deck.
Unlock Deck
k this deck
38
A) 98%
B) 95%
C) 90%
D) 99%
Unlock Deck
Unlock for access to all 122 flashcards in this deck.
Unlock Deck
k this deck
39
_ andA) 95%, 29.856, 39.608
B) 5%, 0, 34.732
C) 95%, 0, 34.732
D) 5%, 29.856, 39.608
Unlock Deck
Unlock for access to all 122 flashcards in this deck.
Unlock Deck
k this deck
40
Jennifer wants to find a 95% confidence interval for the time it takes her to get to work.
She kept records for 30 days and found her average time to commute to work was 20.5
minutes with a standard deviation for the population of 3.9 minutes. Jennifer's margin of
error would be 1.4 minutes.
She kept records for 30 days and found her average time to commute to work was 20.5
minutes with a standard deviation for the population of 3.9 minutes. Jennifer's margin of
error would be 1.4 minutes.
Unlock Deck
Unlock for access to all 122 flashcards in this deck.
Unlock Deck
k this deck
41
The are the number of values that are free to vary after a
sample statistic has been computed.
sample statistic has been computed.
Unlock Deck
Unlock for access to all 122 flashcards in this deck.
Unlock Deck
k this deck
42
_ andA) 5%, 0, 49.304
B) 95%, 0, 49.304
C) 5%, 46.915, 51.693
D) 95%, 46.915, 51.693
Unlock Deck
Unlock for access to all 122 flashcards in this deck.
Unlock Deck
k this deck
43
Unlock Deck
Unlock for access to all 122 flashcards in this deck.
Unlock Deck
k this deck
44
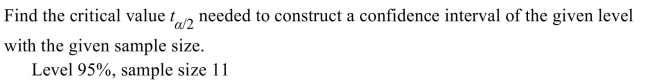
A) 1.960
B) 2.228
C) 1.812
D) 2.201
Unlock Deck
Unlock for access to all 122 flashcards in this deck.
Unlock Deck
k this deck
45
Unlock Deck
Unlock for access to all 122 flashcards in this deck.
Unlock Deck
k this deck
46
Unlock Deck
Unlock for access to all 122 flashcards in this deck.
Unlock Deck
k this deck
47
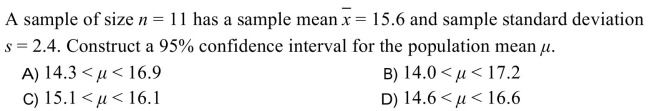
A) (30.461, 33.137)
B) (28.581, 35.017)
C) (27.980, 35.618)
D) (27.570, 36.028)
Unlock Deck
Unlock for access to all 122 flashcards in this deck.
Unlock Deck
k this deck
48
rror ofA) 511
B) 18
C) 416
D) 296
Unlock Deck
Unlock for access to all 122 flashcards in this deck.
Unlock Deck
k this deck
49
A) 1.721
B) 1.645
C) 1.725
D) 1.325
Unlock Deck
Unlock for access to all 122 flashcards in this deck.
Unlock Deck
k this deck
50
Unlock Deck
Unlock for access to all 122 flashcards in this deck.
Unlock Deck
k this deck
51
Unlock Deck
Unlock for access to all 122 flashcards in this deck.
Unlock Deck
k this deck
52
rror ofA) 284
B) 15
C) 348
D) 202
Unlock Deck
Unlock for access to all 122 flashcards in this deck.
Unlock Deck
k this deck
53
The prices (in dollars) for a graphing calculator are shown below for 8 online vendors. Estimate the true mean price for this particular calculator with 95% confidence.
121 125 151 129
127 133 121 125
121 125 151 129
127 133 121 125
Unlock Deck
Unlock for access to all 122 flashcards in this deck.
Unlock Deck
k this deck
54
A sample of 125 tobacco smokers who recently completed a new smoking-cessation program were asked to rate the effectiveness of the program on a scale of 1 to 10, with
10 corresponding to "completely effective" and 1 corresponding to "completely
Ineffective". The average rating was 4.1 and the standard deviation was 4.0.
Construct a 95% confidence interval for the mean score.
10 corresponding to "completely effective" and 1 corresponding to "completely
Ineffective". The average rating was 4.1 and the standard deviation was 4.0.
Construct a 95% confidence interval for the mean score.
Unlock Deck
Unlock for access to all 122 flashcards in this deck.
Unlock Deck
k this deck
55
A food snack manufacturer samples 11 bags of pretzels off the assembly line and weighs their contents. If the sample mean is 15.2 oz. and the sample standard deviation is
0)50 oz., find the 95% confidence interval of the true mean.
0)50 oz., find the 95% confidence interval of the true mean.
Unlock Deck
Unlock for access to all 122 flashcards in this deck.
Unlock Deck
k this deck
56
)A) The likelihood cannot be determined.
B) No
C) Yes
Unlock Deck
Unlock for access to all 122 flashcards in this deck.
Unlock Deck
k this deck
57
Unlock Deck
Unlock for access to all 122 flashcards in this deck.
Unlock Deck
k this deck
58
A) 2.20
B) 1.52
C) 1.80
D) 2.92
Unlock Deck
Unlock for access to all 122 flashcards in this deck.
Unlock Deck
k this deck
59
In a study using 8 samples, and in which the population variance is unknown, the distribution that should be used to calculate confidence intervals is
A) a t distribution with 9 degrees of freedom.
B) a t distribution with 7 degrees of freedom.
C) a standard normal distribution.
D) a t distribution with 8 degrees of freedom.
A) a t distribution with 9 degrees of freedom.
B) a t distribution with 7 degrees of freedom.
C) a standard normal distribution.
D) a t distribution with 8 degrees of freedom.
Unlock Deck
Unlock for access to all 122 flashcards in this deck.
Unlock Deck
k this deck
60
) Unlock Deck
Unlock for access to all 122 flashcards in this deck.
Unlock Deck
k this deck
61
7 squirrels were found to have an average weight of 8.7 ounces with a sample standard deviation is 1.1. Find the 95% confidence interval of the true mean weight.
Unlock Deck
Unlock for access to all 122 flashcards in this deck.
Unlock Deck
k this deck
62
A survey of 800 women shoppers found that 17% of them shop on impulse. What is the 98% confidence interval for the true proportion of women shoppers who shop on
Impulse?
Impulse?
Unlock Deck
Unlock for access to all 122 flashcards in this deck.
Unlock Deck
k this deck
63
A) 125
B) 0.483
C) 0.031
D) 0.517
Unlock Deck
Unlock for access to all 122 flashcards in this deck.
Unlock Deck
k this deck
64
A) 3.9856
B) 72
C) 73
D) 71
Unlock Deck
Unlock for access to all 122 flashcards in this deck.
Unlock Deck
k this deck
65
A) 2.462
B) 2.750
C) 2.760
D) 2.457
Unlock Deck
Unlock for access to all 122 flashcards in this deck.
Unlock Deck
k this deck
66
A) (92.161, 124.093)
B) (105.235, 111.018)
C) (93.878, 122.376)
D) (105.546, 110.707)
Unlock Deck
Unlock for access to all 122 flashcards in this deck.
Unlock Deck
k this deck
67
In a survey of 246 registered voters, 132 of them wished to see Mayor Waffleskate lose her next election. Find a point estimate for the proportion of registered voters who wish
To see Mayor Waffleskate defeated.
A) 0.463
B) 132
C) 0.032
D) 0.537
To see Mayor Waffleskate defeated.
A) 0.463
B) 132
C) 0.032
D) 0.537
Unlock Deck
Unlock for access to all 122 flashcards in this deck.
Unlock Deck
k this deck
68
A) 0.428
B) 0.572
C) r0.036
D) 0.093
Unlock Deck
Unlock for access to all 122 flashcards in this deck.
Unlock Deck
k this deck
69
A sample of 400 racing cars showed that 80 of them cost over $700,000. What is
the 99% confidence interval for the true proportion of racing cars that cost over
$700,000?
the 99% confidence interval for the true proportion of racing cars that cost over
$700,000?
Unlock Deck
Unlock for access to all 122 flashcards in this deck.
Unlock Deck
k this deck
70
In a survey of 305 registered voters, 130 of them wished to see Mayor Waffleskate lose her next election. Construct a 95% confidence interval for the proportion of registered
Voter who want to see Mayor Waffleskate defeated.
Voter who want to see Mayor Waffleskate defeated.
Unlock Deck
Unlock for access to all 122 flashcards in this deck.
Unlock Deck
k this deck
71
In a sample of 45 mice, a biologist found that 40% were able to run a maze in 30 seconds or less. Find the 95% limit for the population proportion of mice who can run a maze in
30 seconds or less.
30 seconds or less.
Unlock Deck
Unlock for access to all 122 flashcards in this deck.
Unlock Deck
k this deck
72
A recent study of 750 internet users in Europe found that 35% of internet users were women. What is the 95% confidence interval of the true proportion of women in Europe
Who use the internet?
Who use the internet?
Unlock Deck
Unlock for access to all 122 flashcards in this deck.
Unlock Deck
k this deck
73
Unlock Deck
Unlock for access to all 122 flashcards in this deck.
Unlock Deck
k this deck
74
A random sample of 50 voters found that 46% were going to vote for a certain candidate. Find the 95% limit for the population proportion of voters who will vote for that
Candidate.
Candidate.
Unlock Deck
Unlock for access to all 122 flashcards in this deck.
Unlock Deck
k this deck
75
A) 0.607
B) 0.034
C) 122
D) 0.393
Unlock Deck
Unlock for access to all 122 flashcards in this deck.
Unlock Deck
k this deck
76
Fill in the blanks: We are ________ confident that the population mean is between _______ and _______.A) 5%, 57.84, 60.48
B) 95%, 0, 59.158
C) 5%, 0, 59.158
D) 95%, 57.84, 60.48
Unlock Deck
Unlock for access to all 122 flashcards in this deck.
Unlock Deck
k this deck
77
Unlock Deck
Unlock for access to all 122 flashcards in this deck.
Unlock Deck
k this deck
78
It was found that in a sample of 90 teenage boys, 70% of them have received speeding tickets. What is the 90% confidence interval of the true proportion of teenage boys who
Have received speeding tickets?
Have received speeding tickets?
Unlock Deck
Unlock for access to all 122 flashcards in this deck.
Unlock Deck
k this deck
79
In a survey of 445 registered voters, 131 of them wished to see Mayor Waffleskate lose her next election. The Waffleskate campaign claims that no more than 30% of registered
Voters wish to see her defeated. Does the 98% confidence interval for the proportion
Support this claim? (Hint: you should first construct the 98% confidence interval for the
Proportion of registered voters who whish to see Waffleskate defeated.)
(0)244, 0.345)
A) Yes
B) No
C) The reasonableness of the claim cannot be determined.
Unlock Deck
Unlock for access to all 122 flashcards in this deck.
Unlock Deck
k this deck
80
The winning team's score in 13 high school basketball games was recorded. If the sample mean is 54.3 points and the sample standard deviation is 13.0 points, find the
98% confidence interval of the true mean.
98% confidence interval of the true mean.
Unlock Deck
Unlock for access to all 122 flashcards in this deck.
Unlock Deck
k this deck
Unlock Deck
Unlock for access to all 122 flashcards in this deck.


