Deck 15: Inferential Methods in Regression and Correlation
Full screen (f)
Question
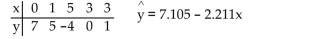
Construct a normal probability plot of the residuals for the given regression data.
Applicants for a particular job, which involves extensive travel in Spanish speaking
countries, must take a proficiency test in Spanish. The sample data below were obtained in
a study of the relationship between the numbers of years applicants have studied Spanish
(x)and their score on the test (y).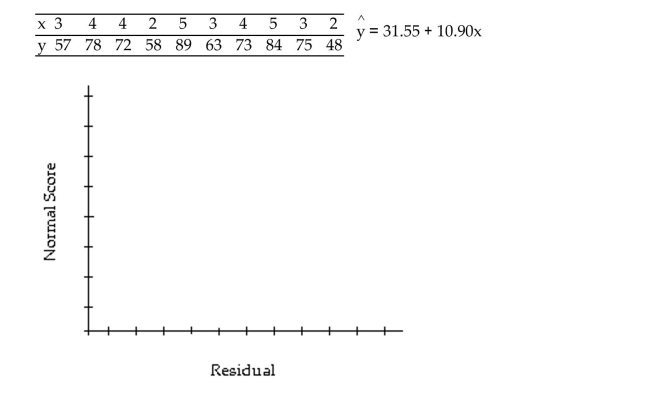
Question
Question
Perform the required correlation test. You may presume that the assumptions for regression inferences are met.
Ten students in a graduate program were randomly selected. Their grade point averages
(GPAs)when they entered the program were between 3.5 and 4.0. The following data
consist of the students' GPAs (x)on entering the program and their current GPAs (y).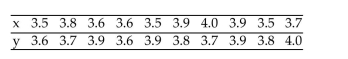 The sample linear correlation coefficient is r = 0.043. At the 5% significance level, do the
data provide sufficient evidence to conclude that entering GPA and current GPA are
linearly correlated?
Ten students in a graduate program were randomly selected. Their grade point averages
(GPAs)when they entered the program were between 3.5 and 4.0. The following data
consist of the students' GPAs (x)on entering the program and their current GPAs (y).
The sample linear correlation coefficient is r = 0.043. At the 5% significance level, do thedata provide sufficient evidence to conclude that entering GPA and current GPA are
linearly correlated?
Question
Question
Question
Decide, at the given significance level, whether the data provide sufficient evidence to conclude that x is useful forpredicting y.
Decide, at the 10% significance level, whether the data provide sufficient evidence to
conclude that x is a useful predictor of y.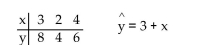
Decide, at the 10% significance level, whether the data provide sufficient evidence to
conclude that x is a useful predictor of y.
Question
Provide an appropriate response.
The heights (in inches)of a random sample of students from one college are as follows. At the 1% significance level, do the data provide sufficient evidence to conclude that
heights of students at this college are not normally distributed?
The heights (in inches)of a random sample of students from one college are as follows.
At the 1% significance level, do the data provide sufficient evidence to conclude thatheights of students at this college are not normally distributed?
Question
Perform the required correlation test. You may presume that the assumptions for regression inferences are met.
The sample data below are the index of exposure (x)to radioactive waste for nine different
Oregon counties and cancer mortality rate (y)(deaths per 100,000).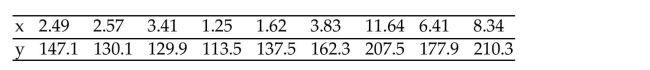 The sample linear correlation coefficient is r = 0.926. At the 5% significance level, do the
data provide sufficient evidence to conclude that index of exposure and cancer mortality
rate are linearly correlated?
The sample data below are the index of exposure (x)to radioactive waste for nine different
Oregon counties and cancer mortality rate (y)(deaths per 100,000).
The sample linear correlation coefficient is r = 0.926. At the 5% significance level, do thedata provide sufficient evidence to conclude that index of exposure and cancer mortality
rate are linearly correlated?
Question
Perform the required correlation test for normality.
At one bank, twelve customers were selected at random as they entered the bank and
asked to record how long they spent waiting in line. The times (in minutes)were as
follows.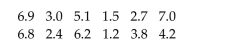 At the 5% significance level, do the data provide sufficient evidence to conclude that
waiting times of customers at this bank are not normally distributed?
At one bank, twelve customers were selected at random as they entered the bank and
asked to record how long they spent waiting in line. The times (in minutes)were as
follows.
At the 5% significance level, do the data provide sufficient evidence to conclude thatwaiting times of customers at this bank are not normally distributed?
Question
Question
Question
Perform the required correlation test for normality.
Twelve students were selected at random from a college class and were asked how many
hours they had studied for a particular test. The results are as follows. At the 5% significance level, do the data provide sufficient evidence to conclude that study
times of students in this class are not normally distributed?
Twelve students were selected at random from a college class and were asked how many
hours they had studied for a particular test. The results are as follows.
At the 5% significance level, do the data provide sufficient evidence to conclude that studytimes of students in this class are not normally distributed?
Question
Question
Question
Perform the required correlation test. You may presume that the assumptions for regression inferences are met.
Applicants for a particular job, which involves extensive travel in Spanish speaking
countries, must take a proficiency test in Spanish. The sample data below were obtained in
a study of the relationship between the numbers of years applicants have studied Spanish
(x)and their score on the test (y).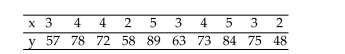 The sample linear correlation coefficient is r = 0.911. At the 5% significance level, do the
data provide sufficient evidence to conclude that number of years of study and test score
are positively linearly correlated?
Applicants for a particular job, which involves extensive travel in Spanish speaking
countries, must take a proficiency test in Spanish. The sample data below were obtained in
a study of the relationship between the numbers of years applicants have studied Spanish
(x)and their score on the test (y).
The sample linear correlation coefficient is r = 0.911. At the 5% significance level, do thedata provide sufficient evidence to conclude that number of years of study and test score
are positively linearly correlated?
Question
Question
Perform the required correlation test for normality.
The data below represent the weekly salaries (in dollars)of ten employees selected
randomly from a particular company.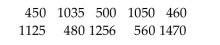 At the 10% significance level, do the data provide sufficient evidence to conclude that
weekly salaries of employees at this company are not normally distributed?
The data below represent the weekly salaries (in dollars)of ten employees selected
randomly from a particular company.
At the 10% significance level, do the data provide sufficient evidence to conclude thatweekly salaries of employees at this company are not normally distributed?
Question
Paired sample data is given. Discuss what it would mean for Assumptions 1-3 for regression inferences to be satisfied bythe variables under consideration.
A social scientist is interested in the relationship between age and income in adults aged
20-60. A random sample of eight adults yields the following data, where x denotes age in
years and y denotes annual income in thousands of dollars.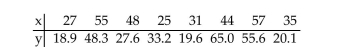
A social scientist is interested in the relationship between age and income in adults aged
20-60. A random sample of eight adults yields the following data, where x denotes age in
years and y denotes annual income in thousands of dollars.
Question
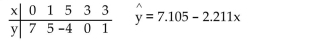
Construct a residual plot for the given data.
Question
Decide, at the given significance level, whether the data provide sufficient evidence to conclude that x is useful forpredicting y.
Applicants for a particular job, which involves extensive travel in Spanish speaking
countries, must take a proficiency test in Spanish. The sample data below were obtained in
a study of the relationship between the numbers of years applicants have studied Spanish
(x)and their score on the test (y).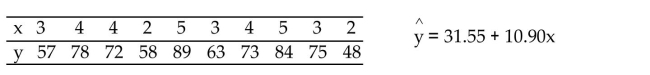 The standard error of the estimate is approximately 5.651. At the 5% level of significance,
do the data provide sufficient evidence to conclude that the slope of the population
regression line is not 0 and hence that number of years of study is useful as a predictor of
score on the test?
Applicants for a particular job, which involves extensive travel in Spanish speaking
countries, must take a proficiency test in Spanish. The sample data below were obtained in
a study of the relationship between the numbers of years applicants have studied Spanish
(x)and their score on the test (y).
The standard error of the estimate is approximately 5.651. At the 5% level of significance,do the data provide sufficient evidence to conclude that the slope of the population
regression line is not 0 and hence that number of years of study is useful as a predictor of
score on the test?
Question
Question
Decide, at the given significance level, whether the data provide sufficient evidence to conclude that x is useful forpredicting y.
The sample data below are the index of exposure (x)to radioactive waste for nine different
Oregon counties and cancer mortality rate (y)(deaths per 100,000).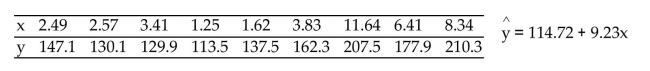 The standard error of the estimate is approximately 14.0099. At the 5% level of
significance, do the data provide sufficient evidence to conclude that the slope of the
population regression line is not 0 and hence that index of exposure is useful as a predictor
of cancer mortality rate?
The sample data below are the index of exposure (x)to radioactive waste for nine different
Oregon counties and cancer mortality rate (y)(deaths per 100,000).
The standard error of the estimate is approximately 14.0099. At the 5% level ofsignificance, do the data provide sufficient evidence to conclude that the slope of the
population regression line is not 0 and hence that index of exposure is useful as a predictor
of cancer mortality rate?
Question
Provide an appropriate response.
Applicants for a particular job, which involves extensive travel in Spanish speaking
countries, must take a proficiency test in Spanish. The sample data below were obtained in
a study of the relationship between the numbers of years applicants have studied Spanish
(x)and their score on the test (y). A 99% confidence interval for the slope of the population regression line that relates test
score to number of years of study is 5.05 to 16.75. Provide an interpretation of this
confidence interval.
Applicants for a particular job, which involves extensive travel in Spanish speaking
countries, must take a proficiency test in Spanish. The sample data below were obtained in
a study of the relationship between the numbers of years applicants have studied Spanish
(x)and their score on the test (y).
A 99% confidence interval for the slope of the population regression line that relates testscore to number of years of study is 5.05 to 16.75. Provide an interpretation of this
confidence interval.
Question
Decide, at the given significance level, whether the data provide sufficient evidence to conclude that x is useful forpredicting y.
Decide, at the 10% significance level, whether the data provide sufficient evidence to
conclude that x is a useful predictor of y.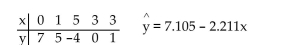
Decide, at the 10% significance level, whether the data provide sufficient evidence to
conclude that x is a useful predictor of y.
Question
Provide an appropriate response.

Question
Decide, at the given significance level, whether the data provide sufficient evidence to conclude that x is useful forpredicting y.
Decide, at the 10% significance level, whether the data provide sufficient evidence to
conclude that x is a useful predictor of y.
Decide, at the 10% significance level, whether the data provide sufficient evidence to
conclude that x is a useful predictor of y.
Question
Provide an appropriate response.
The sample data below are the index of exposure (x)to radioactive waste for nine different
Oregon counties and cancer mortality rate (y)(deaths per 100,000). A 99% confidence interval for the slope of the population regression line that relates cancer
mortality rate to index of exposure is 4.26 to 14.20. Provide an interpretation of this
confidence interval.
The sample data below are the index of exposure (x)to radioactive waste for nine different
Oregon counties and cancer mortality rate (y)(deaths per 100,000).
A 99% confidence interval for the slope of the population regression line that relates cancermortality rate to index of exposure is 4.26 to 14.20. Provide an interpretation of this
confidence interval.
Question
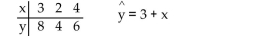
Construct a residual plot for the given data.
Question
Provide an appropriate response.
Question
Perform the required correlation test. You may presume that the assumptions for regression inferences are met.
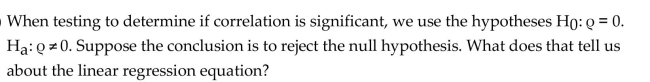
Decide, at the 10% significance level, whether the data provide sufficient evidence to reject
the null hypothesis in favor of the alternative hypothesis.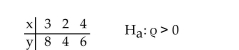
Decide, at the 10% significance level, whether the data provide sufficient evidence to reject
the null hypothesis in favor of the alternative hypothesis.
Question
Construct a residual plot for the given data.
A grass seed company conducts a study to determine the relationship between the density
of seeds planted (in pounds per 500 sq ft)and the quality of the resulting lawn. Eight
similar plots of land are selected and each is planted with a particular density of seed. One
month later the quality of each lawn is rated on a scale of 0 to 100. The sample data are
given below, where x denotes seed density, and y denotes lawn quality.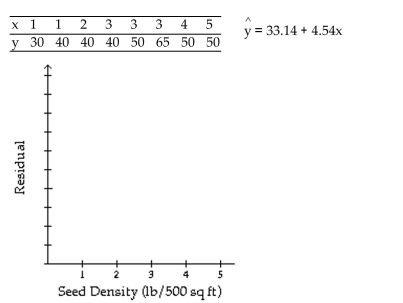
Question
Question
Question
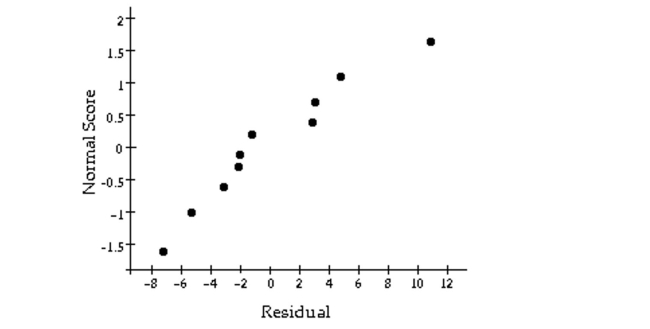
Construct a normal probability plot of the residuals for the given regression data.
Question
Provide an appropriate response.
The graph below is a residual plot for a set of regression data. Does the graph suggest
violation of one or more of the assumptions for regression inferences? Explain your
answer.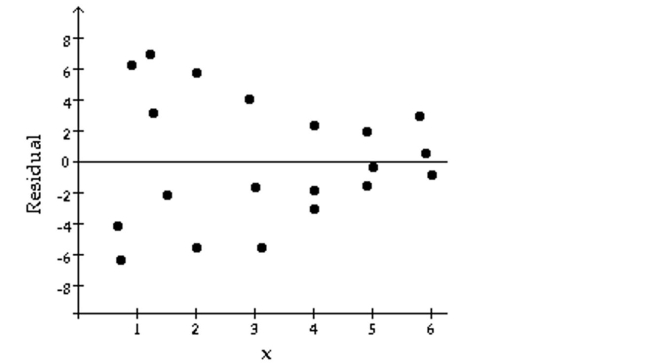
The graph below is a residual plot for a set of regression data. Does the graph suggest
violation of one or more of the assumptions for regression inferences? Explain your
answer.
Question
Question
Paired sample data is given. Discuss what it would mean for Assumptions 1-3 for regression inferences to be satisfied bythe variables under consideration.
A social scientist is interested in the relationship between years of education and income in
adults in the U.S. A random sample of nine working adults yields the following data,
where x denotes years of education completed and y denotes annual income in thousands
of dollars.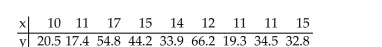
A social scientist is interested in the relationship between years of education and income in
adults in the U.S. A random sample of nine working adults yields the following data,
where x denotes years of education completed and y denotes annual income in thousands
of dollars.
Question
Paired sample data is given. Discuss what it would mean for Assumptions 1-3 for regression inferences to be satisfied bythe variables under consideration.
A researcher is interested in the relationship between height and foot length for female
adults. A random sample of nine women yields the following data, where x denotes height
in inches and y denotes foot length in inches.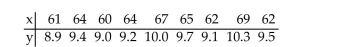
A researcher is interested in the relationship between height and foot length for female
adults. A random sample of nine women yields the following data, where x denotes height
in inches and y denotes foot length in inches.
Question
Provide an appropriate response.
The graph below is a residual plot for a set of regression data. Does the graph suggest
violation of one or more of the assumptions for regression inferences? Explain your
answer.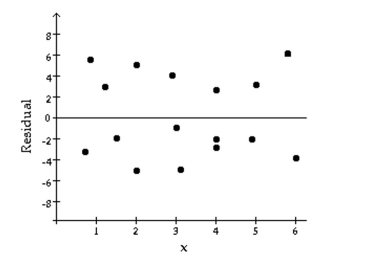
The graph below is a residual plot for a set of regression data. Does the graph suggest
violation of one or more of the assumptions for regression inferences? Explain your
answer.
Question
Construct a normal probability plot of the residuals for the given regression data.
Question

Unlock Deck
Sign up to unlock the cards in this deck!
Unlock Deck
Unlock Deck
1/41
Play
Full screen (f)
Deck 15: Inferential Methods in Regression and Correlation
1
Construct a normal probability plot of the residuals for the given regression data.
Applicants for a particular job, which involves extensive travel in Spanish speaking
countries, must take a proficiency test in Spanish. The sample data below were obtained in
a study of the relationship between the numbers of years applicants have studied Spanish
(x)and their score on the test (y).
2
Provide an appropriate response.
In the context of regression, explain the difference between a confidence interval for a
conditional mean and a prediction interval.
In the context of regression, explain the difference between a confidence interval for a
conditional mean and a prediction interval.
A confidence interval for a conditional mean is
an interval estimate of the mean value of the response variable for all individuals
with a particular value of the predictor variable. A prediction interval is an interval
estimate of the value of the response variable for a single individual with a
particular value of the predictor variable.
an interval estimate of the mean value of the response variable for all individuals
with a particular value of the predictor variable. A prediction interval is an interval
estimate of the value of the response variable for a single individual with a
particular value of the predictor variable.
3
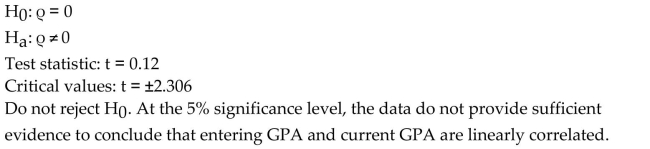
Perform the required correlation test. You may presume that the assumptions for regression inferences are met.
Ten students in a graduate program were randomly selected. Their grade point averages
(GPAs)when they entered the program were between 3.5 and 4.0. The following data
consist of the students' GPAs (x)on entering the program and their current GPAs (y). The sample linear correlation coefficient is r = 0.043. At the 5% significance level, do the
data provide sufficient evidence to conclude that entering GPA and current GPA are
linearly correlated?
Ten students in a graduate program were randomly selected. Their grade point averages
(GPAs)when they entered the program were between 3.5 and 4.0. The following data
consist of the students' GPAs (x)on entering the program and their current GPAs (y).
The sample linear correlation coefficient is r = 0.043. At the 5% significance level, do thedata provide sufficient evidence to conclude that entering GPA and current GPA are
linearly correlated?
4
Provide an appropriate response.
Is it possible for a sample linear correlation coefficient, r, to be close to 0 even though the
population correlation coefficient, Ϭ, is close to 1? Explain your answer.
Is it possible for a sample linear correlation coefficient, r, to be close to 0 even though the
population correlation coefficient, Ϭ, is close to 1? Explain your answer.
Unlock Deck
Unlock for access to all 41 flashcards in this deck.
Unlock Deck
k this deck
5
Provide an appropriate response.
In a study of the relationship between weight and height, a sample regression equation is obtained, in which height is used as the predictor variable. This sample regression equation is then used to
Make inferences. Which of the following statements is true?
A)A 95% confidence interval for the mean weight of all subjects of height 65 inches will be the same width as a 95% prediction interval for the weight of an individual of height 65 inches.
B)A 95% confidence interval for the mean weight of all subjects of height 65 inches will be wider than a 95% prediction interval for the weight of an individual of height 65 inches.
C)A 95% confidence interval for the mean weight of all subjects of height 65 inches will be narrower than a 95% prediction interval for the weight of an individual of height 65 inches.
Unlock Deck
Unlock for access to all 41 flashcards in this deck.
Unlock Deck
k this deck
6
Decide, at the given significance level, whether the data provide sufficient evidence to conclude that x is useful forpredicting y.
Decide, at the 10% significance level, whether the data provide sufficient evidence to
conclude that x is a useful predictor of y.
Decide, at the 10% significance level, whether the data provide sufficient evidence to
conclude that x is a useful predictor of y.
Unlock Deck
Unlock for access to all 41 flashcards in this deck.
Unlock Deck
k this deck
7
Provide an appropriate response.
The heights (in inches)of a random sample of students from one college are as follows. At the 1% significance level, do the data provide sufficient evidence to conclude that
heights of students at this college are not normally distributed?
The heights (in inches)of a random sample of students from one college are as follows.
At the 1% significance level, do the data provide sufficient evidence to conclude thatheights of students at this college are not normally distributed?
Unlock Deck
Unlock for access to all 41 flashcards in this deck.
Unlock Deck
k this deck
8
Perform the required correlation test. You may presume that the assumptions for regression inferences are met.
The sample data below are the index of exposure (x)to radioactive waste for nine different
Oregon counties and cancer mortality rate (y)(deaths per 100,000). The sample linear correlation coefficient is r = 0.926. At the 5% significance level, do the
data provide sufficient evidence to conclude that index of exposure and cancer mortality
rate are linearly correlated?
The sample data below are the index of exposure (x)to radioactive waste for nine different
Oregon counties and cancer mortality rate (y)(deaths per 100,000).
The sample linear correlation coefficient is r = 0.926. At the 5% significance level, do thedata provide sufficient evidence to conclude that index of exposure and cancer mortality
rate are linearly correlated?
Unlock Deck
Unlock for access to all 41 flashcards in this deck.
Unlock Deck
k this deck
9
Perform the required correlation test for normality.
At one bank, twelve customers were selected at random as they entered the bank and
asked to record how long they spent waiting in line. The times (in minutes)were as
follows. At the 5% significance level, do the data provide sufficient evidence to conclude that
waiting times of customers at this bank are not normally distributed?
At one bank, twelve customers were selected at random as they entered the bank and
asked to record how long they spent waiting in line. The times (in minutes)were as
follows.
At the 5% significance level, do the data provide sufficient evidence to conclude thatwaiting times of customers at this bank are not normally distributed?
Unlock Deck
Unlock for access to all 41 flashcards in this deck.
Unlock Deck
k this deck
10
Provide an appropriate response.
The correlation test for normality involves computing the linear correlation coefficient between which of the following pairs?
A)The sample data and the population data
B)The predictor variable and the response variable
C)The values of the response variable and their normal scores
D)The sample data and their normal scores
Unlock Deck
Unlock for access to all 41 flashcards in this deck.
Unlock Deck
k this deck
11
Provide an appropriate response.
In the context of regression analysis, which of the following, roughly speaking , does the standard error of the estimate give an indication of?
A)How much the slope of the sample regression line differs from the slope of the population regression line.
B)How much, on average, the values of the predictor variable differ from their mean.
C)How much, on average, the values of the response variable differ from their mean.
D)How much, on average, the predicted values of the response variable differ from the observed values of the response variable.
Unlock Deck
Unlock for access to all 41 flashcards in this deck.
Unlock Deck
k this deck
12
Perform the required correlation test for normality.
Twelve students were selected at random from a college class and were asked how many
hours they had studied for a particular test. The results are as follows. At the 5% significance level, do the data provide sufficient evidence to conclude that study
times of students in this class are not normally distributed?
Twelve students were selected at random from a college class and were asked how many
hours they had studied for a particular test. The results are as follows.
At the 5% significance level, do the data provide sufficient evidence to conclude that studytimes of students in this class are not normally distributed?
Unlock Deck
Unlock for access to all 41 flashcards in this deck.
Unlock Deck
k this deck
13
Perform the required correlation test. You may presume that the assumptions for regression inferences are met.
A set of sample data consisting of 16 pairs of x and y values yields a sample linear
correlation coefficient of -0.371. At the 2.5% significance level, do the data provide
sufficient evidence to conclude that x and y are negatively linearly correlated?
A set of sample data consisting of 16 pairs of x and y values yields a sample linear
correlation coefficient of -0.371. At the 2.5% significance level, do the data provide
sufficient evidence to conclude that x and y are negatively linearly correlated?
Unlock Deck
Unlock for access to all 41 flashcards in this deck.
Unlock Deck
k this deck
14
Provide an appropriate response.
In the correlation test for normality, the null hypothesis is rejected if the linear correlation coefficient between the sample data and their normal scores is:
A)too much bigger than 1.
B)too close to 1.
C)too far from 1.
D)too much smaller than 1.
In the correlation test for normality, the null hypothesis is rejected if the linear correlation coefficient between the sample data and their normal scores is:
A)too much bigger than 1.
B)too close to 1.
C)too far from 1.
D)too much smaller than 1.
Unlock Deck
Unlock for access to all 41 flashcards in this deck.
Unlock Deck
k this deck
15
Perform the required correlation test. You may presume that the assumptions for regression inferences are met.
Applicants for a particular job, which involves extensive travel in Spanish speaking
countries, must take a proficiency test in Spanish. The sample data below were obtained in
a study of the relationship between the numbers of years applicants have studied Spanish
(x)and their score on the test (y). The sample linear correlation coefficient is r = 0.911. At the 5% significance level, do the
data provide sufficient evidence to conclude that number of years of study and test score
are positively linearly correlated?
Applicants for a particular job, which involves extensive travel in Spanish speaking
countries, must take a proficiency test in Spanish. The sample data below were obtained in
a study of the relationship between the numbers of years applicants have studied Spanish
(x)and their score on the test (y).
The sample linear correlation coefficient is r = 0.911. At the 5% significance level, do thedata provide sufficient evidence to conclude that number of years of study and test score
are positively linearly correlated?
Unlock Deck
Unlock for access to all 41 flashcards in this deck.
Unlock Deck
k this deck
16
Provide an appropriate response.
If the assumptions for regression inferences are met, what would you expect to see when
constructing a residual plot and a normal probability plot for the residuals?
If the assumptions for regression inferences are met, what would you expect to see when
constructing a residual plot and a normal probability plot for the residuals?
Unlock Deck
Unlock for access to all 41 flashcards in this deck.
Unlock Deck
k this deck
17
Perform the required correlation test for normality.
The data below represent the weekly salaries (in dollars)of ten employees selected
randomly from a particular company. At the 10% significance level, do the data provide sufficient evidence to conclude that
weekly salaries of employees at this company are not normally distributed?
The data below represent the weekly salaries (in dollars)of ten employees selected
randomly from a particular company.
At the 10% significance level, do the data provide sufficient evidence to conclude thatweekly salaries of employees at this company are not normally distributed?
Unlock Deck
Unlock for access to all 41 flashcards in this deck.
Unlock Deck
k this deck
18
Paired sample data is given. Discuss what it would mean for Assumptions 1-3 for regression inferences to be satisfied bythe variables under consideration.
A social scientist is interested in the relationship between age and income in adults aged
20-60. A random sample of eight adults yields the following data, where x denotes age in
years and y denotes annual income in thousands of dollars.
A social scientist is interested in the relationship between age and income in adults aged
20-60. A random sample of eight adults yields the following data, where x denotes age in
years and y denotes annual income in thousands of dollars.
Unlock Deck
Unlock for access to all 41 flashcards in this deck.
Unlock Deck
k this deck
19
Construct a residual plot for the given data.
Unlock Deck
Unlock for access to all 41 flashcards in this deck.
Unlock Deck
k this deck
20
Decide, at the given significance level, whether the data provide sufficient evidence to conclude that x is useful forpredicting y.
Applicants for a particular job, which involves extensive travel in Spanish speaking
countries, must take a proficiency test in Spanish. The sample data below were obtained in
a study of the relationship between the numbers of years applicants have studied Spanish
(x)and their score on the test (y). The standard error of the estimate is approximately 5.651. At the 5% level of significance,
do the data provide sufficient evidence to conclude that the slope of the population
regression line is not 0 and hence that number of years of study is useful as a predictor of
score on the test?
Applicants for a particular job, which involves extensive travel in Spanish speaking
countries, must take a proficiency test in Spanish. The sample data below were obtained in
a study of the relationship between the numbers of years applicants have studied Spanish
(x)and their score on the test (y).
The standard error of the estimate is approximately 5.651. At the 5% level of significance,do the data provide sufficient evidence to conclude that the slope of the population
regression line is not 0 and hence that number of years of study is useful as a predictor of
score on the test?
Unlock Deck
Unlock for access to all 41 flashcards in this deck.
Unlock Deck
k this deck
21
Perform the required correlation test. You may presume that the assumptions for regression inferences are met.
A set of sample data consisting of 19 pairs of x and y values yields a sample linear
correlation coefficient of -0.887. At the 1% significance level, do the data provide sufficient
evidence to conclude that x and y are negatively linearly correlated?
A set of sample data consisting of 19 pairs of x and y values yields a sample linear
correlation coefficient of -0.887. At the 1% significance level, do the data provide sufficient
evidence to conclude that x and y are negatively linearly correlated?
Unlock Deck
Unlock for access to all 41 flashcards in this deck.
Unlock Deck
k this deck
22
Decide, at the given significance level, whether the data provide sufficient evidence to conclude that x is useful forpredicting y.
The sample data below are the index of exposure (x)to radioactive waste for nine different
Oregon counties and cancer mortality rate (y)(deaths per 100,000). The standard error of the estimate is approximately 14.0099. At the 5% level of
significance, do the data provide sufficient evidence to conclude that the slope of the
population regression line is not 0 and hence that index of exposure is useful as a predictor
of cancer mortality rate?
The sample data below are the index of exposure (x)to radioactive waste for nine different
Oregon counties and cancer mortality rate (y)(deaths per 100,000).
The standard error of the estimate is approximately 14.0099. At the 5% level ofsignificance, do the data provide sufficient evidence to conclude that the slope of the
population regression line is not 0 and hence that index of exposure is useful as a predictor
of cancer mortality rate?
Unlock Deck
Unlock for access to all 41 flashcards in this deck.
Unlock Deck
k this deck
23
Provide an appropriate response.
Applicants for a particular job, which involves extensive travel in Spanish speaking
countries, must take a proficiency test in Spanish. The sample data below were obtained in
a study of the relationship between the numbers of years applicants have studied Spanish
(x)and their score on the test (y). A 99% confidence interval for the slope of the population regression line that relates test
score to number of years of study is 5.05 to 16.75. Provide an interpretation of this
confidence interval.
Applicants for a particular job, which involves extensive travel in Spanish speaking
countries, must take a proficiency test in Spanish. The sample data below were obtained in
a study of the relationship between the numbers of years applicants have studied Spanish
(x)and their score on the test (y).
A 99% confidence interval for the slope of the population regression line that relates testscore to number of years of study is 5.05 to 16.75. Provide an interpretation of this
confidence interval.
Unlock Deck
Unlock for access to all 41 flashcards in this deck.
Unlock Deck
k this deck
24
Decide, at the given significance level, whether the data provide sufficient evidence to conclude that x is useful forpredicting y.
Decide, at the 10% significance level, whether the data provide sufficient evidence to
conclude that x is a useful predictor of y.
Decide, at the 10% significance level, whether the data provide sufficient evidence to
conclude that x is a useful predictor of y.
Unlock Deck
Unlock for access to all 41 flashcards in this deck.
Unlock Deck
k this deck
25
Provide an appropriate response.
Unlock Deck
Unlock for access to all 41 flashcards in this deck.
Unlock Deck
k this deck
26
Decide, at the given significance level, whether the data provide sufficient evidence to conclude that x is useful forpredicting y.
Decide, at the 10% significance level, whether the data provide sufficient evidence to
conclude that x is a useful predictor of y.
Decide, at the 10% significance level, whether the data provide sufficient evidence to
conclude that x is a useful predictor of y.
Unlock Deck
Unlock for access to all 41 flashcards in this deck.
Unlock Deck
k this deck
27
Provide an appropriate response.
The sample data below are the index of exposure (x)to radioactive waste for nine different
Oregon counties and cancer mortality rate (y)(deaths per 100,000). A 99% confidence interval for the slope of the population regression line that relates cancer
mortality rate to index of exposure is 4.26 to 14.20. Provide an interpretation of this
confidence interval.
The sample data below are the index of exposure (x)to radioactive waste for nine different
Oregon counties and cancer mortality rate (y)(deaths per 100,000).
A 99% confidence interval for the slope of the population regression line that relates cancermortality rate to index of exposure is 4.26 to 14.20. Provide an interpretation of this
confidence interval.
Unlock Deck
Unlock for access to all 41 flashcards in this deck.
Unlock Deck
k this deck
28
Construct a residual plot for the given data.
Unlock Deck
Unlock for access to all 41 flashcards in this deck.
Unlock Deck
k this deck
29
Provide an appropriate response.
Unlock Deck
Unlock for access to all 41 flashcards in this deck.
Unlock Deck
k this deck
30
Perform the required correlation test. You may presume that the assumptions for regression inferences are met.
Decide, at the 10% significance level, whether the data provide sufficient evidence to reject
the null hypothesis in favor of the alternative hypothesis.
Decide, at the 10% significance level, whether the data provide sufficient evidence to reject
the null hypothesis in favor of the alternative hypothesis.
Unlock Deck
Unlock for access to all 41 flashcards in this deck.
Unlock Deck
k this deck
31
Construct a residual plot for the given data.
A grass seed company conducts a study to determine the relationship between the density
of seeds planted (in pounds per 500 sq ft)and the quality of the resulting lawn. Eight
similar plots of land are selected and each is planted with a particular density of seed. One
month later the quality of each lawn is rated on a scale of 0 to 100. The sample data are
given below, where x denotes seed density, and y denotes lawn quality.
Unlock Deck
Unlock for access to all 41 flashcards in this deck.
Unlock Deck
k this deck
32
Perform the required correlation test. You may presume that the assumptions for regression inferences are met.
A set of sample data consisting of 23 pairs of x and y values yields a sample linear
correlation coefficient of -0.898. At the 1% significance level, do the data provide sufficient
evidence to conclude that x and y are linearly correlated?
A set of sample data consisting of 23 pairs of x and y values yields a sample linear
correlation coefficient of -0.898. At the 1% significance level, do the data provide sufficient
evidence to conclude that x and y are linearly correlated?
Unlock Deck
Unlock for access to all 41 flashcards in this deck.
Unlock Deck
k this deck
33
Provide an appropriate response.
A researcher is interested in the relationship between age and income. He performs a
regression analysis using age as the predictor variable and annual income as the response
variable. He obtains the equation of the regression line and then computes the standard
error of the estimate, which comes out to $6570. Give an interpretation of the standard
error of the estimate.
Unlock Deck
Unlock for access to all 41 flashcards in this deck.
Unlock Deck
k this deck
34
Construct a normal probability plot of the residuals for the given regression data.
Unlock Deck
Unlock for access to all 41 flashcards in this deck.
Unlock Deck
k this deck
35
Provide an appropriate response.
The graph below is a residual plot for a set of regression data. Does the graph suggest
violation of one or more of the assumptions for regression inferences? Explain your
answer.
The graph below is a residual plot for a set of regression data. Does the graph suggest
violation of one or more of the assumptions for regression inferences? Explain your
answer.
Unlock Deck
Unlock for access to all 41 flashcards in this deck.
Unlock Deck
k this deck
36
Provide an appropriate response.
In a study of the relationship between height and weight, a sample regression equation is
obtained in which height is used as the predictor variable. Explain why a confidence
interval for a conditional mean corresponding to the height 70 inches is narrower than a
prediction interval corresponding to the height 70 inches.
Unlock Deck
Unlock for access to all 41 flashcards in this deck.
Unlock Deck
k this deck
37
Paired sample data is given. Discuss what it would mean for Assumptions 1-3 for regression inferences to be satisfied bythe variables under consideration.
A social scientist is interested in the relationship between years of education and income in
adults in the U.S. A random sample of nine working adults yields the following data,
where x denotes years of education completed and y denotes annual income in thousands
of dollars.
A social scientist is interested in the relationship between years of education and income in
adults in the U.S. A random sample of nine working adults yields the following data,
where x denotes years of education completed and y denotes annual income in thousands
of dollars.
Unlock Deck
Unlock for access to all 41 flashcards in this deck.
Unlock Deck
k this deck
38
Paired sample data is given. Discuss what it would mean for Assumptions 1-3 for regression inferences to be satisfied bythe variables under consideration.
A researcher is interested in the relationship between height and foot length for female
adults. A random sample of nine women yields the following data, where x denotes height
in inches and y denotes foot length in inches.
A researcher is interested in the relationship between height and foot length for female
adults. A random sample of nine women yields the following data, where x denotes height
in inches and y denotes foot length in inches.
Unlock Deck
Unlock for access to all 41 flashcards in this deck.
Unlock Deck
k this deck
39
Provide an appropriate response.
The graph below is a residual plot for a set of regression data. Does the graph suggest
violation of one or more of the assumptions for regression inferences? Explain your
answer.
The graph below is a residual plot for a set of regression data. Does the graph suggest
violation of one or more of the assumptions for regression inferences? Explain your
answer.
Unlock Deck
Unlock for access to all 41 flashcards in this deck.
Unlock Deck
k this deck
40
Construct a normal probability plot of the residuals for the given regression data.
Unlock Deck
Unlock for access to all 41 flashcards in this deck.
Unlock Deck
k this deck
41
Provide an appropriate response.
What would you expect for the linear correlation coefficient between a set of sample data
and their normal scores if the variable under consideration is normally distributed. Why?
What would you expect for the linear correlation coefficient between a set of sample data
and their normal scores if the variable under consideration is normally distributed. Why?
Unlock Deck
Unlock for access to all 41 flashcards in this deck.
Unlock Deck
k this deck
Unlock Deck
Unlock for access to all 41 flashcards in this deck.


