Deck 3: Visual Displays of Data
Full screen (f)
Question
Question
A car insurance company conducted a survey to find out how many car accidents people had been involved in.
They selected a sample of 32 adults between the ages of 30 and 70 and asked each person how many accidents
They had been involved in in the past ten years. The following data were obtained.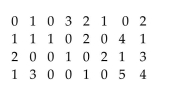
Create a frequency table for the number of car accidents.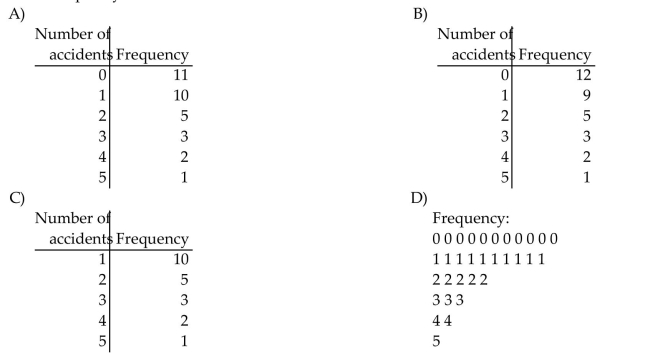
They selected a sample of 32 adults between the ages of 30 and 70 and asked each person how many accidents
They had been involved in in the past ten years. The following data were obtained.
Create a frequency table for the number of car accidents.
Question
Question
Question
Question
Question
Question
Question
Question
Question
Construct a frequency table for the weights (in ounces)given below of 40 packages of candy. Start the first bin
At 1.600 ounces and use a bin width of 0.010 ounce.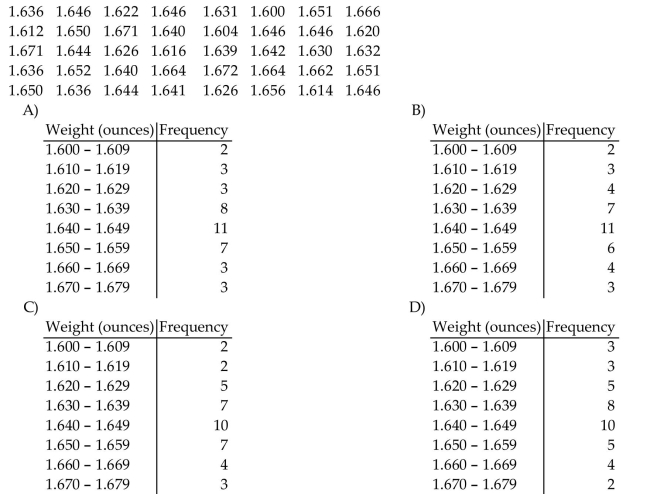
At 1.600 ounces and use a bin width of 0.010 ounce.
Question
Question
Question
Question
Question
Question
A teacher asked each of her students how many novels they had read in the previous six months. The results are
Shown below.
Create a frequency table for the number of novels read.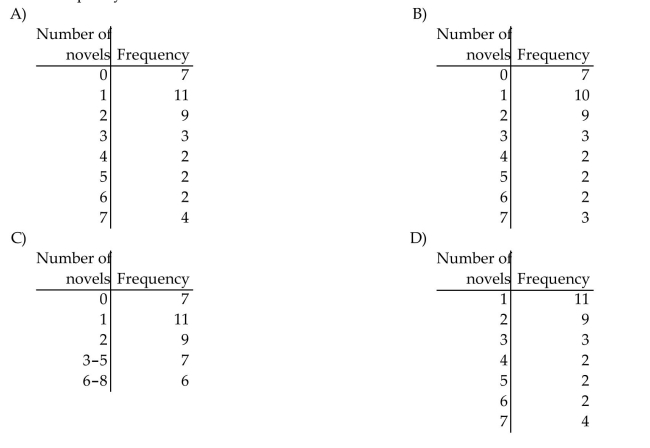
Shown below.
Create a frequency table for the number of novels read.
Question
Question
A medical research team studied the ages of patients who had strokes caused by stress. The ages of 34 patients who
Suffered stress strokes were as follows.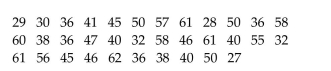
Create a frequency table for these ages. Use 8 bins and start the first bin at 25.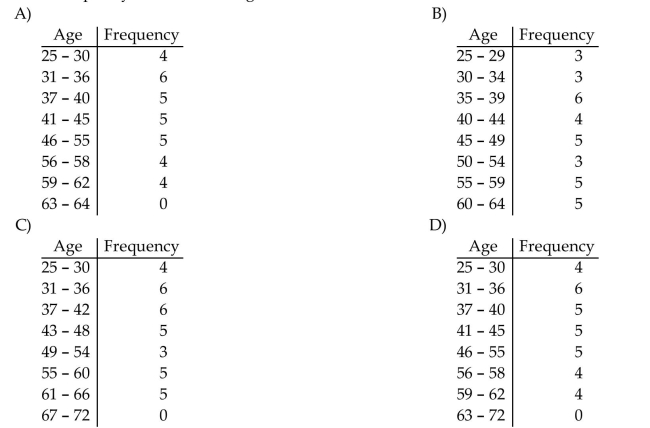
Suffered stress strokes were as follows.
Create a frequency table for these ages. Use 8 bins and start the first bin at 25.
Question
Question
A nurse measured the blood pressure of each person who visited her clinic. Following is a relative-frequency histogram for the systolic blood pressure readings for those people aged between 25 and 40. Use the histogram to answer the question. The blood pressure readings were given to the nearest whole number. 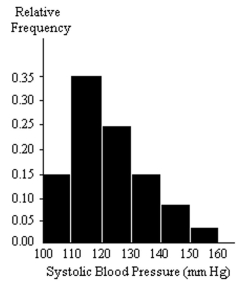
-Approximately what percentage of the people aged 25-40 had a systolic blood pressure reading between 110and 119 inclusive?
A)3.5%
B)0.35%
C)35%
D)30%
-Approximately what percentage of the people aged 25-40 had a systolic blood pressure reading between 110and 119 inclusive?
A)3.5%
B)0.35%
C)35%
D)30%
Question
A nurse measured the blood pressure of each person who visited her clinic. Following is a relative-frequency histogram for the systolic blood pressure readings for those people aged between 25 and 40. Use the histogram to answer the question. The blood pressure readings were given to the nearest whole number.
-Given that 800 people were aged between 25 and 40, approximately how many had a systolic blood pressure reading between 140 and 149 inclusive?
A)64
B)6
C)8
D)640
-Given that 800 people were aged between 25 and 40, approximately how many had a systolic blood pressure reading between 140 and 149 inclusive?
A)64
B)6
C)8
D)640
Question
Question
Question
Question
A nurse measured the blood pressure of each person who visited her clinic. Following is a relative-frequency histogram for the systolic blood pressure readings for those people aged between 25 and 40. Use the histogram to answer the question. The blood pressure readings were given to the nearest whole number.
-Given that 600 people were aged between 25 and 40, approximately how many had a systolic blood pressure reading between 130 and 149 inclusive?
A)14
B)138
C)90
D)23
-Given that 600 people were aged between 25 and 40, approximately how many had a systolic blood pressure reading between 130 and 149 inclusive?
A)14
B)138
C)90
D)23
Question
A nurse measured the blood pressure of each person who visited her clinic. Following is a relative-frequency histogram for the systolic blood pressure readings for those people aged between 25 and 40. Use the histogram to answer the question. The blood pressure readings were given to the nearest whole number.
-Approximately what percentage of the people aged 25-40 had a systolic blood pressure reading less than 120?
A)5%
B)35%
C)50%
D)3.5%
-Approximately what percentage of the people aged 25-40 had a systolic blood pressure reading less than 120?
A)5%
B)35%
C)50%
D)3.5%
Question
A nurse measured the blood pressure of each person who visited her clinic. Following is a relative-frequency histogram for the systolic blood pressure readings for those people aged between 25 and 40. Use the histogram to answer the question. The blood pressure readings were given to the nearest whole number.
-Given that 200 people were aged between 25 and 40, approximately how many had a systolic blood pressure reading less than 130?
A)48
B)15
C)74
D)148
-Given that 200 people were aged between 25 and 40, approximately how many had a systolic blood pressure reading less than 130?
A)48
B)15
C)74
D)148
Question
Make a bar graph to represent the data.
The following table shows the number of female infants born at Hospital X on New Year's Day (Jan. 1). Create a
bar graph for the data.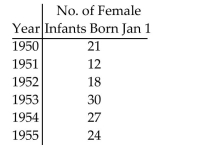
The following table shows the number of female infants born at Hospital X on New Year's Day (Jan. 1). Create a
bar graph for the data.
Question
A nurse measured the blood pressure of each person who visited her clinic. Following is a relative-frequency histogram for the systolic blood pressure readings for those people aged between 25 and 40. Use the histogram to answer the question. The blood pressure readings were given to the nearest whole number.
-Approximately what percentage of the people aged 25-40 had a systolic blood pressure reading greater than or equal to 130?
A)15%
B)26%
C)23%
D)74%
-Approximately what percentage of the people aged 25-40 had a systolic blood pressure reading greater than or equal to 130?
A)15%
B)26%
C)23%
D)74%
Question
Solve the problem.
-Wagenlucht Ice Cream Company is always trying to create new flavors of ice cream. They are market testing three kinds to find out which one has the best chance by of becoming popular. They give small samples of each to 50 people at a grocery store. 10 ice cream tasters preferred the Strawberry Cream, 30 preferred Choco-Nuts, and 10 loved the Orange Mint. Construct a Pareto chart to represent these preferences as percentages.
A)
B)
C)
D)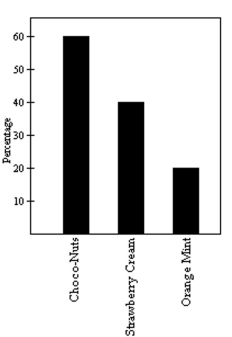
Question
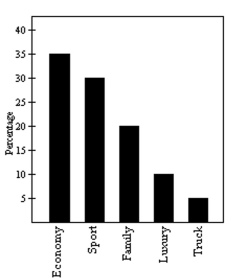
Solve the problem.
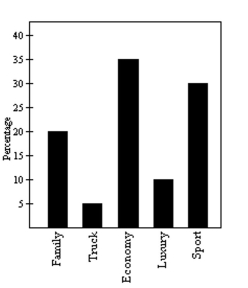
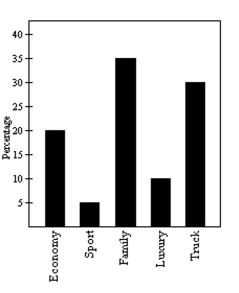
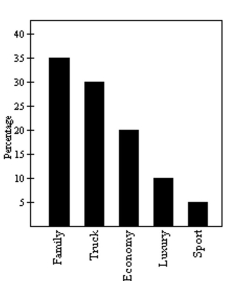
-A car dealer is deciding what kinds of vehicles he should order from the factory. His sales report for the preceding period is shown below. Construct a Pareto chart to represent the sales of each type of vehicle as percentages.
A)
B)
C)
D)
-A car dealer is deciding what kinds of vehicles he should order from the factory. His sales report for the preceding period is shown below. Construct a Pareto chart to represent the sales of each type of vehicle as percentages.
A)
B)
C)
D)
Question
Question
A nurse measured the blood pressure of each person who visited her clinic. Following is a relative-frequency histogram for the systolic blood pressure readings for those people aged between 25 and 40. Use the histogram to answer the question. The blood pressure readings were given to the nearest whole number.
-Given that 700 people were aged between 25 and 40, approximately how many had a systolic blood pressure reading of 140 or higher?
A)11
B)56
C)8
D)77
-Given that 700 people were aged between 25 and 40, approximately how many had a systolic blood pressure reading of 140 or higher?
A)11
B)56
C)8
D)77
Question
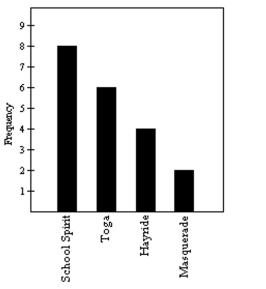
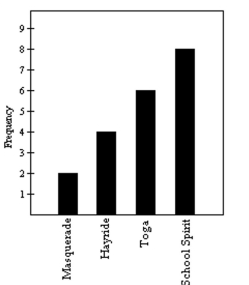
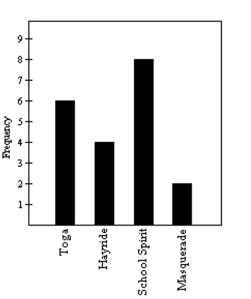
Solve the problem.
-The Kappa Iota Sigma Fraternity polled its members on the weekend party theme. The vote was as follows: six for toga, four for hayride, eight for school spirit, and two for masquerade. Display the vote count in a Pareto chart.
A)
B)
C)
D)
-The Kappa Iota Sigma Fraternity polled its members on the weekend party theme. The vote was as follows: six for toga, four for hayride, eight for school spirit, and two for masquerade. Display the vote count in a Pareto chart.
A)
B)
C)
D)
Question
Solve the problem.
-200 casino patrons, were interviewed as they left the casino. 60 of them said they spent most of the time playing the slots. 60 of them said they played blackjack. 30 said they played craps. 10 said roulette. 10 said poker. The rest were not sure what they played the most. Construct a Pareto chart to depict the gaming practices of the group of casino goers as percentages.
A)
B)
C)
D)
Question
Question
A nurse measured the blood pressure of each person who visited her clinic. Following is a relative-frequency histogram for the systolic blood pressure readings for those people aged between 25 and 40. Use the histogram to answer the question. The blood pressure readings were given to the nearest whole number.
-Approximately what percentage of the people aged 25-40 had a systolic blood pressure reading between 110 and 139 inclusive?
A)74%
B)89%
C)39%
D)59%
-Approximately what percentage of the people aged 25-40 had a systolic blood pressure reading between 110 and 139 inclusive?
A)74%
B)89%
C)39%
D)59%
Question
A nurse measured the blood pressure of each person who visited her clinic. Following is a relative-frequency histogram for the systolic blood pressure readings for those people aged between 25 and 40. Use the histogram to answer the question. The blood pressure readings were given to the nearest whole number.
-Identify the midpoint of the third class.
A)120
B)130
C)124
D)125
-Identify the midpoint of the third class.
A)120
B)130
C)124
D)125
Question
Question
Question
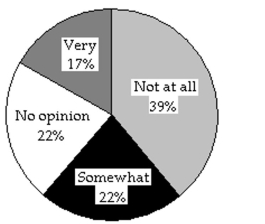
Construct a pie chart representing the given data set.
-The data below represent the results of a poll in which the following question was asked: "To what degree are you
Satisfied with your current health insurance?"
Very
Somewhat
Not at All
No opinion
A)
B)
-The data below represent the results of a poll in which the following question was asked: "To what degree are you
Satisfied with your current health insurance?"
Very
Somewhat
Not at All
No opinion
A)
B)
Question
Question
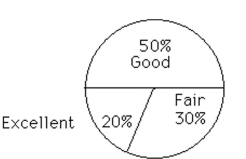
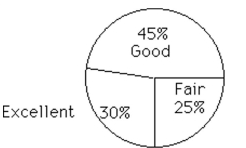
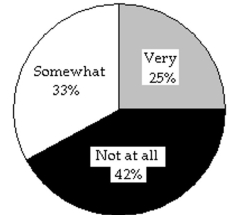
Construct a pie chart representing the given data set.
-900 movie critics rated a movie. The following data give the rating distribution.

A)
B)
-900 movie critics rated a movie. The following data give the rating distribution.
A)
B)
Question
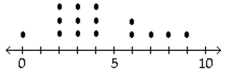
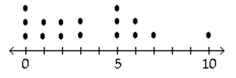
Provide the appropriate response.
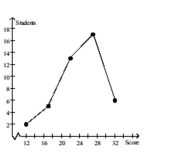
The following dot plot represents the ages of the people in a sample selected from a group of campaign
Volunteers.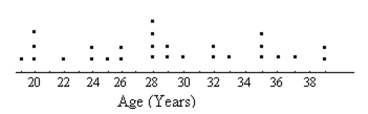
How many people were in the sample?
A)21
B)28
C)30
D)27
The following dot plot represents the ages of the people in a sample selected from a group of campaign
Volunteers.
How many people were in the sample?
A)21
B)28
C)30
D)27
Question
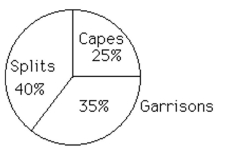
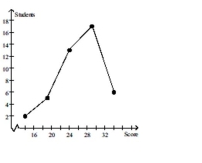
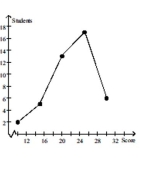
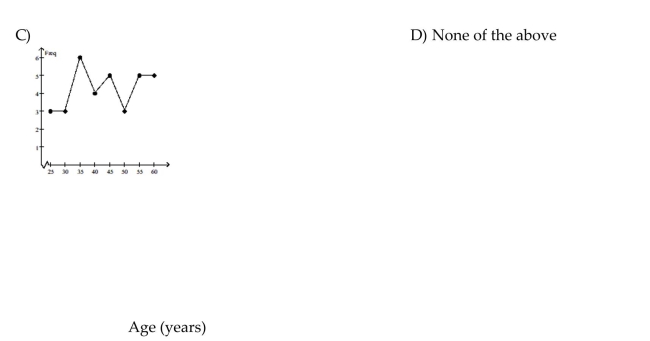
Construct a line chart for the data.
The ages of employees of a company are summarized in the frequency table.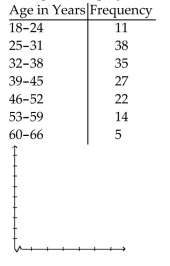
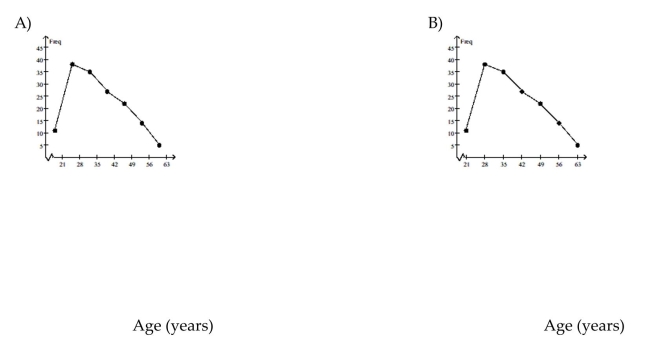
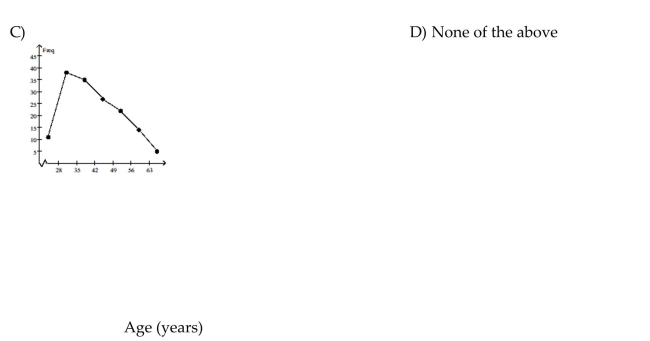
The ages of employees of a company are summarized in the frequency table.
Question
A nurse measured the blood pressure of each person who visited her clinic. Following is a relative-frequency histogram for the systolic blood pressure readings for those people aged between 25 and 40. Use the histogram to answer the question. The blood pressure readings were given to the nearest whole number.
-What common class width was used to construct the frequency distribution?
A)11
B)9
C)100
D)10
-What common class width was used to construct the frequency distribution?
A)11
B)9
C)100
D)10
Question
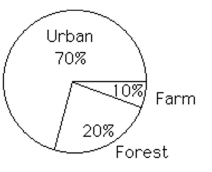
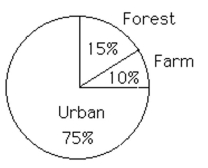
Construct a pie chart representing the given data set.
-The following data give the distribution of the types of houses in a town containing 34,000 houses.

A)
B)
-The following data give the distribution of the types of houses in a town containing 34,000 houses.
A)
B)
Question
Question
Question
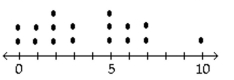
Provide the appropriate response.
A manufacturer records the number of errors each work station makes during the week. The data are as follows.
6 3 2 3 5 2 0 2 5 4 2 0 1
Create a dot plot for this data.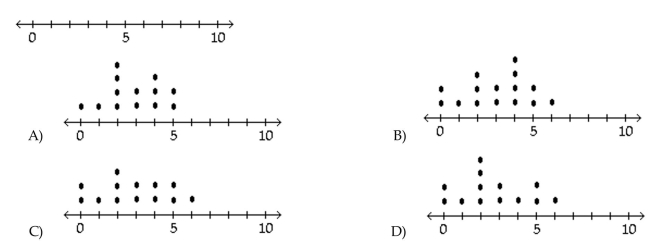
A manufacturer records the number of errors each work station makes during the week. The data are as follows.
6 3 2 3 5 2 0 2 5 4 2 0 1
Create a dot plot for this data.
Question
Construct a line chart for the data.
Question
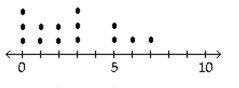
Provide the appropriate response.
The following dot plot represents the ages of the customers who visited a sporting goods store on a particular
Monday.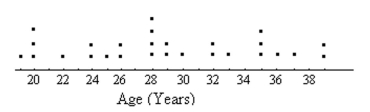
How many people in the sample were aged between 20 and 28, inclusive?
A)13
B)10
C)9
D)6
The following dot plot represents the ages of the customers who visited a sporting goods store on a particular
Monday.
How many people in the sample were aged between 20 and 28, inclusive?
A)13
B)10
C)9
D)6
Question
Question
Provide the appropriate response.
-Attendance records at a school show the number of days each student was absent during the year. The days absent for each student were as follows.
Create a dot plot for this data.
A)
B)
C)
D)
-Attendance records at a school show the number of days each student was absent during the year. The days absent for each student were as follows.
Create a dot plot for this data.
A)
B)
C)
D)
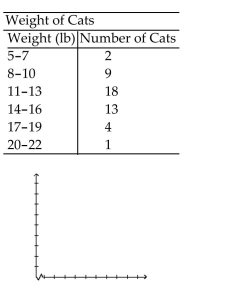
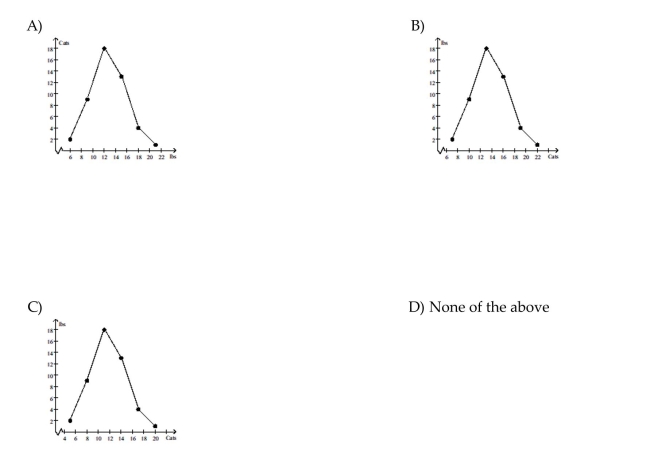
Question
Construct a line chart for the data.
-
A)
B)
C)
D) None of the above
-
A)
B)
C)
D) None of the above
Question
Construct a pie chart representing the given data set.
-The data below represent the results of a poll in which the the following question was asked: "To what degree are you
Satisfied with the outcome of the 2006 mayoral election?"
A)
B)
-The data below represent the results of a poll in which the the following question was asked: "To what degree are you
Satisfied with the outcome of the 2006 mayoral election?"
A)
B)
Question
Question
Construct a line chart for the data.
A medical research team studied the ages of patients who had strokes caused by stress. The results of 34
Patients are as follows: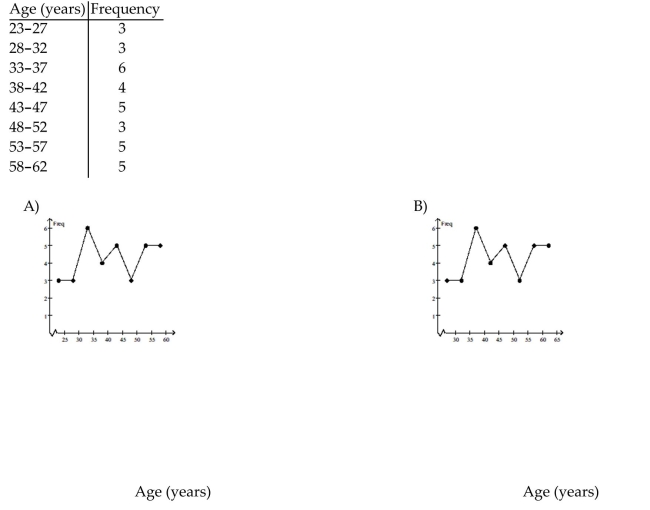
A medical research team studied the ages of patients who had strokes caused by stress. The results of 34
Patients are as follows:
Question
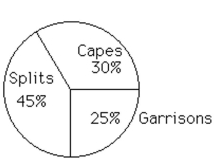
Construct a pie chart representing the given data set.
-The following figures give the distribution of land (in acres)for a county containing 78,000 acres.

A)
B)
-The following figures give the distribution of land (in acres)for a county containing 78,000 acres.
A)
B)
Question
Question
Question
Solve the problem.
Question
Question
Question
Question
Question
Question
Question
Question
Solve the problem.
Question
Question
Question
Question
Question
Question
Question
Question
Solve the problem.
Use the high closing values of Naristar Inc. stock from the years 1990 - 2001 to construct a time-series graph.
(Let x = 0 stand for 1990 and so on...)Identify a trend.
Use the high closing values of Naristar Inc. stock from the years 1990 - 2001 to construct a time-series graph.
(Let x = 0 stand for 1990 and so on...)Identify a trend.
Question

Unlock Deck
Sign up to unlock the cards in this deck!
Unlock Deck
Unlock Deck
1/115
Play
Full screen (f)
Deck 3: Visual Displays of Data
1
Construct the requested table. Round relative frequencies to the nearest hundredth of a percent, unless otherwise indicated.
-The frequency table below shows the distribution of students' scores on an exam. Construct the relative frequency table.
A)
B)
C)
D)
-The frequency table below shows the distribution of students' scores on an exam. Construct the relative frequency table.
A)
B)
C)
D)
2
A car insurance company conducted a survey to find out how many car accidents people had been involved in.
They selected a sample of 32 adults between the ages of 30 and 70 and asked each person how many accidents
They had been involved in in the past ten years. The following data were obtained.
Create a frequency table for the number of car accidents.
They selected a sample of 32 adults between the ages of 30 and 70 and asked each person how many accidents
They had been involved in in the past ten years. The following data were obtained.
Create a frequency table for the number of car accidents.
A
3
Provide an appropriate response.
-A car insurance company conducted a survey to find out how many car accidents people had been involved in they selected a sample of 32 adults between the ages of 30 and 70 and asked each person how many accidents they had been involved in in the past ten years. The following data were obtained.
Create a cumulative frequency table for the data.
A)
B)
C)
D)
4
The table shows the country represented by the winner of the 10,000 meter run in the Summer Olympic Games in various years. Create a frequency table for the number of winners of the 10,000 meter run.
A)
B)
C)
D)
A)
B)
C)
D)
Unlock Deck
Unlock for access to all 115 flashcards in this deck.
Unlock Deck
k this deck
5
Provide an appropriate response.
-A professional tennis player hit one hundred balls and their speeds were recorded.
Create a cumulative frequency table for the data.
A)
B)
C)
D)
-A professional tennis player hit one hundred balls and their speeds were recorded.
Create a cumulative frequency table for the data.
A)
B)
C)
D)
Unlock Deck
Unlock for access to all 115 flashcards in this deck.
Unlock Deck
k this deck
6
Construct the requested table. Round relative frequencies to the nearest hundredth of a percent, unless otherwise indicated.
-On Monday mornings, a bookie tabulates the point spreads for the basketball games played on Saturday and sunday. He found that 2 games had a spread of 1 or 2 points, 4 had a spread of 3 to 6 points, 3 had a spread of 7 To 10, and 3 were more than 10. Construct the relative frequency table the bookie obtained for the weekend
Basketball games.
A)
B)
C)
D)
Unlock Deck
Unlock for access to all 115 flashcards in this deck.
Unlock Deck
k this deck
7
The following data represent the total number of years of formal education for 40 employees of a bank.
Create a frequency table for the number of years of education.
A)
B)
C)
D)
Create a frequency table for the number of years of education.
A)
B)
C)
D)
Unlock Deck
Unlock for access to all 115 flashcards in this deck.
Unlock Deck
k this deck
8
Construct the requested table. Round relative frequencies to the nearest hundredth of a percent, unless otherwise indicated.
-The following data show the body temperatures (°F)of randomly selected subjects. Construct a relative
Frequency table with seven classes: 96.9 - 97.2, 97.3 - 97.6, 97.7 - 98.0, and so on.
Round relative frequencies to the nearest tenth of a percent.
A)
B)
C)
D)
-The following data show the body temperatures (°F)of randomly selected subjects. Construct a relative
Frequency table with seven classes: 96.9 - 97.2, 97.3 - 97.6, 97.7 - 98.0, and so on.
Round relative frequencies to the nearest tenth of a percent.
A)
B)
C)
D)
Unlock Deck
Unlock for access to all 115 flashcards in this deck.
Unlock Deck
k this deck
9
Provide an appropriate response.
-The following data represent the total number of years of formal education for 40 employees of a bank.
Determine the appropriate entry in the cumulative frequency table for 13 years of education.
A)15
B)37.5%
C)11
D)27.5%
-The following data represent the total number of years of formal education for 40 employees of a bank.
Determine the appropriate entry in the cumulative frequency table for 13 years of education.
A)15
B)37.5%
C)11
D)27.5%
Unlock Deck
Unlock for access to all 115 flashcards in this deck.
Unlock Deck
k this deck
10
Construct the requested table. Round relative frequencies to the nearest hundredth of a percent, unless otherwise indicated.
-Construct a relative frequency table for the weights (in ounces)given below of 40 packages of candy. Start the
First bin at 1.500 ounces and use a bin width of 0.010 ounce.
Express relative frequencies as fractions. Do not simplify.
A)
B)
C)
D)
-Construct a relative frequency table for the weights (in ounces)given below of 40 packages of candy. Start the
First bin at 1.500 ounces and use a bin width of 0.010 ounce.
Express relative frequencies as fractions. Do not simplify.
A)
B)
C)
D)
Unlock Deck
Unlock for access to all 115 flashcards in this deck.
Unlock Deck
k this deck
11
Construct a frequency table for the weights (in ounces)given below of 40 packages of candy. Start the first bin
At 1.600 ounces and use a bin width of 0.010 ounce.
At 1.600 ounces and use a bin width of 0.010 ounce.
Unlock Deck
Unlock for access to all 115 flashcards in this deck.
Unlock Deck
k this deck
12
Provide an appropriate response.
-The frequency table shows the weights in ounces of 30 stones.
Create a cumulative frequency table for the data.
A)
B)
C)
D)
-The frequency table shows the weights in ounces of 30 stones.
Create a cumulative frequency table for the data.
A)
B)
C)
D)
Unlock Deck
Unlock for access to all 115 flashcards in this deck.
Unlock Deck
k this deck
13
The following data show the body temperatures (°F)of randomly selected subjects. Construct a frequency table with seven classes: 96.0 - 97.2, 97.3 - 97.6, 97.7 - 98.0, and so on.
A)
B)
C)
D)
A)
B)
C)
D)
Unlock Deck
Unlock for access to all 115 flashcards in this deck.
Unlock Deck
k this deck
14
Construct the requested table. Round relative frequencies to the nearest hundredth of a percent, unless otherwise indicated.
-The frequency table shows the weights in ounces of 30 stones. Construct the relative frequency table from the given frequency table. Round relative frequencies to the nearest tenth of
A percent.
A)
B)
C)
D)
-The frequency table shows the weights in ounces of 30 stones. Construct the relative frequency table from the given frequency table. Round relative frequencies to the nearest tenth of
A percent.
A)
B)
C)
D)
Unlock Deck
Unlock for access to all 115 flashcards in this deck.
Unlock Deck
k this deck
15
Construct the requested table. Round relative frequencies to the nearest hundredth of a percent, unless otherwise indicated.
-The frequency table below shows the distribution of the weekly incomes (in dollars)of the employees of a firm. Construct the relative frequency table.
A)
B)
C)
D)
-The frequency table below shows the distribution of the weekly incomes (in dollars)of the employees of a firm. Construct the relative frequency table.
A)
B)
C)
D)
Unlock Deck
Unlock for access to all 115 flashcards in this deck.
Unlock Deck
k this deck
16
Construct an unbinned frequency table for the numbers of persons with various blood types.
Create a frequency table for the data.
A)
B)
C)
D)
Create a frequency table for the data.
A)
B)
C)
D)
Unlock Deck
Unlock for access to all 115 flashcards in this deck.
Unlock Deck
k this deck
17
A teacher asked each of her students how many novels they had read in the previous six months. The results are
Shown below.
Create a frequency table for the number of novels read.
Shown below.
Create a frequency table for the number of novels read.
Unlock Deck
Unlock for access to all 115 flashcards in this deck.
Unlock Deck
k this deck
18
Provide an appropriate response.
-The frequency table shows the number of days of vacation taken in 1996 by 100 employees of a company.
Create a cumulative frequency table for the data.
A)
B)
C)
D)
-The frequency table shows the number of days of vacation taken in 1996 by 100 employees of a company.
Create a cumulative frequency table for the data.
A)
B)
C)
D)
Unlock Deck
Unlock for access to all 115 flashcards in this deck.
Unlock Deck
k this deck
19
A medical research team studied the ages of patients who had strokes caused by stress. The ages of 34 patients who
Suffered stress strokes were as follows.
Create a frequency table for these ages. Use 8 bins and start the first bin at 25.
Suffered stress strokes were as follows.
Create a frequency table for these ages. Use 8 bins and start the first bin at 25.
Unlock Deck
Unlock for access to all 115 flashcards in this deck.
Unlock Deck
k this deck
20
Provide an appropriate response.
-The frequency table shows the heights (in inches)of 80 professional basketball players.
Create a cumulative frequency table for the data.
A)
B)
C)
D)
-The frequency table shows the heights (in inches)of 80 professional basketball players.
Create a cumulative frequency table for the data.
A)
B)
C)
D)
Unlock Deck
Unlock for access to all 115 flashcards in this deck.
Unlock Deck
k this deck
21
A nurse measured the blood pressure of each person who visited her clinic. Following is a relative-frequency histogram for the systolic blood pressure readings for those people aged between 25 and 40. Use the histogram to answer the question. The blood pressure readings were given to the nearest whole number.
-Approximately what percentage of the people aged 25-40 had a systolic blood pressure reading between 110and 119 inclusive?
A)3.5%
B)0.35%
C)35%
D)30%
-Approximately what percentage of the people aged 25-40 had a systolic blood pressure reading between 110and 119 inclusive?
A)3.5%
B)0.35%
C)35%
D)30%
Unlock Deck
Unlock for access to all 115 flashcards in this deck.
Unlock Deck
k this deck
22
A nurse measured the blood pressure of each person who visited her clinic. Following is a relative-frequency histogram for the systolic blood pressure readings for those people aged between 25 and 40. Use the histogram to answer the question. The blood pressure readings were given to the nearest whole number.
-Given that 800 people were aged between 25 and 40, approximately how many had a systolic blood pressure reading between 140 and 149 inclusive?
A)64
B)6
C)8
D)640
-Given that 800 people were aged between 25 and 40, approximately how many had a systolic blood pressure reading between 140 and 149 inclusive?
A)64
B)6
C)8
D)640
Unlock Deck
Unlock for access to all 115 flashcards in this deck.
Unlock Deck
k this deck
23
Provide an appropriate response.
-Construct a cumulative frequency table for the weights (in ounces)given below of 40 packages of candy. Start
The first bin at 1.800 ounces and use a bin width of 0.010 ounce.
A)
B)
C)
D)
-Construct a cumulative frequency table for the weights (in ounces)given below of 40 packages of candy. Start
The first bin at 1.800 ounces and use a bin width of 0.010 ounce.
A)
B)
C)
D)
Unlock Deck
Unlock for access to all 115 flashcards in this deck.
Unlock Deck
k this deck
24
Make a bar graph to represent the data.
-Construct a bar graph for the relative frequencies given.
-Construct a bar graph for the relative frequencies given.
Unlock Deck
Unlock for access to all 115 flashcards in this deck.
Unlock Deck
k this deck
25
Provide an appropriate response.
-A teacher asked each of her students how many novels they had read in the previous six months. The results are shown below.
Determine the appropriate entry in the cumulative frequency table for 7 novels read.
A)40
B)10%
C)4
D)100%
-A teacher asked each of her students how many novels they had read in the previous six months. The results are shown below.
Determine the appropriate entry in the cumulative frequency table for 7 novels read.
A)40
B)10%
C)4
D)100%
Unlock Deck
Unlock for access to all 115 flashcards in this deck.
Unlock Deck
k this deck
26
A nurse measured the blood pressure of each person who visited her clinic. Following is a relative-frequency histogram for the systolic blood pressure readings for those people aged between 25 and 40. Use the histogram to answer the question. The blood pressure readings were given to the nearest whole number.
-Given that 600 people were aged between 25 and 40, approximately how many had a systolic blood pressure reading between 130 and 149 inclusive?
A)14
B)138
C)90
D)23
-Given that 600 people were aged between 25 and 40, approximately how many had a systolic blood pressure reading between 130 and 149 inclusive?
A)14
B)138
C)90
D)23
Unlock Deck
Unlock for access to all 115 flashcards in this deck.
Unlock Deck
k this deck
27
A nurse measured the blood pressure of each person who visited her clinic. Following is a relative-frequency histogram for the systolic blood pressure readings for those people aged between 25 and 40. Use the histogram to answer the question. The blood pressure readings were given to the nearest whole number.
-Approximately what percentage of the people aged 25-40 had a systolic blood pressure reading less than 120?
A)5%
B)35%
C)50%
D)3.5%
-Approximately what percentage of the people aged 25-40 had a systolic blood pressure reading less than 120?
A)5%
B)35%
C)50%
D)3.5%
Unlock Deck
Unlock for access to all 115 flashcards in this deck.
Unlock Deck
k this deck
28
A nurse measured the blood pressure of each person who visited her clinic. Following is a relative-frequency histogram for the systolic blood pressure readings for those people aged between 25 and 40. Use the histogram to answer the question. The blood pressure readings were given to the nearest whole number.
-Given that 200 people were aged between 25 and 40, approximately how many had a systolic blood pressure reading less than 130?
A)48
B)15
C)74
D)148
-Given that 200 people were aged between 25 and 40, approximately how many had a systolic blood pressure reading less than 130?
A)48
B)15
C)74
D)148
Unlock Deck
Unlock for access to all 115 flashcards in this deck.
Unlock Deck
k this deck
29
Make a bar graph to represent the data.
The following table shows the number of female infants born at Hospital X on New Year's Day (Jan. 1). Create a
bar graph for the data.
The following table shows the number of female infants born at Hospital X on New Year's Day (Jan. 1). Create a
bar graph for the data.
Unlock Deck
Unlock for access to all 115 flashcards in this deck.
Unlock Deck
k this deck
30
A nurse measured the blood pressure of each person who visited her clinic. Following is a relative-frequency histogram for the systolic blood pressure readings for those people aged between 25 and 40. Use the histogram to answer the question. The blood pressure readings were given to the nearest whole number.
-Approximately what percentage of the people aged 25-40 had a systolic blood pressure reading greater than or equal to 130?
A)15%
B)26%
C)23%
D)74%
-Approximately what percentage of the people aged 25-40 had a systolic blood pressure reading greater than or equal to 130?
A)15%
B)26%
C)23%
D)74%
Unlock Deck
Unlock for access to all 115 flashcards in this deck.
Unlock Deck
k this deck
31
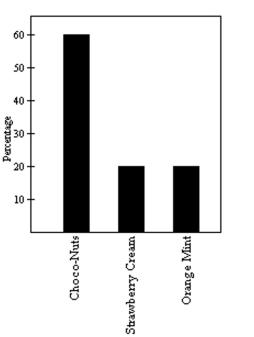
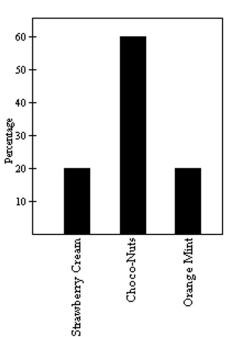
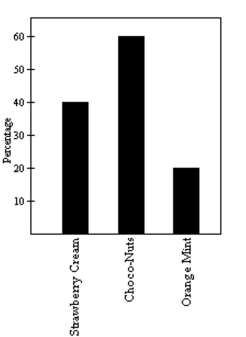
Solve the problem.
-Wagenlucht Ice Cream Company is always trying to create new flavors of ice cream. They are market testing three kinds to find out which one has the best chance by of becoming popular. They give small samples of each to 50 people at a grocery store. 10 ice cream tasters preferred the Strawberry Cream, 30 preferred Choco-Nuts, and 10 loved the Orange Mint. Construct a Pareto chart to represent these preferences as percentages.
A)
B)
C)
D)
Unlock Deck
Unlock for access to all 115 flashcards in this deck.
Unlock Deck
k this deck
32
Solve the problem.
-A car dealer is deciding what kinds of vehicles he should order from the factory. His sales report for the preceding period is shown below. Construct a Pareto chart to represent the sales of each type of vehicle as percentages.
A)
B)
C)
D)
-A car dealer is deciding what kinds of vehicles he should order from the factory. His sales report for the preceding period is shown below. Construct a Pareto chart to represent the sales of each type of vehicle as percentages.
A)
B)
C)
D)
Unlock Deck
Unlock for access to all 115 flashcards in this deck.
Unlock Deck
k this deck
33
Make a bar graph to represent the data.
-The following table shows the number of male infants born at Hospital X on New Year's Day (Jan. 1). Create a bar graph for the data.
-The following table shows the number of male infants born at Hospital X on New Year's Day (Jan. 1). Create a bar graph for the data.
Unlock Deck
Unlock for access to all 115 flashcards in this deck.
Unlock Deck
k this deck
34
A nurse measured the blood pressure of each person who visited her clinic. Following is a relative-frequency histogram for the systolic blood pressure readings for those people aged between 25 and 40. Use the histogram to answer the question. The blood pressure readings were given to the nearest whole number.
-Given that 700 people were aged between 25 and 40, approximately how many had a systolic blood pressure reading of 140 or higher?
A)11
B)56
C)8
D)77
-Given that 700 people were aged between 25 and 40, approximately how many had a systolic blood pressure reading of 140 or higher?
A)11
B)56
C)8
D)77
Unlock Deck
Unlock for access to all 115 flashcards in this deck.
Unlock Deck
k this deck
35
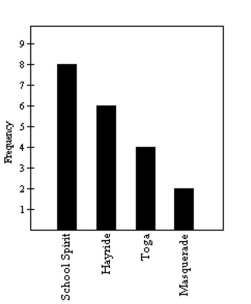
Solve the problem.
-The Kappa Iota Sigma Fraternity polled its members on the weekend party theme. The vote was as follows: six for toga, four for hayride, eight for school spirit, and two for masquerade. Display the vote count in a Pareto chart.
A)
B)
C)
D)
-The Kappa Iota Sigma Fraternity polled its members on the weekend party theme. The vote was as follows: six for toga, four for hayride, eight for school spirit, and two for masquerade. Display the vote count in a Pareto chart.
A)
B)
C)
D)
Unlock Deck
Unlock for access to all 115 flashcards in this deck.
Unlock Deck
k this deck
36
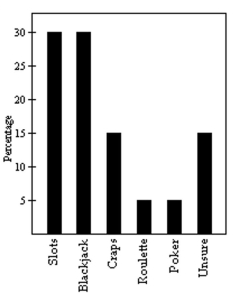
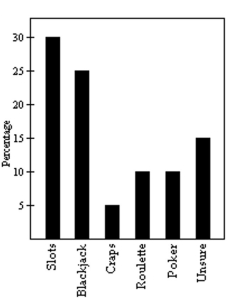
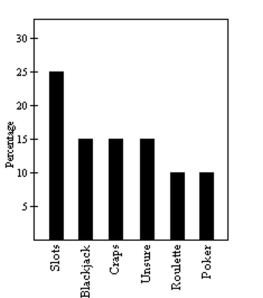
Solve the problem.
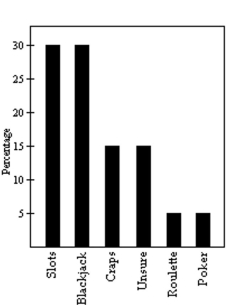
-200 casino patrons, were interviewed as they left the casino. 60 of them said they spent most of the time playing the slots. 60 of them said they played blackjack. 30 said they played craps. 10 said roulette. 10 said poker. The rest were not sure what they played the most. Construct a Pareto chart to depict the gaming practices of the group of casino goers as percentages.
A)
B)
C)
D)
Unlock Deck
Unlock for access to all 115 flashcards in this deck.
Unlock Deck
k this deck
37
Make a bar graph to represent the data.
-The following table shows the number of inches of rainfall measured at City X during the following days. Create a bar graph for the data.
-The following table shows the number of inches of rainfall measured at City X during the following days. Create a bar graph for the data.
Unlock Deck
Unlock for access to all 115 flashcards in this deck.
Unlock Deck
k this deck
38
A nurse measured the blood pressure of each person who visited her clinic. Following is a relative-frequency histogram for the systolic blood pressure readings for those people aged between 25 and 40. Use the histogram to answer the question. The blood pressure readings were given to the nearest whole number.
-Approximately what percentage of the people aged 25-40 had a systolic blood pressure reading between 110 and 139 inclusive?
A)74%
B)89%
C)39%
D)59%
-Approximately what percentage of the people aged 25-40 had a systolic blood pressure reading between 110 and 139 inclusive?
A)74%
B)89%
C)39%
D)59%
Unlock Deck
Unlock for access to all 115 flashcards in this deck.
Unlock Deck
k this deck
39
A nurse measured the blood pressure of each person who visited her clinic. Following is a relative-frequency histogram for the systolic blood pressure readings for those people aged between 25 and 40. Use the histogram to answer the question. The blood pressure readings were given to the nearest whole number.
-Identify the midpoint of the third class.
A)120
B)130
C)124
D)125
-Identify the midpoint of the third class.
A)120
B)130
C)124
D)125
Unlock Deck
Unlock for access to all 115 flashcards in this deck.
Unlock Deck
k this deck
40
Make a bar graph to represent the data.
-The table lists the winners of the Wimbledon women's singles title for the years 1976-1995. Construct a bar graph for the given relative frequencies.
-The table lists the winners of the Wimbledon women's singles title for the years 1976-1995. Construct a bar graph for the given relative frequencies.
Unlock Deck
Unlock for access to all 115 flashcards in this deck.
Unlock Deck
k this deck
41
Construct the requested histogram.
-In a college health course, 65 students participated in a physical fitness assessment. One measure used in the assessment was body fat. The body fat percentages for the 65 students is given below. Create a histogram of the data using bins that are 2% wide.
-In a college health course, 65 students participated in a physical fitness assessment. One measure used in the assessment was body fat. The body fat percentages for the 65 students is given below. Create a histogram of the data using bins that are 2% wide.
Unlock Deck
Unlock for access to all 115 flashcards in this deck.
Unlock Deck
k this deck
42
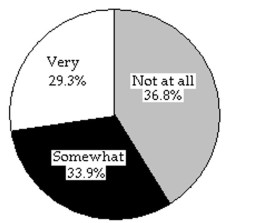
Construct a pie chart representing the given data set.
-The data below represent the results of a poll in which the following question was asked: "To what degree are you
Satisfied with your current health insurance?"
Very
Somewhat
Not at All
No opinion
A)
B)
-The data below represent the results of a poll in which the following question was asked: "To what degree are you
Satisfied with your current health insurance?"
Very
Somewhat
Not at All
No opinion
A)
B)
Unlock Deck
Unlock for access to all 115 flashcards in this deck.
Unlock Deck
k this deck
43
Construct the requested histogram.
-A medical research team studied the ages of patients who had strokes caused by stress. The results of 34 patients are tabulated below. Use the frequency table to construct the corresponding histogram.
-A medical research team studied the ages of patients who had strokes caused by stress. The results of 34 patients are tabulated below. Use the frequency table to construct the corresponding histogram.
Unlock Deck
Unlock for access to all 115 flashcards in this deck.
Unlock Deck
k this deck
44
Construct a pie chart representing the given data set.
-900 movie critics rated a movie. The following data give the rating distribution.
A)
B)
-900 movie critics rated a movie. The following data give the rating distribution.
A)
B)
Unlock Deck
Unlock for access to all 115 flashcards in this deck.
Unlock Deck
k this deck
45
Provide the appropriate response.
The following dot plot represents the ages of the people in a sample selected from a group of campaign
Volunteers.
How many people were in the sample?
A)21
B)28
C)30
D)27
The following dot plot represents the ages of the people in a sample selected from a group of campaign
Volunteers.
How many people were in the sample?
A)21
B)28
C)30
D)27
Unlock Deck
Unlock for access to all 115 flashcards in this deck.
Unlock Deck
k this deck
46
Construct a line chart for the data.
The ages of employees of a company are summarized in the frequency table.
The ages of employees of a company are summarized in the frequency table.
Unlock Deck
Unlock for access to all 115 flashcards in this deck.
Unlock Deck
k this deck
47
A nurse measured the blood pressure of each person who visited her clinic. Following is a relative-frequency histogram for the systolic blood pressure readings for those people aged between 25 and 40. Use the histogram to answer the question. The blood pressure readings were given to the nearest whole number.
-What common class width was used to construct the frequency distribution?
A)11
B)9
C)100
D)10
-What common class width was used to construct the frequency distribution?
A)11
B)9
C)100
D)10
Unlock Deck
Unlock for access to all 115 flashcards in this deck.
Unlock Deck
k this deck
48
Construct a pie chart representing the given data set.
-The following data give the distribution of the types of houses in a town containing 34,000 houses.
A)
B)
-The following data give the distribution of the types of houses in a town containing 34,000 houses.
A)
B)
Unlock Deck
Unlock for access to all 115 flashcards in this deck.
Unlock Deck
k this deck
49
Construct the requested histogram.
-Lake County wanted to find the typical size of farms in their county. The data below shows the sizes (in acres)of the 84 farms located in Lake County. Create a histogram of the data using bins that are 50 acres wide.
-Lake County wanted to find the typical size of farms in their county. The data below shows the sizes (in acres)of the 84 farms located in Lake County. Create a histogram of the data using bins that are 50 acres wide.
Unlock Deck
Unlock for access to all 115 flashcards in this deck.
Unlock Deck
k this deck
50
Construct the requested histogram.
-The following frequency table shows the body temperatures (°F)of randomly selected subjects. Use the frequency table to construct the corresponding histogram.
-The following frequency table shows the body temperatures (°F)of randomly selected subjects. Use the frequency table to construct the corresponding histogram.
Unlock Deck
Unlock for access to all 115 flashcards in this deck.
Unlock Deck
k this deck
51
Provide the appropriate response.
A manufacturer records the number of errors each work station makes during the week. The data are as follows.
6 3 2 3 5 2 0 2 5 4 2 0 1
Create a dot plot for this data.
A manufacturer records the number of errors each work station makes during the week. The data are as follows.
6 3 2 3 5 2 0 2 5 4 2 0 1
Create a dot plot for this data.
Unlock Deck
Unlock for access to all 115 flashcards in this deck.
Unlock Deck
k this deck
52
Construct a line chart for the data.
Unlock Deck
Unlock for access to all 115 flashcards in this deck.
Unlock Deck
k this deck
53
Provide the appropriate response.
The following dot plot represents the ages of the customers who visited a sporting goods store on a particular
Monday.
How many people in the sample were aged between 20 and 28, inclusive?
A)13
B)10
C)9
D)6
The following dot plot represents the ages of the customers who visited a sporting goods store on a particular
Monday.
How many people in the sample were aged between 20 and 28, inclusive?
A)13
B)10
C)9
D)6
Unlock Deck
Unlock for access to all 115 flashcards in this deck.
Unlock Deck
k this deck
54
Construct the requested histogram.
-The number of days off that 30 police officers took in a given year are provided below. Create a histogram of the data using bins 2 days wide.
-The number of days off that 30 police officers took in a given year are provided below. Create a histogram of the data using bins 2 days wide.
Unlock Deck
Unlock for access to all 115 flashcards in this deck.
Unlock Deck
k this deck
55
Provide the appropriate response.
-Attendance records at a school show the number of days each student was absent during the year. The days absent for each student were as follows.
Create a dot plot for this data.
A)
B)
C)
D)
-Attendance records at a school show the number of days each student was absent during the year. The days absent for each student were as follows.
Create a dot plot for this data.
A)
B)
C)
D)
Unlock Deck
Unlock for access to all 115 flashcards in this deck.
Unlock Deck
k this deck
56
Construct a line chart for the data.
-
A)
B)
C)
D) None of the above
-
A)
B)
C)
D) None of the above
Unlock Deck
Unlock for access to all 115 flashcards in this deck.
Unlock Deck
k this deck
57
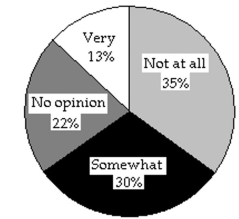
Construct a pie chart representing the given data set.
-The data below represent the results of a poll in which the the following question was asked: "To what degree are you
Satisfied with the outcome of the 2006 mayoral election?"
A)
B)
-The data below represent the results of a poll in which the the following question was asked: "To what degree are you
Satisfied with the outcome of the 2006 mayoral election?"
A)
B)
Unlock Deck
Unlock for access to all 115 flashcards in this deck.
Unlock Deck
k this deck
58
Construct the requested histogram.
-The data below is the number of hours of homework done as reported by 24 high school juniors for the last week September, 1996.
6, 5, 6, 4, 6, 6, 9, 7, 6, 3, 8, 5, 5, 8, 6, 5, 8, 6, 5, 7, 5, 8, 7, 4
Using bins of 2 hours width beginning at 3, construct the relative frequency histogram.
-The data below is the number of hours of homework done as reported by 24 high school juniors for the last week September, 1996.
6, 5, 6, 4, 6, 6, 9, 7, 6, 3, 8, 5, 5, 8, 6, 5, 8, 6, 5, 7, 5, 8, 7, 4
Using bins of 2 hours width beginning at 3, construct the relative frequency histogram.
Unlock Deck
Unlock for access to all 115 flashcards in this deck.
Unlock Deck
k this deck
59
Construct a line chart for the data.
A medical research team studied the ages of patients who had strokes caused by stress. The results of 34
Patients are as follows:
A medical research team studied the ages of patients who had strokes caused by stress. The results of 34
Patients are as follows:
Unlock Deck
Unlock for access to all 115 flashcards in this deck.
Unlock Deck
k this deck
60
Construct a pie chart representing the given data set.
-The following figures give the distribution of land (in acres)for a county containing 78,000 acres.
A)
B)
-The following figures give the distribution of land (in acres)for a county containing 78,000 acres.
A)
B)
Unlock Deck
Unlock for access to all 115 flashcards in this deck.
Unlock Deck
k this deck
61
Provide an appropriate response.
-Construct a frequency table and the corresponding histogram in which the following conditions are satisfied:
- The frequency for the second class is twice the frequency of the first class
- In the histogram, the area of the bar corresponding to the second class is four times the area of the bar corresponding to the first class
Unlock Deck
Unlock for access to all 115 flashcards in this deck.
Unlock Deck
k this deck
62
Provide an appropriate response.
-Shortly before a mayoral election, a market research firm took a poll to find out which candidate people were planning to vote for. The results are shown below.
You wish to construct a graph to represent the data. It should be easy to see from your graph which candidate is in the lead. Which graph would be more useful, a bar graph or a pie chart? Explain your thinking.
Unlock Deck
Unlock for access to all 115 flashcards in this deck.
Unlock Deck
k this deck
63
Solve the problem.
Unlock Deck
Unlock for access to all 115 flashcards in this deck.
Unlock Deck
k this deck
64
Solve the problem.
-The weights of 22 members of the varsity football team are listed below.
A)
B)
C)
D)
-The weights of 22 members of the varsity football team are listed below.
A)
B)
C)
D)
Unlock Deck
Unlock for access to all 115 flashcards in this deck.
Unlock Deck
k this deck
65
Provide an appropriate response.
-Explain the difference between a frequency distribution and a relative frequency distribution. Comment on the differences on the vertical axis scale. Given the same data set and the same classes, will the shapes of the frequency distribution and the relative frequency distribution be the same? You may draw a diagram to support your answer.
-Explain the difference between a frequency distribution and a relative frequency distribution. Comment on the differences on the vertical axis scale. Given the same data set and the same classes, will the shapes of the frequency distribution and the relative frequency distribution be the same? You may draw a diagram to support your answer.
Unlock Deck
Unlock for access to all 115 flashcards in this deck.
Unlock Deck
k this deck
66
Provide an appropriate response.
-Suppose that you construct a histogram and a relative frequency histogram corresponding to a particular frequency table. In what ways will the two histograms be similar? In what ways will they differ?
-Suppose that you construct a histogram and a relative frequency histogram corresponding to a particular frequency table. In what ways will the two histograms be similar? In what ways will they differ?
Unlock Deck
Unlock for access to all 115 flashcards in this deck.
Unlock Deck
k this deck
67
Solve the problem.
-The attendance counts for this season's basketball games are listed below.
Use the data to construct a stem-and-leaf plot.
A)
B)
C)
D)
-The attendance counts for this season's basketball games are listed below.
Use the data to construct a stem-and-leaf plot.
A)
B)
C)
D)
Unlock Deck
Unlock for access to all 115 flashcards in this deck.
Unlock Deck
k this deck
68
Provide an appropriate response.
-Suppose that you want to construct a pie chart to represent the following data.
Explain how you would calculate the angle for the pie-shaped piece corresponding to the blood type O.
-Suppose that you want to construct a pie chart to represent the following data.
Explain how you would calculate the angle for the pie-shaped piece corresponding to the blood type O.
Unlock Deck
Unlock for access to all 115 flashcards in this deck.
Unlock Deck
k this deck
69
Provide an appropriate response.
-Suppose that a histogram is constructed for the frequency table shown below:
The class 60-69 has twice the frequency of the class 70-89. In the histogram, will the area of the bar for the class 60-69 be twice the area of the bar for the class 70-89? In other words, will areas be proportional to frequencies in this histogram? Explain your thinking. Are there any conditions under which areas are proportional to frequencies in histograms?
Unlock Deck
Unlock for access to all 115 flashcards in this deck.
Unlock Deck
k this deck
70
A machine is supposed to fill juice bottles with 16 fluid ounces of juice. The manufacturer picks a sample of bottles which have been filled by the machine and determines the volume of juice in each bottle. The results are shown in the stem-and-leaf diagram below. The leaf unit is 0.1.
How many bottles were sampled?
A)46
B)16
C)44
D)10
How many bottles were sampled?
A)46
B)16
C)44
D)10
Unlock Deck
Unlock for access to all 115 flashcards in this deck.
Unlock Deck
k this deck
71
Solve the problem.
Unlock Deck
Unlock for access to all 115 flashcards in this deck.
Unlock Deck
k this deck
72
A machine is supposed to fill juice bottles with 16 fluid ounces of juice. The manufacturer picks a sample of bottles which have been filled by the machine and determines the volume of juice in each bottle. The results are shown in the stem-and-leaf diagram below. The leaf unit is 0.1.
What is the smallest volume of juice (in fluid ounces)measured for the bottles sampled?
A)15 fluid ounces
B)151 fluid ounces
C)15.1 fluid ounces
D)16 fluid ounces
What is the smallest volume of juice (in fluid ounces)measured for the bottles sampled?
A)15 fluid ounces
B)151 fluid ounces
C)15.1 fluid ounces
D)16 fluid ounces
Unlock Deck
Unlock for access to all 115 flashcards in this deck.
Unlock Deck
k this deck
73
The stem-and-leaf diagram below shows the highest wind velocity ever recorded in 30 different U.S. cities. The velocities are given in miles per hour. The leaf unit is 1.0.
What is the highest wind velocity recorded in these cities?
A)9.9 miles per hour
B)9.5 miles per hour
C)95 miles per hour
D)99 miles per hour
What is the highest wind velocity recorded in these cities?
A)9.9 miles per hour
B)9.5 miles per hour
C)95 miles per hour
D)99 miles per hour
Unlock Deck
Unlock for access to all 115 flashcards in this deck.
Unlock Deck
k this deck
74
Provide an appropriate response.
-Consider the frequency table below which has single values as classes:
Construct a new frequency table for this data with 4 classes. Now construct another frequency table for this data with 6
classes. Suppose that you construct a histogram corresponding to the original data and histograms corresponding to
each of the new frequency tables. Describe the shapes of the three histograms. Does the histogram with six classes
capture the distribution of the data? Does the histogram with four classes capture the distribution of the data?
Unlock Deck
Unlock for access to all 115 flashcards in this deck.
Unlock Deck
k this deck
75
Solve the problem.
-Twenty-four workers were surveyed about how long it takes them to travel to work each day. The data below are given in minutes.
Use the data to construct a stem-and-leaf plot.
A)
B)
C)
D)
-Twenty-four workers were surveyed about how long it takes them to travel to work each day. The data below are given in minutes.
Use the data to construct a stem-and-leaf plot.
A)
B)
C)
D)
Unlock Deck
Unlock for access to all 115 flashcards in this deck.
Unlock Deck
k this deck
76
Solve the problem.
-Use the high closing values of Naristar Inc. stock from the years 1992 - 2003 to construct a time-series graph.
(Let x = 0 stand for 1992 and so on...)Identify a trend.
-Use the high closing values of Naristar Inc. stock from the years 1992 - 2003 to construct a time-series graph.
(Let x = 0 stand for 1992 and so on...)Identify a trend.
Unlock Deck
Unlock for access to all 115 flashcards in this deck.
Unlock Deck
k this deck
77
Provide an appropriate response.
-Explain in your own words the difference between a bar graph and a histogram. Give an example of data for which you might use a histogram and an example of data for which you might use a bar graph.
-Explain in your own words the difference between a bar graph and a histogram. Give an example of data for which you might use a histogram and an example of data for which you might use a bar graph.
Unlock Deck
Unlock for access to all 115 flashcards in this deck.
Unlock Deck
k this deck
78
Provide an appropriate response.
-Suppose that you want to construct a graph to represent the following data.
If you are mostly interested in the number of people in each category as a percentage of the total number of people, would a bar chart or a pie chart be more useful? Explain your thinking.
-Suppose that you want to construct a graph to represent the following data.
If you are mostly interested in the number of people in each category as a percentage of the total number of people, would a bar chart or a pie chart be more useful? Explain your thinking.
Unlock Deck
Unlock for access to all 115 flashcards in this deck.
Unlock Deck
k this deck
79
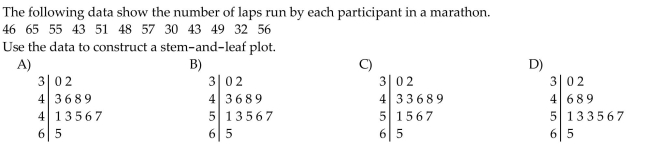
Solve the problem.
Use the high closing values of Naristar Inc. stock from the years 1990 - 2001 to construct a time-series graph.
(Let x = 0 stand for 1990 and so on...)Identify a trend.
Use the high closing values of Naristar Inc. stock from the years 1990 - 2001 to construct a time-series graph.
(Let x = 0 stand for 1990 and so on...)Identify a trend.
Unlock Deck
Unlock for access to all 115 flashcards in this deck.
Unlock Deck
k this deck
80
The stem-and-leaf diagram below shows the highest wind velocity ever recorded in 30 different U.S. cities. The velocities are given in miles per hour. The leaf unit is 1.0.
How many of the maximum wind velocities are 85 miles per hour or higher?
A) 7
B) 18
C) 17
D) 2
How many of the maximum wind velocities are 85 miles per hour or higher?
A) 7
B) 18
C) 17
D) 2
Unlock Deck
Unlock for access to all 115 flashcards in this deck.
Unlock Deck
k this deck
Unlock Deck
Unlock for access to all 115 flashcards in this deck.


