Deck 9: Multiple Regression
Full screen (f)
Question
Question
Question
Question
A sample of 33 companies was randomly selected and data collected on the average annual
Bonus, turnover rate (%), and trust index (measured on a scale of 0 - 100).According to the
Output is shown below, what is the estimated multiple regression model?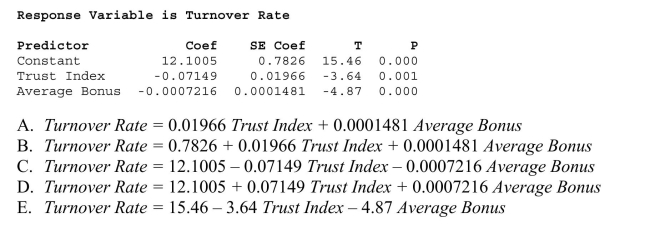
Bonus, turnover rate (%), and trust index (measured on a scale of 0 - 100).According to the
Output is shown below, what is the estimated multiple regression model?
Question
Question
Question
Question
Question
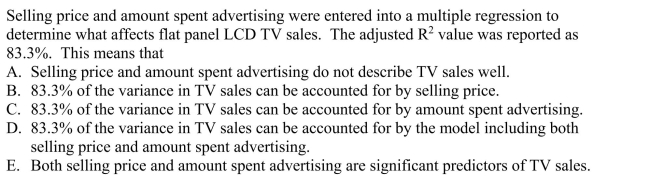
Selling price and amount spent advertising were entered into a multiple regression to Determine what affects flat panel LCD TV sales.The plot of residuals versus predicted Values is shown below.What does the residual plot suggest? 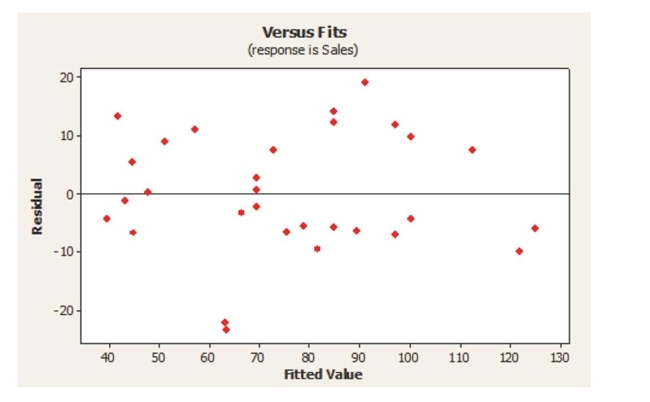
A)The Linearity condition is not satisfied.
B)There is an extreme departure from normality.
C)The variance is not constant.
D)The presence of a couple of outliers.
E)The plot thickens from left to right.
A)The Linearity condition is not satisfied.
B)There is an extreme departure from normality.
C)The variance is not constant.
D)The presence of a couple of outliers.
E)The plot thickens from left to right.
Question
Question
Question
Question
Question
Question
Question

Unlock Deck
Sign up to unlock the cards in this deck!
Unlock Deck
Unlock Deck
1/16
Play
Full screen (f)
Deck 9: Multiple Regression
1
Selling price and amount spent advertising were entered into a multiple regression to Determine what affects flat panel LCD TV sales.Based on the output below, which of the Following statements is/are true?
A)The multiple regression model is significant overall.
B)Selling Price is a significant independent variable in explaining Bravia sales.
C)Amount Spent on Advertising is a significant independent variable in explaining Bravia sales.
D)Only A and B
E)A, B and C
A)The multiple regression model is significant overall.
B)Selling Price is a significant independent variable in explaining Bravia sales.
C)Amount Spent on Advertising is a significant independent variable in explaining Bravia sales.
D)Only A and B
E)A, B and C
A, B and C
2
Using the output below, calculate the predicted turnover rate for a company having a trust Index score of 70 and an average annual bonus of $6500.
A)
B)
C)
D)
E) None of the above.
A)
B)
C)
D)
E) None of the above.
3
Selling price and amount spent advertising were entered into a multiple regression to
Determine what affects flat panel LCD TV sales.Use the output shown below, calculate the
Amount of variability in Sales is explained by the estimated multiple regression model.
A)
B)
C)
D)
E) None of the above.
Determine what affects flat panel LCD TV sales.Use the output shown below, calculate the
Amount of variability in Sales is explained by the estimated multiple regression model.
A)
B)
C)
D)
E) None of the above.
4
A sample of 33 companies was randomly selected and data collected on the average annual
Bonus, turnover rate (%), and trust index (measured on a scale of 0 - 100).According to the
Output is shown below, what is the estimated multiple regression model?
Bonus, turnover rate (%), and trust index (measured on a scale of 0 - 100).According to the
Output is shown below, what is the estimated multiple regression model?
Unlock Deck
Unlock for access to all 16 flashcards in this deck.
Unlock Deck
k this deck
5
A sample of 33 companies was randomly selected and data collected on the average annual Bonus, turnover rate (%), and trust index (measured on a scale of 0 - 100).Using the output Below, and a significance level of ? = .01, we can conclude that
A)The multiple regression model is significant overall.
B)Trust Index is a significant independent variable in explaining turnover rate.
C)Average Annual Bonus is a significant independent variable in explaining turnover rate.
D)The predictor Constant is a significant independent variable in explaining turnover rate.
E)All of these.
Unlock Deck
Unlock for access to all 16 flashcards in this deck.
Unlock Deck
k this deck
6
Selling price and amount spent advertising were entered into a multiple regression to Determine what affects flat panel LCD TV sales.The regression coefficient for Price was Found to be -0.03055, which of the following is the correct interpretation for this value?
A)Increasing the price of the Sony Bravia by $100 will result in at least 3 fewer TV's sold.
B)For a given amount spent on advertising, a $100 increase in price of the Sony Bravia is associated with a decrease in sales of 3.055 units, on average.
C)Holding the amount spent on advertising constant, an increase of $100 in the price of the Sony Bravia will decrease sales by 3.055 units.
D)Holding the amount spent on advertising constant, an increase of $100 in the price of the Sony Bravia will decrease sales by .03%.
E)None of the above.
Unlock Deck
Unlock for access to all 16 flashcards in this deck.
Unlock Deck
k this deck
7
A sample of 33 companies was randomly selected and data collected on the average annual Bonus, turnover rate (%), and trust index (measured on a scale of 0 - 100).Based on the Output, how much of the variability in Turnover Rate is explained by the estimated multiple Regression model?
A)
B)
C)
D)
E) None of the above.
A)
B)
C)
D)
E) None of the above.
Unlock Deck
Unlock for access to all 16 flashcards in this deck.
Unlock Deck
k this deck
8
In regression an observation has high leverage when
A)the observation has a combination of x-values that is far from the center of the data.
B)the observation is perfectly predicted by the regression.
C)the observation is poorly predicted by the regression.
D)removing the observation causes a large change in one of more coefficients of the model.
E)none of these
Unlock Deck
Unlock for access to all 16 flashcards in this deck.
Unlock Deck
k this deck
9
Selling price and amount spent advertising were entered into a multiple regression to Determine what affects flat panel LCD TV sales.The plot of residuals versus predicted Values is shown below.What does the residual plot suggest?
A)The Linearity condition is not satisfied.
B)There is an extreme departure from normality.
C)The variance is not constant.
D)The presence of a couple of outliers.
E)The plot thickens from left to right.
A)The Linearity condition is not satisfied.
B)There is an extreme departure from normality.
C)The variance is not constant.
D)The presence of a couple of outliers.
E)The plot thickens from left to right.
Unlock Deck
Unlock for access to all 16 flashcards in this deck.
Unlock Deck
k this deck
10
Unlock Deck
Unlock for access to all 16 flashcards in this deck.
Unlock Deck
k this deck
11
Which of the following are NOT characteristics of a good regression model?
A)a relatively high
B)a relatively low value of s (the standard deviation of the residuals)
C)relatively few predictor variables
D)relatively small p-values for the F- and t-statistics
E)All of these are characteristics of a good regression model.
A)a relatively high
B)a relatively low value of s (the standard deviation of the residuals)
C)relatively few predictor variables
D)relatively small p-values for the F- and t-statistics
E)All of these are characteristics of a good regression model.
Unlock Deck
Unlock for access to all 16 flashcards in this deck.
Unlock Deck
k this deck
12
Selling price and amount spent advertising were entered into a multiple regression to Determine what affects flat panel LCD TV sales.Using the output below, calculated F Statistic to determine the overall significance of the estimated multiple regression model is
A)
B)
C)
D)
E) None of the above
A)
B)
C)
D)
E) None of the above
Unlock Deck
Unlock for access to all 16 flashcards in this deck.
Unlock Deck
k this deck
13
A sample of 33 companies was randomly selected and data collected on the average annual Bonus, turnover rate (%), and trust index (measured on a scale of 0 - 100).According to the Output below, what is the F statistic to determine the overall significance of the estimated is?
A)
B)
C)
D)
E)
A)
B)
C)
D)
E)
Unlock Deck
Unlock for access to all 16 flashcards in this deck.
Unlock Deck
k this deck
14
The problem of collinearity occurs when
A)there is an influential observation in the data set.
B)at least one predictor var.has a nonlinear relationship with the response variable.
C)two or more predictor variables are linearly related to each other.
D)more than one predictor variable is linearly related to the response variable.
E)none of these
Unlock Deck
Unlock for access to all 16 flashcards in this deck.
Unlock Deck
k this deck
15
Selling price and amount spent advertising were entered into a multiple regression to Determine what affects flat panel LCD TV sales.The correct null and alternative hypotheses For testing the regression coefficient of Price is
A) vs.
B) vs.
C) vs.
D) vs.
E) The regression is not significant vs. : The regression is significant.
A) vs.
B) vs.
C) vs.
D) vs.
E) The regression is not significant vs. : The regression is significant.
Unlock Deck
Unlock for access to all 16 flashcards in this deck.
Unlock Deck
k this deck
16
A sample of 33 companies was randomly selected and data collected on the average annual Bonus, turnover rate (%), and trust index (measured on a scale of 0 - 100).In a multiple Regression estimating turnover rate using average bonus and trust index, what is the correct Null hypotheses for testing the regression coefficient of Trust Index?
A)
B)
C)
D)
E)
A)
B)
C)
D)
E)
Unlock Deck
Unlock for access to all 16 flashcards in this deck.
Unlock Deck
k this deck
Unlock Deck
Unlock for access to all 16 flashcards in this deck.


