Deck 6: Scatterplots, Association, and Correlation
Full screen (f)
Question
Question
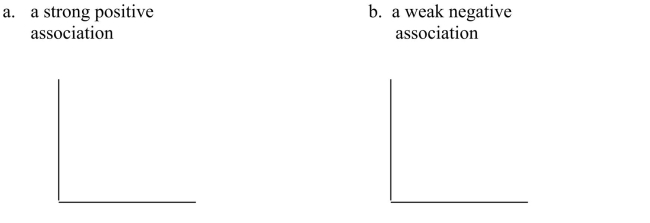
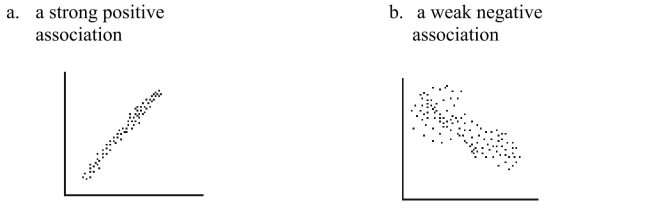
On the axes below, sketch a scatterplot described:
Question
The scatterplot shows monthly sales figures (in units) and number of months of experience For a sample of salespeople. 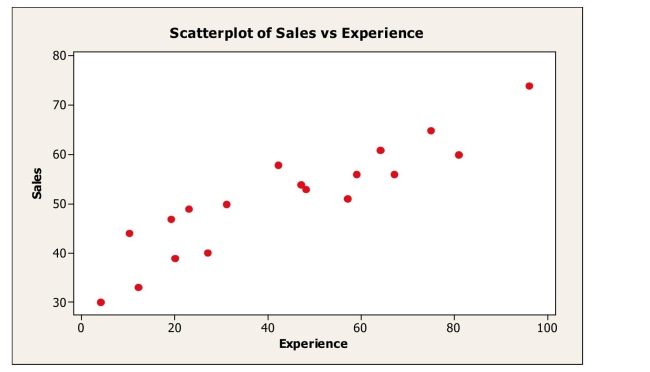
The association between monthly sales and level of experience can be described as
A)positive and weak.
B)negative and weak.
C)negative and strong.
D)positive and strong.
E)nonlinear.
The association between monthly sales and level of experience can be described as
A)positive and weak.
B)negative and weak.
C)negative and strong.
D)positive and strong.
E)nonlinear.
Question
Question
Question
Question
The scatterplot shows monthly sales figures (in units) and number of months of experience For a sample of salespeople. 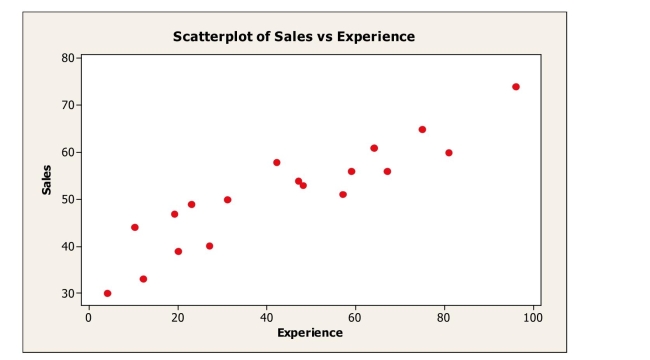
The correlation between monthly sales and level of experience is most likely
A)-.235.
B)0.
C).180.
D)-.914.
E).914.
The correlation between monthly sales and level of experience is most likely
A)-.235.
B)0.
C).180.
D)-.914.
E).914.
Question
Question
For the following scatterplot,
The likely correlation coefficient is
A)+0.35
B)+0.90
C)+0.77
D)-0.89
E)-1.00
The likely correlation coefficient is
A)+0.35
B)+0.90
C)+0.77
D)-0.89
E)-1.00
Question
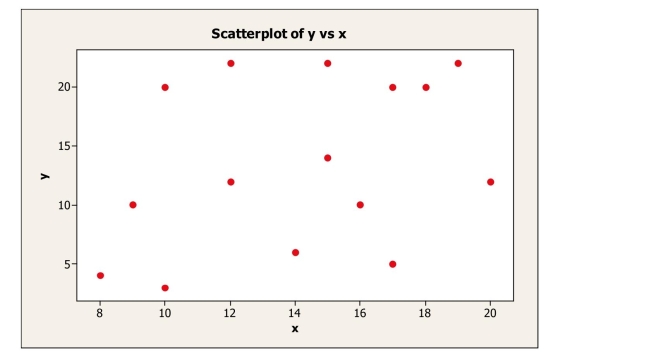
The following scatterplot shows a relationship between x and y that results in a correlation coefficient of r = 0.Explain why r = 0 in this situation even though there appears to be a strong relationship between the x and y variables. 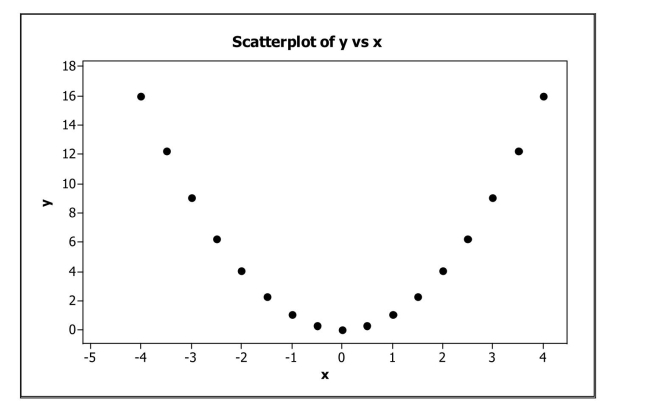
Question
Question
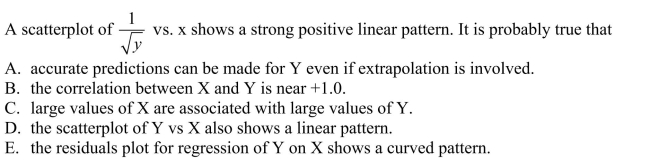
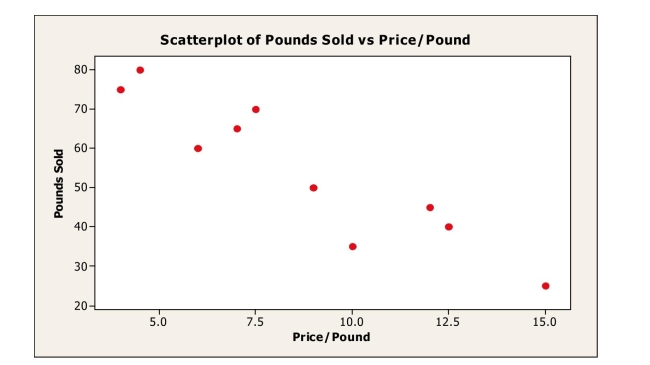
A small independent organic food store offers a variety of specialty coffees.To determine Whether price has an impact on sales, the managers kept track of how many pounds of each Variety of coffee were sold last month.
Based on the scatterplot, the linear relationship between number of pounds of coffee sold per
Week and price is
A)strong and positive.
B)strong and negative.
C)weak and negative.
D)weak and positive.
E)nonexistent.
Based on the scatterplot, the linear relationship between number of pounds of coffee sold per
Week and price is
A)strong and positive.
B)strong and negative.
C)weak and negative.
D)weak and positive.
E)nonexistent.
Question
Question
Question
Question
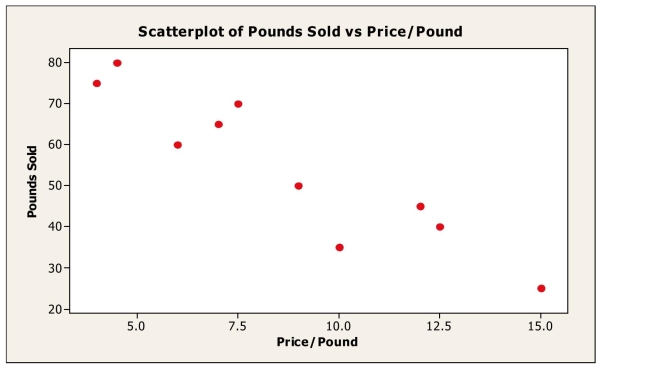
The following scatterplot shows the relationship between the time (in seconds) it took men to run the 1500m race for the gold medal and the year of the Olympics that the race was run in: 
a.Write a few sentences describing the association.
b.Estimate the correlation. _________
a.Write a few sentences describing the association.
b.Estimate the correlation. _________
Question
Question
A consumer research group examining the relationship between the price of meat (per pound) And fat content (in grams) gathered data that produced the following scatterplot.
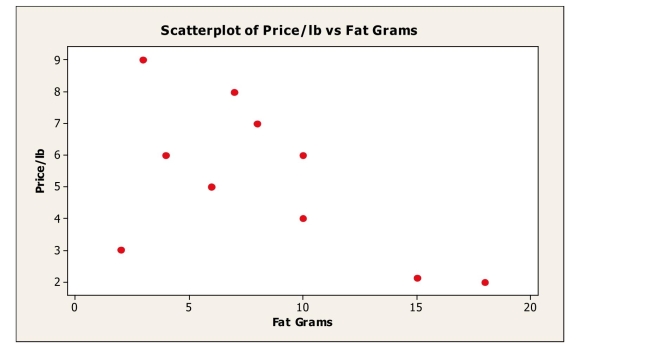
If the point in the lower left hand corner (2 grams of fat; $3.00 per pound) is removed, the Correlation would most likely
A)remain the same.
B)become positive.
C)become weaker negative.
D)become stronger negative.
E)become zero.
If the point in the lower left hand corner (2 grams of fat; $3.00 per pound) is removed, the Correlation would most likely
A)remain the same.
B)become positive.
C)become weaker negative.
D)become stronger negative.
E)become zero.
Question
A small independent organic food store offers a variety of specialty coffees.To determine Whether price has an impact on sales, the managers kept track of how many pounds of each Variety of coffee were sold last month.Based on the scatterplot shown below, which of the Following statements is true?
A)The quantitative variable condition is satisfied.
B)The linearity condition is satisfied.
C)There are no obvious outliers.
D)All of the above.
E)None of the above.
A)The quantitative variable condition is satisfied.
B)The linearity condition is satisfied.
C)There are no obvious outliers.
D)All of the above.
E)None of the above.
Question
Question
Question
Question
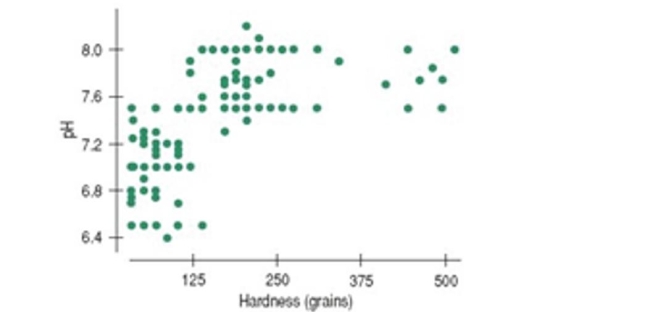
In a study of streams in the Adirondack Mountains, the following relationship was found Between the water's pH and its hardness (measured in grains).Is it appropriate to summarize The strength of association with a correlation?
A)All the conditions for correlation are met.
B)The scatterplot has outliers; correlation is not appropriate.
C)The scatterplot is not linear; correlation is not appropriate.
D)The variables are not quantitative; correlation is not appropriate.
E)None of the above.
A)All the conditions for correlation are met.
B)The scatterplot has outliers; correlation is not appropriate.
C)The scatterplot is not linear; correlation is not appropriate.
D)The variables are not quantitative; correlation is not appropriate.
E)None of the above.
Question
Question
Question

Unlock Deck
Sign up to unlock the cards in this deck!
Unlock Deck
Unlock Deck
1/26
Play
Full screen (f)
Deck 6: Scatterplots, Association, and Correlation
1
The disadvantage of re-expressing variables is that
A)We have to explain the association in terms of the transformed variables.
B)We cannot use the standard regression models
C)It is not commonly used
D)It can be difficult
E)A and D
A)We have to explain the association in terms of the transformed variables.
B)We cannot use the standard regression models
C)It is not commonly used
D)It can be difficult
E)A and D
E
2
On the axes below, sketch a scatterplot described:
3
The scatterplot shows monthly sales figures (in units) and number of months of experience For a sample of salespeople.
The association between monthly sales and level of experience can be described as
A)positive and weak.
B)negative and weak.
C)negative and strong.
D)positive and strong.
E)nonlinear.
The association between monthly sales and level of experience can be described as
A)positive and weak.
B)negative and weak.
C)negative and strong.
D)positive and strong.
E)nonlinear.
positive and strong.
4
The National Sleep Foundation reported a moderately strong positive association between the number of hours of sleep a person gets and the person's ability to listen, learn, and solve
problems.
a.Explain in the context of this problem what "positive association" means.
b.Hoping to improve academic performance, the professor recommends allowing students to take a nap prior to taking midterms and finals.Discuss the professor's recommendations.
problems.
a.Explain in the context of this problem what "positive association" means.
b.Hoping to improve academic performance, the professor recommends allowing students to take a nap prior to taking midterms and finals.Discuss the professor's recommendations.
Unlock Deck
Unlock for access to all 26 flashcards in this deck.
Unlock Deck
k this deck
5
Shown below is a correlation table showing correlation coefficients between stock price, Earnings per share (EPS) and price/earnings (P/E) ratio for a sample of 19 publicly traded Companies.Which of the following statements is false?
A)EPS is the best predictor of stock price.
B)The strongest correlation is between EPS and stock price.
C)There is a weak negative association between PE and EPS.
D)PE is the best predictor of stock price.
A)EPS is the best predictor of stock price.
B)The strongest correlation is between EPS and stock price.
C)There is a weak negative association between PE and EPS.
D)PE is the best predictor of stock price.
Unlock Deck
Unlock for access to all 26 flashcards in this deck.
Unlock Deck
k this deck
6
Given the increase of people carrying their pets in public, a news reporter takes a survey of individuals about this trend.The reporter concludes, "There appears to be a strong correlation between bringing your pet to public places and the happiness of an individual." Comment on this observation.
Unlock Deck
Unlock for access to all 26 flashcards in this deck.
Unlock Deck
k this deck
7
The scatterplot shows monthly sales figures (in units) and number of months of experience For a sample of salespeople.
The correlation between monthly sales and level of experience is most likely
A)-.235.
B)0.
C).180.
D)-.914.
E).914.
The correlation between monthly sales and level of experience is most likely
A)-.235.
B)0.
C).180.
D)-.914.
E).914.
Unlock Deck
Unlock for access to all 26 flashcards in this deck.
Unlock Deck
k this deck
8
A correlation of zero between two quantitative variables means that
A)there is no linear association between the two variables.
B)re-expressing the data will guarantee a linear association between the two variables.
C)there is no association between the two variables.
D)we have done something wrong in our calculation of r.
E)none of these
A)there is no linear association between the two variables.
B)re-expressing the data will guarantee a linear association between the two variables.
C)there is no association between the two variables.
D)we have done something wrong in our calculation of r.
E)none of these
Unlock Deck
Unlock for access to all 26 flashcards in this deck.
Unlock Deck
k this deck
9
For the following scatterplot,
The likely correlation coefficient is
A)+0.35
B)+0.90
C)+0.77
D)-0.89
E)-1.00
The likely correlation coefficient is
A)+0.35
B)+0.90
C)+0.77
D)-0.89
E)-1.00
Unlock Deck
Unlock for access to all 26 flashcards in this deck.
Unlock Deck
k this deck
10
The following scatterplot shows a relationship between x and y that results in a correlation coefficient of r = 0.Explain why r = 0 in this situation even though there appears to be a strong relationship between the x and y variables.
Unlock Deck
Unlock for access to all 26 flashcards in this deck.
Unlock Deck
k this deck
11
Unlock Deck
Unlock for access to all 26 flashcards in this deck.
Unlock Deck
k this deck
12
A small independent organic food store offers a variety of specialty coffees.To determine Whether price has an impact on sales, the managers kept track of how many pounds of each Variety of coffee were sold last month.
Based on the scatterplot, the linear relationship between number of pounds of coffee sold per
Week and price is
A)strong and positive.
B)strong and negative.
C)weak and negative.
D)weak and positive.
E)nonexistent.
Based on the scatterplot, the linear relationship between number of pounds of coffee sold per
Week and price is
A)strong and positive.
B)strong and negative.
C)weak and negative.
D)weak and positive.
E)nonexistent.
Unlock Deck
Unlock for access to all 26 flashcards in this deck.
Unlock Deck
k this deck
13
All but one of these statements contain a mistake.Which could be true?
A)The correlation between a car's length and its fuel efficiency is 0.71 miles per gallon.
B)There is a correlation of 0.63 between gender and political party.
C)There is a high correlation (1.09) between height of a corn stalk and its age in weeks.
D)The correlation between the amount of fertilizer used and the yield of beans is 0.42.
E)The correlation between a football player's weight and the position he plays is 0.54.
Unlock Deck
Unlock for access to all 26 flashcards in this deck.
Unlock Deck
k this deck
14
After conducting a survey of his students, a professor reported that "There appears to be a strong correlation between grade point average and whether or not a student looks at his or her phone during class." Comment on this observation.
Unlock Deck
Unlock for access to all 26 flashcards in this deck.
Unlock Deck
k this deck
15
A supermarket chain gathers data on the amount they spend on promotional material (e.g., Coupons, etc.) and sales revenue generated each quarter.The predictor variable is
A)sales revenue.
B)amount spent on promotional material.
C)number of coupons offered.
D)supermarket chains.
E)none of the above.
A)sales revenue.
B)amount spent on promotional material.
C)number of coupons offered.
D)supermarket chains.
E)none of the above.
Unlock Deck
Unlock for access to all 26 flashcards in this deck.
Unlock Deck
k this deck
16
The following scatterplot shows the relationship between the time (in seconds) it took men to run the 1500m race for the gold medal and the year of the Olympics that the race was run in:
a.Write a few sentences describing the association.
b.Estimate the correlation. _________
a.Write a few sentences describing the association.
b.Estimate the correlation. _________
Unlock Deck
Unlock for access to all 26 flashcards in this deck.
Unlock Deck
k this deck
17
All but one of the statements below contain a mistake.Which one could be true?
A)If the correlation between blood alcohol level and reaction time is 0.73, then the correlation between reaction time and blood alcohol level is -0.73.
B)The correlation between the breed of a dog and its weight is 0.435.
C)The correlation between gender and age is -0.171.
D)The correlation between height and weight is 0.568 inches per pound.
E)The correlation between weight and length of foot is 0.488.
Unlock Deck
Unlock for access to all 26 flashcards in this deck.
Unlock Deck
k this deck
18
A consumer research group examining the relationship between the price of meat (per pound) And fat content (in grams) gathered data that produced the following scatterplot.
If the point in the lower left hand corner (2 grams of fat; $3.00 per pound) is removed, the Correlation would most likely
A)remain the same.
B)become positive.
C)become weaker negative.
D)become stronger negative.
E)become zero.
If the point in the lower left hand corner (2 grams of fat; $3.00 per pound) is removed, the Correlation would most likely
A)remain the same.
B)become positive.
C)become weaker negative.
D)become stronger negative.
E)become zero.
Unlock Deck
Unlock for access to all 26 flashcards in this deck.
Unlock Deck
k this deck
19
A small independent organic food store offers a variety of specialty coffees.To determine Whether price has an impact on sales, the managers kept track of how many pounds of each Variety of coffee were sold last month.Based on the scatterplot shown below, which of the Following statements is true?
A)The quantitative variable condition is satisfied.
B)The linearity condition is satisfied.
C)There are no obvious outliers.
D)All of the above.
E)None of the above.
A)The quantitative variable condition is satisfied.
B)The linearity condition is satisfied.
C)There are no obvious outliers.
D)All of the above.
E)None of the above.
Unlock Deck
Unlock for access to all 26 flashcards in this deck.
Unlock Deck
k this deck
20
A study examined consumption levels of oil and carbon dioxide emissions for sample of Counties.The response variable in this study is
A)oil.
B)oil consumption.
C)carbon dioxide emissions.
D)countries.
E)none of the above.
A)oil.
B)oil consumption.
C)carbon dioxide emissions.
D)countries.
E)none of the above.
Unlock Deck
Unlock for access to all 26 flashcards in this deck.
Unlock Deck
k this deck
21
Another company's sales increase by the same percent each year.This growth is …
A)logarithmic
B)quadratic
C)linear
D)exponential
E)power
A)logarithmic
B)quadratic
C)linear
D)exponential
E)power
Unlock Deck
Unlock for access to all 26 flashcards in this deck.
Unlock Deck
k this deck
22
The correlation between Hours Sleep and Quiz score of the 60 students in your statistics class Is r = -0.34.Which of these possible conclusions is justified:
A)The more you sleep, the better your quiz score will be.
B)The form of the relationship between Hours Sleep and Quiz score is moderately straight.
C)There are several outliers that explain the low correlation.
D)If we measure Sleep in minutes rather than hours, the correlation will increase.
E)There exists a moderately stong, negative association between Gours Sleep and Quiz score.
Unlock Deck
Unlock for access to all 26 flashcards in this deck.
Unlock Deck
k this deck
23
In a study of streams in the Adirondack Mountains, the following relationship was found Between the water's pH and its hardness (measured in grains).Is it appropriate to summarize The strength of association with a correlation?
A)All the conditions for correlation are met.
B)The scatterplot has outliers; correlation is not appropriate.
C)The scatterplot is not linear; correlation is not appropriate.
D)The variables are not quantitative; correlation is not appropriate.
E)None of the above.
A)All the conditions for correlation are met.
B)The scatterplot has outliers; correlation is not appropriate.
C)The scatterplot is not linear; correlation is not appropriate.
D)The variables are not quantitative; correlation is not appropriate.
E)None of the above.
Unlock Deck
Unlock for access to all 26 flashcards in this deck.
Unlock Deck
k this deck
24
The correlation coefficient between the hours that a person is awake during a 24-hour period And the hours that same person is asleep during a 24-hour period is most likely to be
A)near -0.8
B)exactly -1.0
C)exactly +1.0
D)near 0
E)near +0.8
A)near -0.8
B)exactly -1.0
C)exactly +1.0
D)near 0
E)near +0.8
Unlock Deck
Unlock for access to all 26 flashcards in this deck.
Unlock Deck
k this deck
25
A company's sales increase by the same amount each year.This growth is ...
A)quadratic
B)exponential
C)linear
D)logarithmic
A)quadratic
B)exponential
C)linear
D)logarithmic
Unlock Deck
Unlock for access to all 26 flashcards in this deck.
Unlock Deck
k this deck
26
All but one of the statements below contain a mistake.Which one could be true?
A)The correlation between the height of a bean plant and the day is 0.78 in/day.
B)The correlation between the time it takes to get ready in the morning and gender is 0.78.
C)The correlation between your golf score and the number of hours you practice is -0.36.
D)The number of apricots on a tree and the amount of fertilizer have a 1.12 correlation.
E)There is a strong correlation between type of preferred pet and income level.
Unlock Deck
Unlock for access to all 26 flashcards in this deck.
Unlock Deck
k this deck
Unlock Deck
Unlock for access to all 26 flashcards in this deck.


