Deck 2: Displaying and Describing Data
Full screen (f)
Question
The following table shows representative recent closing share prices for a small sample of
Companies based in India in late 2013.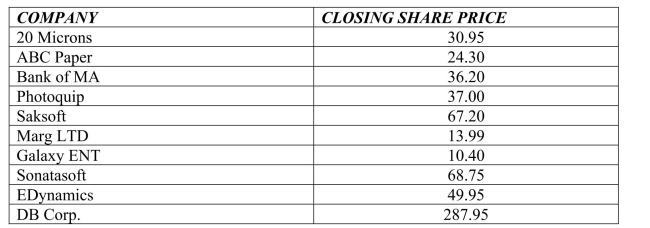
The standard deviation in closing share prices is
A)$81.6.
B)$25.8.
C)$36.6.
D)$62.7.
Companies based in India in late 2013.
The standard deviation in closing share prices is
A)$81.6.
B)$25.8.
C)$36.6.
D)$62.7.
Question
Question
Question
Question
A clothing store uses comment cards to get feedback from its customers about newly added
Items.It recently introduced plus size fashion wear.Customers who purchased the items
Were asked to fill out an online comment survey giving 10% off the next purchasE.The data
Are summarized in the table below.What percentage of customers would be less likely to
Purchase another item (Less or Not fully satisfied)?
A)10%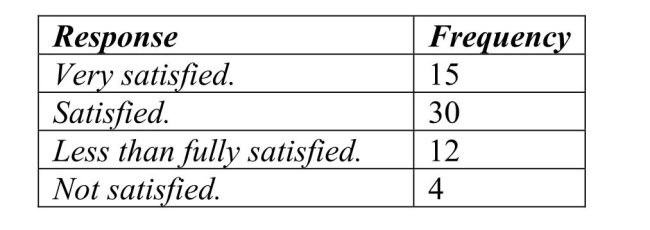
B)15%
C)40%
D)50%
Question
A restaurant uses comment cards to get feedback from its customers about newly added items
To the menu.It recently introduced homemade organic veggie burgers.Customers who tried
The new burger were asked if they would order it again.The data are summarized in the table
Below.What percentage of customers would most likely or definitely order the veggie
Burger again?
A)10%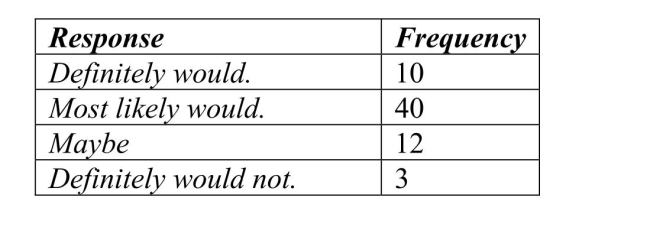
B)15%
C)40%
D)50%
E)77%
Question
The following table shows total assets ($ billion) for a small sample of U.S.banks. 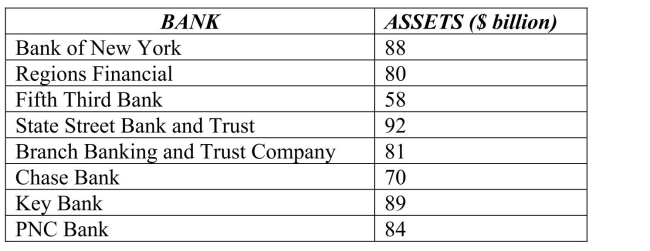 The standard deviation for these data is
A)$12.78 billion.
B)$ 11.27 billion.
C)$ 127.01 billion.
D)$ 21.67 billion.
E)$ 34 billion.
The standard deviation for these data isA)$12.78 billion.
B)$ 11.27 billion.
C)$ 127.01 billion.
D)$ 21.67 billion.
E)$ 34 billion.
Question
A clothing store uses comment cards to get feedback from its customers about newly added
Items.It recently introduced plus size fashion wear.Customers who purchased the items
Were asked to fill out an online comment survey giving 10% off the next purchasE.The data
Are summarized in the table below.What percentage of customers were at least satisfied with
The item(s) purchased (Satisfied or Very satisfied)?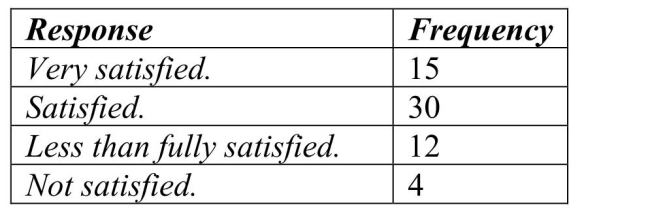
A)49.2%
B)73.8%
C)24.6%
D)26.2%
E)68.9%
Question
 The most appropriate measure of central tendency for these data is the
A)median.
B)mean.
C)mode.
D)range.
E)standard deviation.
Question
Question
Question
The following table shows total assets ($ billion) for a small sample of U.S.banks. 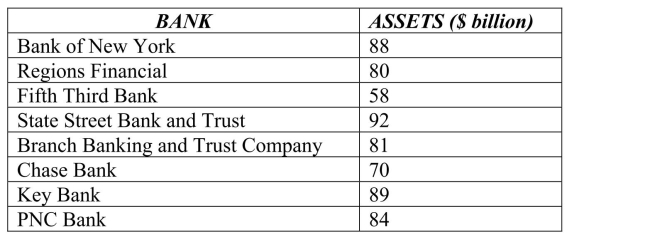 The mean for these data is
A)$ 80.25 billion.
B)$ 100.35 billion.
C)$ 75.68 billion.
D)$ 84 billion.
E)$ 89 billion.
The mean for these data isA)$ 80.25 billion.
B)$ 100.35 billion.
C)$ 75.68 billion.
D)$ 84 billion.
E)$ 89 billion.
Question
The following table shows data for total assets ($ billion) for a small sample of U.S.banks
(late 2013).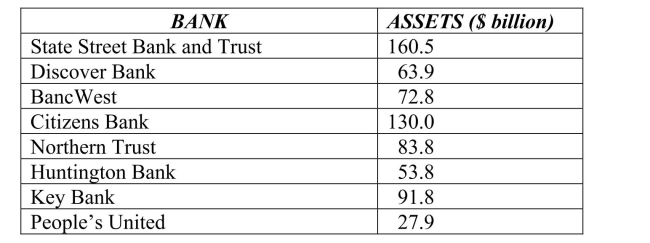
The mean for the total assets data ($ billion) is
A)$78.3.
B)$56.3.
C)$85.6.
D)$120.5.
E)$42.4.
(late 2013).
The mean for the total assets data ($ billion) is
A)$78.3.
B)$56.3.
C)$85.6.
D)$120.5.
E)$42.4.
Question
Question
Students in a statistics course were asked to 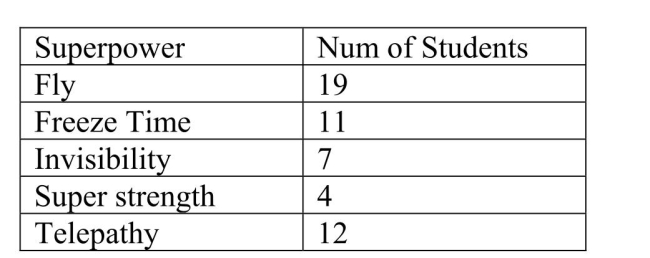
Superpower.Results are listed to the right.
A.Create a visual display for these data.
B.Describe the distribution of the students' choices.
Superpower.Results are listed to the right.
A.Create a visual display for these data.
B.Describe the distribution of the students' choices.
Question
Question
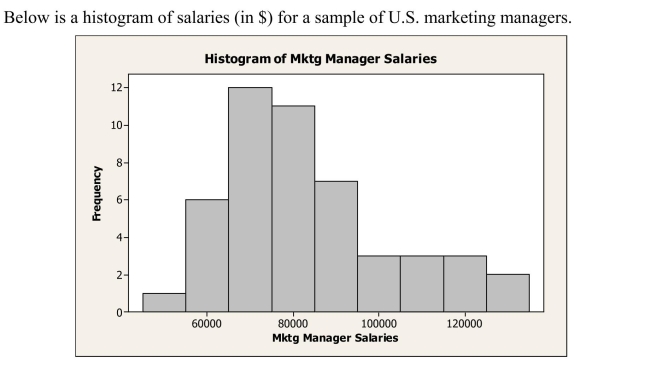
Below is a histogram of salaries (in $) for a sample of U.S.marketing managers. 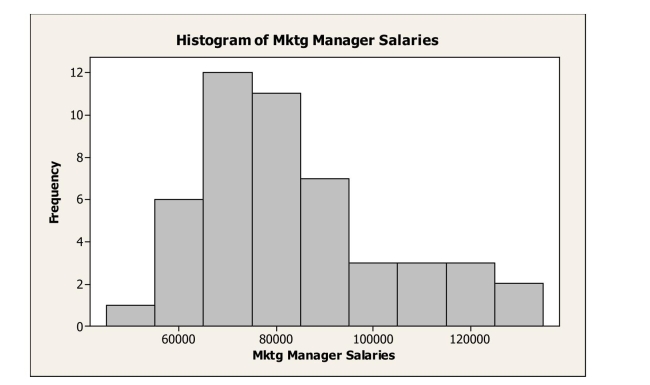 The shape of this distribution is
A)symmetric.
B)bimodal.
C)right skewed.
D)left skewed.
E)normal.
The shape of this distribution isA)symmetric.
B)bimodal.
C)right skewed.
D)left skewed.
E)normal.
Question
Here is the five number summary for salaries of U.S.marketing managers.
The IQR is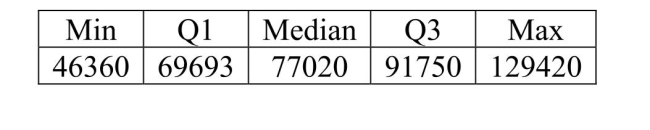
A)$83,060.
B)$22.057.
C)$69,693.
D)$77.020.
The IQR is
A)$83,060.
B)$22.057.
C)$69,693.
D)$77.020.
Question
A restaurant uses comment cards to get feedback from its customers about newly added items
To the menu.It recently introduced homemade organic veggie burgers.Customers who tried
The new burger were asked if they would order it again.The data are summarized in the table
Below.What percentage of customers would definitely order the veggie burger again?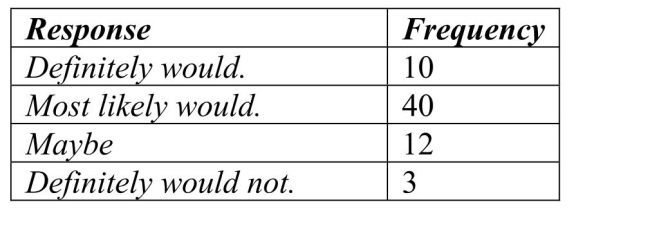
A)10%
B)15%
C)20%
D)40%
To the menu.It recently introduced homemade organic veggie burgers.Customers who tried
The new burger were asked if they would order it again.The data are summarized in the table
Below.What percentage of customers would definitely order the veggie burger again?
A)10%
B)15%
C)20%
D)40%
Question
Question
Consider the five number summary of hourly wages ($) for a sample of sales managers. 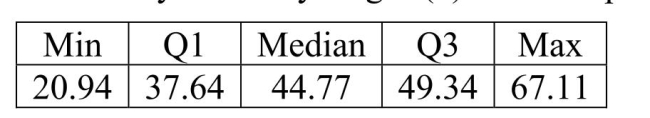 The IQR for these data is
A)$11.70
B)$46.17
C)$67.11
D)$20.94
E)$44.77
The IQR for these data isA)$11.70
B)$46.17
C)$67.11
D)$20.94
E)$44.77
Question
Consider the five number summary of hourly wages ($) for a sample of sales managers.
Suppose the mean hourly wage is $38.50.What can we say about the shape of the
Distribution?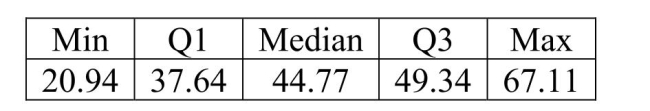
A)The distribution of hourly wages for sales managers is symmetric.
B)The distribution of hourly wages for sales managers is skewed right.
C)The distribution of hourly wages for sales managers is skewed left.
D)The distribution of hourly wages for sales managers is bimodal.
E)None of the above.
Question
Consider the five number summary of hourly wages ($) for a sample of advertising /
Promotion managers.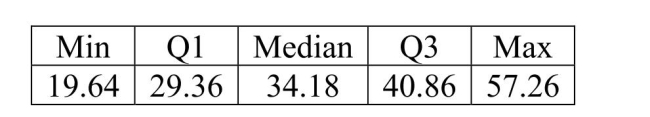
Suppose there had been an error and that the lowest hourly wage was $15.50 instead of
$19)64.This would result in
A)an increase in the median.
B)an increase in the standard deviation.
C)a decrease in the range.
D)a decrease in the IQR.
E)an increase in the mean.
Promotion managers.
Suppose there had been an error and that the lowest hourly wage was $15.50 instead of
$19)64.This would result in
A)an increase in the median.
B)an increase in the standard deviation.
C)a decrease in the range.
D)a decrease in the IQR.
E)an increase in the mean.
Question
Consider the five number summary of hourly wages ($) for a sample of sales managers. 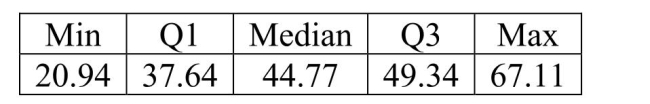 The range for these data is
A)$11.70
B)$46.17
C)$67.11
D)$20.94
E)$44.77
The range for these data isA)$11.70
B)$46.17
C)$67.11
D)$20.94
E)$44.77

Unlock Deck
Sign up to unlock the cards in this deck!
Unlock Deck
Unlock Deck
1/24
Play
Full screen (f)
Deck 2: Displaying and Describing Data
1
The following table shows representative recent closing share prices for a small sample of
Companies based in India in late 2013.
The standard deviation in closing share prices is
A)$81.6.
B)$25.8.
C)$36.6.
D)$62.7.
Companies based in India in late 2013.
The standard deviation in closing share prices is
A)$81.6.
B)$25.8.
C)$36.6.
D)$62.7.
A
2
A survey conducted in a college intro stats class
asked students about the number of credit hours
they were taking that quarter.The number of
credit hours for a random sample of 16 students is
given in the table.
a.Sketch a histogram of these data
b.Find the mean and standard deviation for
the number of credit hours.
c. Find the median and IQR for the number
d. Is it more appropriate to use the mean of credit hours. and standard deviation or the median and IQR to summarize theses data?
a.
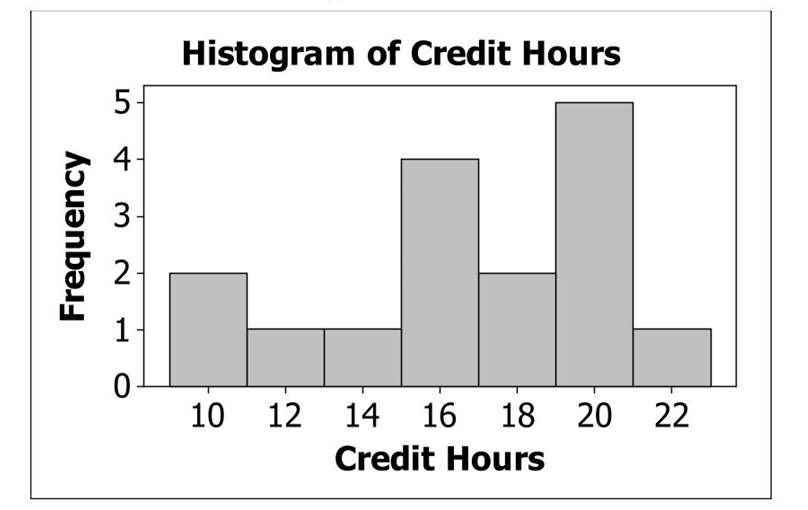
b.
c.The median is 16.0 credit hours. credit hours
d.It is mand IQR to sore apprummarize opriate to these data, because the median use these data are not unimodal and symmetric.
b.
c.The median is 16.0 credit hours. credit hours
d.It is mand IQR to sore apprummarize opriate to these data, because the median use these data are not unimodal and symmetric.
3
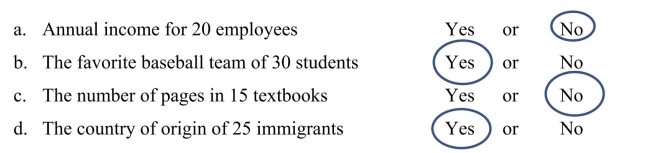
Which of the following variables would be appropriate to graph using a pie or bar graph?
4
A brake and muffler shop reported the repair bills, in
a.Sketch a histogram for these datA.
b.Find the mean and standard deviation of the repair costs.
c. Is it appropriate to use the mean and standard deviation to summarize these
data? Explain.
d. Describe the distribution of repair costs.
a.Sketch a histogram for these datA.
b.Find the mean and standard deviation of the repair costs.
c. Is it appropriate to use the mean and standard deviation to summarize these
data? Explain.
d. Describe the distribution of repair costs.
Unlock Deck
Unlock for access to all 24 flashcards in this deck.
Unlock Deck
k this deck
5
A clothing store uses comment cards to get feedback from its customers about newly added
Items.It recently introduced plus size fashion wear.Customers who purchased the items
Were asked to fill out an online comment survey giving 10% off the next purchasE.The data
Are summarized in the table below.What percentage of customers would be less likely to
Purchase another item (Less or Not fully satisfied)?
A)10%
B)15%
C)40%
D)50%
Unlock Deck
Unlock for access to all 24 flashcards in this deck.
Unlock Deck
k this deck
6
A restaurant uses comment cards to get feedback from its customers about newly added items
To the menu.It recently introduced homemade organic veggie burgers.Customers who tried
The new burger were asked if they would order it again.The data are summarized in the table
Below.What percentage of customers would most likely or definitely order the veggie
Burger again?
A)10%
B)15%
C)40%
D)50%
E)77%
Unlock Deck
Unlock for access to all 24 flashcards in this deck.
Unlock Deck
k this deck
7
The following table shows total assets ($ billion) for a small sample of U.S.banks. The standard deviation for these data is
A)$12.78 billion.
B)$ 11.27 billion.
C)$ 127.01 billion.
D)$ 21.67 billion.
E)$ 34 billion.
The standard deviation for these data isA)$12.78 billion.
B)$ 11.27 billion.
C)$ 127.01 billion.
D)$ 21.67 billion.
E)$ 34 billion.
Unlock Deck
Unlock for access to all 24 flashcards in this deck.
Unlock Deck
k this deck
8
A clothing store uses comment cards to get feedback from its customers about newly added
Items.It recently introduced plus size fashion wear.Customers who purchased the items
Were asked to fill out an online comment survey giving 10% off the next purchasE.The data
Are summarized in the table below.What percentage of customers were at least satisfied with
The item(s) purchased (Satisfied or Very satisfied)?
A)49.2%
B)73.8%
C)24.6%
D)26.2%
E)68.9%
Unlock Deck
Unlock for access to all 24 flashcards in this deck.
Unlock Deck
k this deck
9
The most appropriate measure of central tendency for these data is theA)median.
B)mean.
C)mode.
D)range.
E)standard deviation.
Unlock Deck
Unlock for access to all 24 flashcards in this deck.
Unlock Deck
k this deck
10
The students in a biology class kept a record of the height
a.Sketch a histogram for these datA.
b.Find the mean and standard deviation of the plant heights.
c. Is it appropriate to use the mean and standard deviation to summarize these data? Explain.
d. Describe the distribution of plant heights.
a.Sketch a histogram for these datA.
b.Find the mean and standard deviation of the plant heights.
c. Is it appropriate to use the mean and standard deviation to summarize these data? Explain.
d. Describe the distribution of plant heights.
Unlock Deck
Unlock for access to all 24 flashcards in this deck.
Unlock Deck
k this deck
11
Describe why the area principle is important in making a bar graph.It might be fun to ask an
artist to liven up a bar graph by turning the bars into images.But include in your explanation
why this might be risky.
artist to liven up a bar graph by turning the bars into images.But include in your explanation
why this might be risky.
Unlock Deck
Unlock for access to all 24 flashcards in this deck.
Unlock Deck
k this deck
12
The following table shows total assets ($ billion) for a small sample of U.S.banks. The mean for these data is
A)$ 80.25 billion.
B)$ 100.35 billion.
C)$ 75.68 billion.
D)$ 84 billion.
E)$ 89 billion.
The mean for these data isA)$ 80.25 billion.
B)$ 100.35 billion.
C)$ 75.68 billion.
D)$ 84 billion.
E)$ 89 billion.
Unlock Deck
Unlock for access to all 24 flashcards in this deck.
Unlock Deck
k this deck
13
The following table shows data for total assets ($ billion) for a small sample of U.S.banks
(late 2013).
The mean for the total assets data ($ billion) is
A)$78.3.
B)$56.3.
C)$85.6.
D)$120.5.
E)$42.4.
(late 2013).
The mean for the total assets data ($ billion) is
A)$78.3.
B)$56.3.
C)$85.6.
D)$120.5.
E)$42.4.
Unlock Deck
Unlock for access to all 24 flashcards in this deck.
Unlock Deck
k this deck
14
All students in a physical education class completed a basketball free-throw shooting event
and the highest number of shots made was 32.The next day a student who had just transferred into the school completed the event, making 35 shots.Indicate whether adding the new student's score to the rest of the data made each of these summary statistics increase, decrease, or stay about the same:
a. mean______
b. median____
c. range________
d. IQR__________
e. standard deviation__________
Unlock Deck
Unlock for access to all 24 flashcards in this deck.
Unlock Deck
k this deck
15
Students in a statistics course were asked to
Superpower.Results are listed to the right.
A.Create a visual display for these data.
B.Describe the distribution of the students' choices.
Superpower.Results are listed to the right.
A.Create a visual display for these data.
B.Describe the distribution of the students' choices.
Unlock Deck
Unlock for access to all 24 flashcards in this deck.
Unlock Deck
k this deck
16
A automobile marketing firm conducts a study to see what types of cars people owned before Buying an American car.The results are shown below.
The relative frequency of those who owned Japanese cars previously who now bought
American cars is
A)59.9 %
B)29.6%
C)5.7%
D)14.9%
E)2.9%
The relative frequency of those who owned Japanese cars previously who now bought
American cars is
A)59.9 %
B)29.6%
C)5.7%
D)14.9%
E)2.9%
Unlock Deck
Unlock for access to all 24 flashcards in this deck.
Unlock Deck
k this deck
17
Below is a histogram of salaries (in $) for a sample of U.S.marketing managers. The shape of this distribution is
A)symmetric.
B)bimodal.
C)right skewed.
D)left skewed.
E)normal.
The shape of this distribution isA)symmetric.
B)bimodal.
C)right skewed.
D)left skewed.
E)normal.
Unlock Deck
Unlock for access to all 24 flashcards in this deck.
Unlock Deck
k this deck
18
Here is the five number summary for salaries of U.S.marketing managers.
The IQR is
A)$83,060.
B)$22.057.
C)$69,693.
D)$77.020.
The IQR is
A)$83,060.
B)$22.057.
C)$69,693.
D)$77.020.
Unlock Deck
Unlock for access to all 24 flashcards in this deck.
Unlock Deck
k this deck
19
A restaurant uses comment cards to get feedback from its customers about newly added items
To the menu.It recently introduced homemade organic veggie burgers.Customers who tried
The new burger were asked if they would order it again.The data are summarized in the table
Below.What percentage of customers would definitely order the veggie burger again?
A)10%
B)15%
C)20%
D)40%
To the menu.It recently introduced homemade organic veggie burgers.Customers who tried
The new burger were asked if they would order it again.The data are summarized in the table
Below.What percentage of customers would definitely order the veggie burger again?
A)10%
B)15%
C)20%
D)40%
Unlock Deck
Unlock for access to all 24 flashcards in this deck.
Unlock Deck
k this deck
20
Suppose that the student taking 22 credit hours in the data set in the previous question was
actually taking 28 credit hours instead of 22 (so we would replace the 22 in the data set with
28).
Indicate whether changing the number of credit hours for that student would make each
of the following summary statistics increase, decrease, or stay about the same:
a. mean _____
b. median______
c. range__________
d. IQR________
e. standard deviation_________
Unlock Deck
Unlock for access to all 24 flashcards in this deck.
Unlock Deck
k this deck
21
Consider the five number summary of hourly wages ($) for a sample of sales managers. The IQR for these data is
A)$11.70
B)$46.17
C)$67.11
D)$20.94
E)$44.77
The IQR for these data isA)$11.70
B)$46.17
C)$67.11
D)$20.94
E)$44.77
Unlock Deck
Unlock for access to all 24 flashcards in this deck.
Unlock Deck
k this deck
22
Consider the five number summary of hourly wages ($) for a sample of sales managers.
Suppose the mean hourly wage is $38.50.What can we say about the shape of the
Distribution?
A)The distribution of hourly wages for sales managers is symmetric.
B)The distribution of hourly wages for sales managers is skewed right.
C)The distribution of hourly wages for sales managers is skewed left.
D)The distribution of hourly wages for sales managers is bimodal.
E)None of the above.
Suppose the mean hourly wage is $38.50.What can we say about the shape of the
Distribution?
A)The distribution of hourly wages for sales managers is symmetric.
B)The distribution of hourly wages for sales managers is skewed right.
C)The distribution of hourly wages for sales managers is skewed left.
D)The distribution of hourly wages for sales managers is bimodal.
E)None of the above.
Unlock Deck
Unlock for access to all 24 flashcards in this deck.
Unlock Deck
k this deck
23
Consider the five number summary of hourly wages ($) for a sample of advertising /
Promotion managers.
Suppose there had been an error and that the lowest hourly wage was $15.50 instead of
$19)64.This would result in
A)an increase in the median.
B)an increase in the standard deviation.
C)a decrease in the range.
D)a decrease in the IQR.
E)an increase in the mean.
Promotion managers.
Suppose there had been an error and that the lowest hourly wage was $15.50 instead of
$19)64.This would result in
A)an increase in the median.
B)an increase in the standard deviation.
C)a decrease in the range.
D)a decrease in the IQR.
E)an increase in the mean.
Unlock Deck
Unlock for access to all 24 flashcards in this deck.
Unlock Deck
k this deck
24
Consider the five number summary of hourly wages ($) for a sample of sales managers. The range for these data is
A)$11.70
B)$46.17
C)$67.11
D)$20.94
E)$44.77
The range for these data isA)$11.70
B)$46.17
C)$67.11
D)$20.94
E)$44.77
Unlock Deck
Unlock for access to all 24 flashcards in this deck.
Unlock Deck
k this deck
Unlock Deck
Unlock for access to all 24 flashcards in this deck.


