Deck 12: Inference on Categorical Data
Full screen (f)
Question
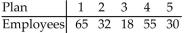
A company wants to determine if its employees have any preference among 5 different health plans which it offers to them. A sample of 200 employees provided the data below. Test the claim that the probabilities show no preference. Use α=0.01 .

Question
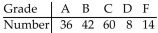
A teacher figures that final grades in the chemistry department are distributed as: A, 25 % ; B, 25 % ; C, 40 % ; D, 5 % ; F, 5 % . At the end of a randomly selected semester, the following number of grades were recorded. Determine if the grade distribution for the department is different than expected. Use α=0.01 .
Question
A random sample of 160 car purchases are selected and categorized by age. The results are listed below. The age distribution of drivers for the given categories is 18 % for the under 26 group, 39 % for the 26-45 group, 31 % for the 46-65 group, and 12 % for the group over 65 . Test the claim that all ages have purchase rates proportional to their driving rates. Use α=0.05 .
Question
A teacher figures that final grades in the chemistry department are distributed as: A, 25 % ; B, 25 % ; C, 40 % ;
D, 5 % ; F, 5 % . At the end of a randomly selected semester, the following number of grades were recorded.
Calculate the chi-square test statistic to determine if the grade distribution for the department is different than expected. Use
  =0.01 .
A) 5.25
B) 6.87
C) 0.6375
D) 4.82
D, 5 % ; F, 5 % . At the end of a randomly selected semester, the following number of grades were recorded.
Calculate the chi-square test statistic
to determine if the grade distribution for the department is different than expected. Use =0.01 .A) 5.25
B) 6.87
C) 0.6375
D) 4.82
Question
A __________________ test is an inferential procedure used to determine whether a frequency distributionfollows a defined distribution.
A) goodness-of-fit
C) F
D) normality
A) goodness-of-fit
C) F
D) normality
Question
Question
Determine the expected counts for each outcome. 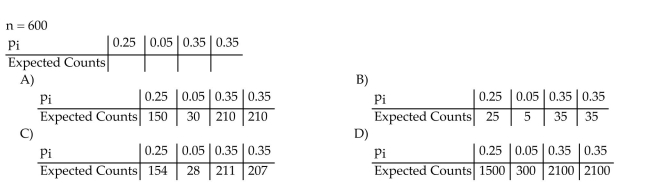
Question
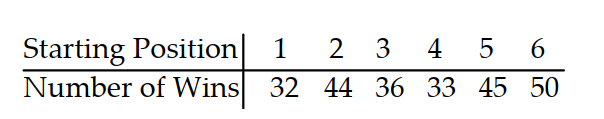
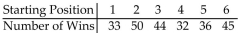
Many track hurdlers believe that they have a better chance of winning if they start in the inside lane that is closest to the field. For the data below, the lane closest to the field is Lane 1, the next lane is Lane 2, and so on until the outermost lane, Lane 6 . The data lists the number of wins for track hurdlers in the different starting positions. Test the claim that the probabilities of winning are the same in the different positions. Use α =0.05 . The results are based on 240 wins.
Question
Question
Many track hurdlers believe that they have a better chance of winning if they start in the inside lane that is closest to the field. For the data below, the lane closest to the field is Lane 1, the next lane is Lane 2, and so on until the outermost lane, Lane 6. The data lists the number of wins for track hurdlers in the different starting positions. Find the critical value  to test the claim that the probabilities of winning are the same in the different positions. Use
  =0.05 . The results are based on 240 wins.

A) 11.070
B) 9.236
C) 15.086
D) 12.833
to test the claim that the probabilities of winning are the same in the different positions. Use =0.05 . The results are based on 240 wins.A) 11.070
B) 9.236
C) 15.086
D) 12.833
Question
A company wants to determine if its employees have any preference among 5 different health plans which it offers to them. A sample of 200 employees provided the data below. Calculate the chi-square test statistic  to test the claim that the probabilities show no preference. Use
  =0.01 .
A) 37.45
B) 45.91
C) 48.91
D) 55.63
to test the claim that the probabilities show no preference. Use =0.01 .A) 37.45
B) 45.91
C) 48.91
D) 55.63
Question
Many track hurdlers believe that they have a better chance of winning if they start in the inside lane that is closest to the field. For the data below, the lane closest to the field is Lane 1, the next lane is Lane 2, and so on until the outermost lane, Lane 6 . The data lists the number of wins for track hurdlers in the different starting positions. Calculate the chi-square test statistic  to test the claim that the probabilities of winning are the same in the different positions. Use
  =0.05 . The results are based on 240 wins.
A) 6.750
B) 9.326
C) 12.592
D) 15.541
to test the claim that the probabilities of winning are the same in the different positions. Use =0.05 . The results are based on 240 wins.A) 6.750
B) 9.326
C) 12.592
D) 15.541
Question
Question
A teacher figures that final grades in the chemistry department are distributed as: A, 25 % ; B, 25 % ; C, 40 % ; D, 5 % ; F, 5 % . At the end of a randomly selected semester, the following number of grades were recorded. Find the critical value  to determine if the grade distribution for the department is different than expected. Use
  =0.01 .
A) 13.277
B) 15.086
C) 9.488
D) 7.779
to determine if the grade distribution for the department is different than expected. Use =0.01 .A) 13.277
B) 15.086
C) 9.488
D) 7.779
Question
The results of a recent national survey reported that 70% of Americans recycle at least some of the time. As partof their final project in statistics class, Nayla and Roberto survey 5 random students on campus and ask them ifthey recycle at least some of the time. They then repeat this experiment 1000 times. The results of their researchare shown below. 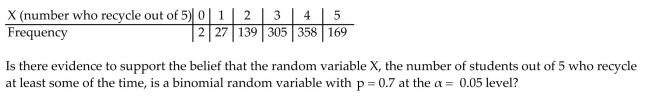
Question
A multinomial experiment with k = 4 cells and n = 300 produced the data shown in the following table. 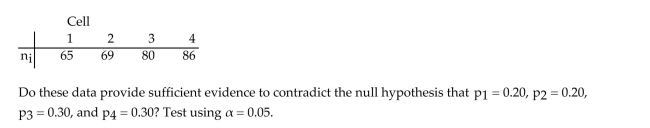
Question
Question
A company wants to determine if its employees have any preference among 5 different health plans which it offers to them. A sample of 200 employees provided the data below. Find the critical value  to test the claim that the probabilities show no preference. Use
  =0.01 .
A) 13.277
B) 9.488
C) 11.143
D) 14.860
to test the claim that the probabilities show no preference. Use =0.01 .A) 13.277
B) 9.488
C) 11.143
D) 14.860
Question
A spinner is mounted on a piece of cardboard divided into six areas of equal size. Each of the six areas is a different color (blue, yellow, red, green, white and orange). When the spinner is spun, each color should be selected by the spinner approximately  of the time. A student suspects that a certain spinner is defective. The suspected spinner is spun 90 times. The results are shown below. Test the student's claim. Use α=0.10 .
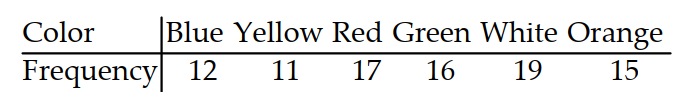
of the time. A student suspects that a certain spinner is defective. The suspected spinner is spun 90 times. The results are shown below. Test the student's claim. Use α=0.10 . Question
Question
A researcher wants to determine if the number of minutes spent watching television per day is independent ofgender. A random sample of 315 adults was selected and the results are shown below. Is there enoughevidence to conclude that the number of minutes spent watching television per day is related to gender? Use α= 0.05. 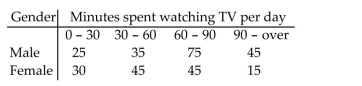
Question
Question
A sports statistician is interested in determining if there is a relationship between the number of home teamand visiting team losses and different sports. A random sample of 526 games is selected and the results aregiven below. Test the claim that the number of home team and visiting team losses is independent of the sport.Use α = 0.01. 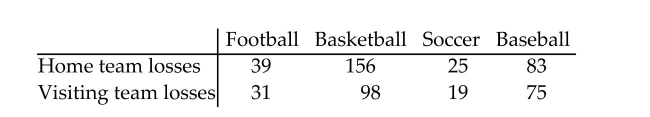
Question
Question
A random sample of 100 employees from 5 different companies was randomly selected, and the number whotake public transportation to work was recorded. The results are listed below. Perform a homogeneity ofproportions test to test the claim that the proportion who take public transportation to work is the same in all 5companies. Use α = 0.01. 
Question
Test the null hypothesis of independence of the two classifications, A and B, of the 3 × 3 contingency tableshown below. Test using α = 0.10. 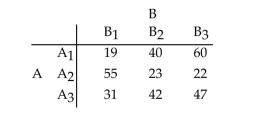
Question
Question
The contingency table below shows the results of a random sample of 200 registered voters that was conductedto see whether their opinions on a bill are related to their party affiliation. 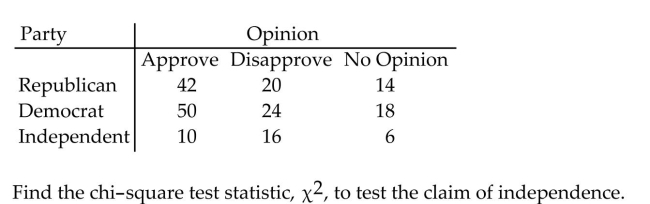
A) 8.030
B) 11.765
C) 7.662
D) 9.483
A) 8.030
B) 11.765
C) 7.662
D) 9.483
Question
The contingency table below shows the results of a random sample of 200 registered voters that was conductedto see whether their opinions on a bill are related to their party affiliation. Use α = 0.05. 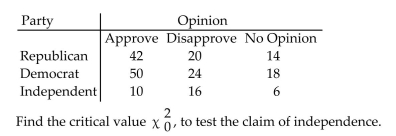
A) 9.488
B) 7.779
C) 11.143
D) 13.277
A) 9.488
B) 7.779
C) 11.143
D) 13.277
Question
Question
The data below show the age and favorite type of reading of 779 randomly selected people. Test the claim thatage and preferred reading type are independent. Use α = 0.05. 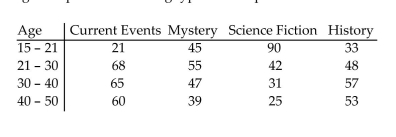
Question
Question
The degrees of freedom for a  goodness-of-fit test when there are 6 categories and a sample of size 1200 is
A) 5
B) 6
C) 1199
D) 1205 12.2 Tests for Independence and the Homogeneity of Proportions
1 Perform a test for independence.
goodness-of-fit test when there are 6 categories and a sample of size 1200 isA) 5
B) 6
C) 1199
D) 1205 12.2 Tests for Independence and the Homogeneity of Proportions
1 Perform a test for independence.
Question
A random sample of 400 men and 400 women was randomly selected and asked whether they planned toattend a concert in the next month. The results are listed below. Perform a homogeneity of proportions test totest the claim that the proportion of men who plan to attend a concert in the next month is the same as theproportion of women who plan to attend a concert in the next month. Use α = 0.05. 
Question
Question
The contingency table below shows the results of a random sample of 200 registered voters that was conductedto see whether their opinions on a bill are related to their party affiliation. 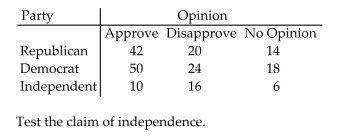
Question
A medical researcher is interested in determining if there is a relationship between adults over 50 who exerciseregularly and low, moderate, and high blood pressure. A random sample of 236 adults over 50 is selected andthe results are given below. Test the claim that regular exercise and low, moderate, and high blood pressure areindependent. Use α = 0.01. 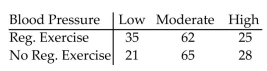
Question

Unlock Deck
Sign up to unlock the cards in this deck!
Unlock Deck
Unlock Deck
1/38
Play
Full screen (f)
Deck 12: Inference on Categorical Data
1
A company wants to determine if its employees have any preference among 5 different health plans which it offers to them. A sample of 200 employees provided the data below. Test the claim that the probabilities show no preference. Use α=0.01 .
critical value =13.277 ; chi-square test statistic
  =37.45 ; reject H0 . There is sufficient evidence to reject the claim that employees show no preferences among the plans.
=13.277 ; chi-square test statistic =37.45 ; reject H0 . There is sufficient evidence to reject the claim that employees show no preferences among the plans. 2
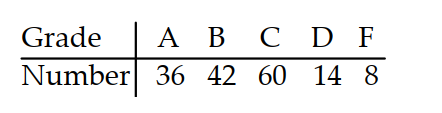
A teacher figures that final grades in the chemistry department are distributed as: A, 25 % ; B, 25 % ; C, 40 % ; D, 5 % ; F, 5 % . At the end of a randomly selected semester, the following number of grades were recorded. Determine if the grade distribution for the department is different than expected. Use α=0.01 .
critical value  =13.277 ; chi-square test statistic
  =5.25 ; fail to reject H0 ; There is not sufficient evidence to support the claim that the grades are different than expected.
=13.277 ; chi-square test statistic =5.25 ; fail to reject H0 ; There is not sufficient evidence to support the claim that the grades are different than expected. 3
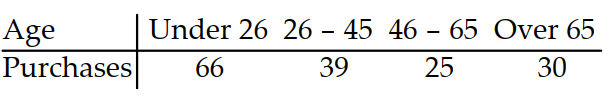
A random sample of 160 car purchases are selected and categorized by age. The results are listed below. The age distribution of drivers for the given categories is 18 % for the under 26 group, 39 % for the 26-45 group, 31 % for the 46-65 group, and 12 % for the group over 65 . Test the claim that all ages have purchase rates proportional to their driving rates. Use α=0.05 .
critical value  =7.815 ; chi-square test statistic
  =75.101 ; reject H0 ; There is sufficient evidence to reject the claim that all ages have the same purchase rate.
=7.815 ; chi-square test statistic =75.101 ; reject H0 ; There is sufficient evidence to reject the claim that all ages have the same purchase rate. 4
A teacher figures that final grades in the chemistry department are distributed as: A, 25 % ; B, 25 % ; C, 40 % ;
D, 5 % ; F, 5 % . At the end of a randomly selected semester, the following number of grades were recorded.
Calculate the chi-square test statistic to determine if the grade distribution for the department is different than expected. Use =0.01 .
A) 5.25
B) 6.87
C) 0.6375
D) 4.82
D, 5 % ; F, 5 % . At the end of a randomly selected semester, the following number of grades were recorded.
Calculate the chi-square test statistic
to determine if the grade distribution for the department is different than expected. Use =0.01 .A) 5.25
B) 6.87
C) 0.6375
D) 4.82
Unlock Deck
Unlock for access to all 38 flashcards in this deck.
Unlock Deck
k this deck
5
A __________________ test is an inferential procedure used to determine whether a frequency distributionfollows a defined distribution.
A) goodness-of-fit
C) F
D) normality
A) goodness-of-fit
C) F
D) normality
Unlock Deck
Unlock for access to all 38 flashcards in this deck.
Unlock Deck
k this deck
6
As the number of the degrees of freedom increases, the χ2 distribution
A) becomes more symmetric.
B) becomes less symmetric.
C) does not change shape as the degrees of freedom change.
D) becomes exponential.
A) becomes more symmetric.
B) becomes less symmetric.
C) does not change shape as the degrees of freedom change.
D) becomes exponential.
Unlock Deck
Unlock for access to all 38 flashcards in this deck.
Unlock Deck
k this deck
7
Determine the expected counts for each outcome.
Unlock Deck
Unlock for access to all 38 flashcards in this deck.
Unlock Deck
k this deck
8
Many track hurdlers believe that they have a better chance of winning if they start in the inside lane that is closest to the field. For the data below, the lane closest to the field is Lane 1, the next lane is Lane 2, and so on until the outermost lane, Lane 6 . The data lists the number of wins for track hurdlers in the different starting positions. Test the claim that the probabilities of winning are the same in the different positions. Use α =0.05 . The results are based on 240 wins.
Unlock Deck
Unlock for access to all 38 flashcards in this deck.
Unlock Deck
k this deck
9
A random sample of 160 car purchases are selected and categorized by age. The results are listed below. Theage distribution of drivers for the given categories is 18% for the under 26 group, 39% for the 26 -45 group, 31%for the 45-65 group, and 12% for the group over 65. Calculate the chi-square test statistic ?2 to test the claimthat all ages have purchase rates proportional to their driving rates. Use ? = 0.05.
A) 75.101
B) 85.123
C) 101.324
D) 95.431
A) 75.101
B) 85.123
C) 101.324
D) 95.431
Unlock Deck
Unlock for access to all 38 flashcards in this deck.
Unlock Deck
k this deck
10
Many track hurdlers believe that they have a better chance of winning if they start in the inside lane that is closest to the field. For the data below, the lane closest to the field is Lane 1, the next lane is Lane 2, and so on until the outermost lane, Lane 6. The data lists the number of wins for track hurdlers in the different starting positions. Find the critical value to test the claim that the probabilities of winning are the same in the different positions. Use =0.05 . The results are based on 240 wins.
A) 11.070
B) 9.236
C) 15.086
D) 12.833
to test the claim that the probabilities of winning are the same in the different positions. Use =0.05 . The results are based on 240 wins.A) 11.070
B) 9.236
C) 15.086
D) 12.833
Unlock Deck
Unlock for access to all 38 flashcards in this deck.
Unlock Deck
k this deck
11
A company wants to determine if its employees have any preference among 5 different health plans which it offers to them. A sample of 200 employees provided the data below. Calculate the chi-square test statistic to test the claim that the probabilities show no preference. Use =0.01 .
A) 37.45
B) 45.91
C) 48.91
D) 55.63
to test the claim that the probabilities show no preference. Use =0.01 .A) 37.45
B) 45.91
C) 48.91
D) 55.63
Unlock Deck
Unlock for access to all 38 flashcards in this deck.
Unlock Deck
k this deck
12
Many track hurdlers believe that they have a better chance of winning if they start in the inside lane that is closest to the field. For the data below, the lane closest to the field is Lane 1, the next lane is Lane 2, and so on until the outermost lane, Lane 6 . The data lists the number of wins for track hurdlers in the different starting positions. Calculate the chi-square test statistic to test the claim that the probabilities of winning are the same in the different positions. Use =0.05 . The results are based on 240 wins.
A) 6.750
B) 9.326
C) 12.592
D) 15.541
to test the claim that the probabilities of winning are the same in the different positions. Use =0.05 . The results are based on 240 wins.A) 6.750
B) 9.326
C) 12.592
D) 15.541
Unlock Deck
Unlock for access to all 38 flashcards in this deck.
Unlock Deck
k this deck
13
A spinner is mounted on a piece of cardboard divided into six areas of equal size. Each of the six areas is a different color (blue, yellow, red, green, white and orange). When the spinner is spun, each color should be selected by the spinner approximately of the time. A student suspects that a certain spinner is defective. The suspected spinner is spun 90 times. The results are shown below. Calculate the chi -square test statistic to test the student's claim. Use =0.10 .
A) 3.067
B) 2.143
C) 5.013
D) 4.312
A) 3.067
B) 2.143
C) 5.013
D) 4.312
Unlock Deck
Unlock for access to all 38 flashcards in this deck.
Unlock Deck
k this deck
14
A teacher figures that final grades in the chemistry department are distributed as: A, 25 % ; B, 25 % ; C, 40 % ; D, 5 % ; F, 5 % . At the end of a randomly selected semester, the following number of grades were recorded. Find the critical value to determine if the grade distribution for the department is different than expected. Use =0.01 .
A) 13.277
B) 15.086
C) 9.488
D) 7.779
to determine if the grade distribution for the department is different than expected. Use =0.01 .A) 13.277
B) 15.086
C) 9.488
D) 7.779
Unlock Deck
Unlock for access to all 38 flashcards in this deck.
Unlock Deck
k this deck
15
The results of a recent national survey reported that 70% of Americans recycle at least some of the time. As partof their final project in statistics class, Nayla and Roberto survey 5 random students on campus and ask them ifthey recycle at least some of the time. They then repeat this experiment 1000 times. The results of their researchare shown below.
Unlock Deck
Unlock for access to all 38 flashcards in this deck.
Unlock Deck
k this deck
16
A multinomial experiment with k = 4 cells and n = 300 produced the data shown in the following table.
Unlock Deck
Unlock for access to all 38 flashcards in this deck.
Unlock Deck
k this deck
17
A spinner is mounted on a piece of cardboard divided into six areas of equal size. Each of the six areas is a different color (blue, yellow, red, green, white and orange). When the spinner is spun, each color should be selected by the spinner approximately of the time. A student suspects that a certain spinner is defective. The suspected spinner is spun 90 times. The results are shown below. Find the critical value to test the student's claim. Use .
A) 9.236
B) 1.610
C) 10.645
D) 11.071
A) 9.236
B) 1.610
C) 10.645
D) 11.071
Unlock Deck
Unlock for access to all 38 flashcards in this deck.
Unlock Deck
k this deck
18
A company wants to determine if its employees have any preference among 5 different health plans which it offers to them. A sample of 200 employees provided the data below. Find the critical value to test the claim that the probabilities show no preference. Use =0.01 .
A) 13.277
B) 9.488
C) 11.143
D) 14.860
to test the claim that the probabilities show no preference. Use =0.01 .A) 13.277
B) 9.488
C) 11.143
D) 14.860
Unlock Deck
Unlock for access to all 38 flashcards in this deck.
Unlock Deck
k this deck
19
A spinner is mounted on a piece of cardboard divided into six areas of equal size. Each of the six areas is a different color (blue, yellow, red, green, white and orange). When the spinner is spun, each color should be selected by the spinner approximately of the time. A student suspects that a certain spinner is defective. The suspected spinner is spun 90 times. The results are shown below. Test the student's claim. Use α=0.10 .
of the time. A student suspects that a certain spinner is defective. The suspected spinner is spun 90 times. The results are shown below. Test the student's claim. Use α=0.10 . Unlock Deck
Unlock for access to all 38 flashcards in this deck.
Unlock Deck
k this deck
20
A random sample of 160 car purchases are selected and categorized by age. The results are listed below. The age distribution of drivers for the given categories is for the under 26 group, for the group, for the 45-65 group, and for the group over 65 . Find the critical value to test the claim that all ages have purchase rates proportional to their driving rates. Use .
A) 7.815
B) 6.251
C) 11.143
D) 9.348
A) 7.815
B) 6.251
C) 11.143
D) 9.348
Unlock Deck
Unlock for access to all 38 flashcards in this deck.
Unlock Deck
k this deck
21
A researcher wants to determine if the number of minutes spent watching television per day is independent ofgender. A random sample of 315 adults was selected and the results are shown below. Is there enoughevidence to conclude that the number of minutes spent watching television per day is related to gender? Use α= 0.05.
Unlock Deck
Unlock for access to all 38 flashcards in this deck.
Unlock Deck
k this deck
22
In a chi-square test of homogeneity of proportions we test the claims that
A) different populations have the same proportions of individuals with the same characteristics.
B) across a single sample the proportion of individuals with the same characteristic is the same as the population.
C) the proportion of individuals with a given characteristic doesnʹt change over time.
D) the proportion of a population having a given characteristic is based on the homogeneity of the population.
Unlock Deck
Unlock for access to all 38 flashcards in this deck.
Unlock Deck
k this deck
23
A sports statistician is interested in determining if there is a relationship between the number of home teamand visiting team losses and different sports. A random sample of 526 games is selected and the results aregiven below. Test the claim that the number of home team and visiting team losses is independent of the sport.Use α = 0.01.
Unlock Deck
Unlock for access to all 38 flashcards in this deck.
Unlock Deck
k this deck
24
A researcher wants to determine if the number of minutes spent watching television per day is independent ofgender. A random sample of 315 adults was selected and the results are shown below. Find the critical value to determine if there is enough evidence to conclude that the number of minutes spent watching televisior per day is related to gender. Use .
A) 7.815
B) 9.348
C) 11.345
D) 6.251
A) 7.815
B) 9.348
C) 11.345
D) 6.251
Unlock Deck
Unlock for access to all 38 flashcards in this deck.
Unlock Deck
k this deck
25
A random sample of 100 employees from 5 different companies was randomly selected, and the number whotake public transportation to work was recorded. The results are listed below. Perform a homogeneity ofproportions test to test the claim that the proportion who take public transportation to work is the same in all 5companies. Use α = 0.01.
Unlock Deck
Unlock for access to all 38 flashcards in this deck.
Unlock Deck
k this deck
26
Test the null hypothesis of independence of the two classifications, A and B, of the 3 × 3 contingency tableshown below. Test using α = 0.10.
Unlock Deck
Unlock for access to all 38 flashcards in this deck.
Unlock Deck
k this deck
27
A medical researcher is interested in determining if there is a relationship between adults over 50 who exercise regularly and low, moderate, and high blood pressure. A random sample of 236 adults over 50 is selected and the results are given below. Calculate the chi-square test statistic to test the claim that regular exercise and low, moderate, and high blood pressure are independent. Use .
A) 3.473
B) 16.183
C) 18.112
D) 6.003
A) 3.473
B) 16.183
C) 18.112
D) 6.003
Unlock Deck
Unlock for access to all 38 flashcards in this deck.
Unlock Deck
k this deck
28
The contingency table below shows the results of a random sample of 200 registered voters that was conductedto see whether their opinions on a bill are related to their party affiliation.
A) 8.030
B) 11.765
C) 7.662
D) 9.483
A) 8.030
B) 11.765
C) 7.662
D) 9.483
Unlock Deck
Unlock for access to all 38 flashcards in this deck.
Unlock Deck
k this deck
29
The contingency table below shows the results of a random sample of 200 registered voters that was conductedto see whether their opinions on a bill are related to their party affiliation. Use α = 0.05.
A) 9.488
B) 7.779
C) 11.143
D) 13.277
A) 9.488
B) 7.779
C) 11.143
D) 13.277
Unlock Deck
Unlock for access to all 38 flashcards in this deck.
Unlock Deck
k this deck
30
In a χ2 test of independence, the null hypothesis is that
A) there is not an association.
B) there is an association.
C) each element of each set has the same probability of occurrence.
D) the random variables are dependent.
A) there is not an association.
B) there is an association.
C) each element of each set has the same probability of occurrence.
D) the random variables are dependent.
Unlock Deck
Unlock for access to all 38 flashcards in this deck.
Unlock Deck
k this deck
31
The data below show the age and favorite type of reading of 779 randomly selected people. Test the claim thatage and preferred reading type are independent. Use α = 0.05.
Unlock Deck
Unlock for access to all 38 flashcards in this deck.
Unlock Deck
k this deck
32
A sports statistician is interested in determining if there is a relationship between the number of home team and visiting team losses and different sports. A random sample of 526 games is selected and the results are given below. Find the critical value to test the claim that the number of home team and visiting team losses is independent of the sport. Use .
A) 11.345
B) 12.838
C) 7.815
D) 9.348
A) 11.345
B) 12.838
C) 7.815
D) 9.348
Unlock Deck
Unlock for access to all 38 flashcards in this deck.
Unlock Deck
k this deck
33
The degrees of freedom for a goodness-of-fit test when there are 6 categories and a sample of size 1200 is
A) 5
B) 6
C) 1199
D) 1205 12.2 Tests for Independence and the Homogeneity of Proportions
1 Perform a test for independence.
goodness-of-fit test when there are 6 categories and a sample of size 1200 isA) 5
B) 6
C) 1199
D) 1205 12.2 Tests for Independence and the Homogeneity of Proportions
1 Perform a test for independence.
Unlock Deck
Unlock for access to all 38 flashcards in this deck.
Unlock Deck
k this deck
34
A random sample of 400 men and 400 women was randomly selected and asked whether they planned toattend a concert in the next month. The results are listed below. Perform a homogeneity of proportions test totest the claim that the proportion of men who plan to attend a concert in the next month is the same as theproportion of women who plan to attend a concert in the next month. Use α = 0.05.
Unlock Deck
Unlock for access to all 38 flashcards in this deck.
Unlock Deck
k this deck
35
A researcher wants to determine if the number of minutes spent watching television per day is independent of gender. A random sample of 315 adults was selected and the results are shown below. Calculate the chi -square statistic to determine if there is enough evidence to conclude that the number of minutes spent watching television per day is related to gender. Use .
A) 18.146
B) 19.874
C) 20.912
D) 21.231
A) 18.146
B) 19.874
C) 20.912
D) 21.231
Unlock Deck
Unlock for access to all 38 flashcards in this deck.
Unlock Deck
k this deck
36
The contingency table below shows the results of a random sample of 200 registered voters that was conductedto see whether their opinions on a bill are related to their party affiliation.
Unlock Deck
Unlock for access to all 38 flashcards in this deck.
Unlock Deck
k this deck
37
A medical researcher is interested in determining if there is a relationship between adults over 50 who exerciseregularly and low, moderate, and high blood pressure. A random sample of 236 adults over 50 is selected andthe results are given below. Test the claim that regular exercise and low, moderate, and high blood pressure areindependent. Use α = 0.01.
Unlock Deck
Unlock for access to all 38 flashcards in this deck.
Unlock Deck
k this deck
38
A medical researcher is interested in determining if there is a relationship between adults over 50 who exercise regularly and low, moderate, and high blood pressure. A random sample of 236 adults over 50 is selected and the results are given below. Find the critical value to test the claim that regular exercise and low, moderate, and high blood pressure are independent. Use .
A) 9.210
B) 9.348
C) 6.251
D) 5.991
A) 9.210
B) 9.348
C) 6.251
D) 5.991
Unlock Deck
Unlock for access to all 38 flashcards in this deck.
Unlock Deck
k this deck
Unlock Deck
Unlock for access to all 38 flashcards in this deck.


