Deck 3: Numerically Summarizing Data
Full screen (f)
Question
Question
Question
Question
Question
Question
Question
The following data represent a random sample of 15 complaints registered with the customer servicedepartment of a store. Determine the mode complaint. 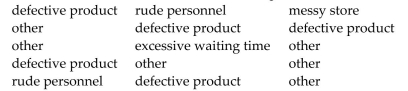
A) other
B) defective product
C) messy store
D) no mode
A) other
B) defective product
C) messy store
D) no mode
Question
Question
Each year advertisers spend billions of dollars purchasing commercial time on network sports television. In thefirst 6 months of 1988, advertisers spent $1.1 billion. A recent article listed the top 10 leading spenders (inmillions of dollars): 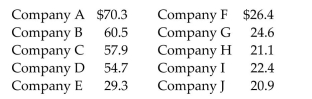 Calculate the mean amount spent.
A) 38.81 million dollars
B) 19.52 million dollars
C) 381.01 million dollars
D) 49.40 million dollars
Calculate the mean amount spent.A) 38.81 million dollars
B) 19.52 million dollars
C) 381.01 million dollars
D) 49.40 million dollars
Question
Question
Each year advertisers spend billions of dollars purchasing commercial time on network sports television. In thefirst 6 months of the year, advertisers spent $1.1 billion. A recent article listed the top 10 leading spenders (inmillions of dollars): 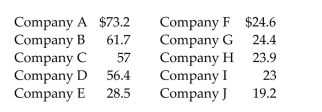 Calculate the median.
A) 26.55 million dollars
B) 5.15 million dollars
C) 39.19 million dollars
D) 54.00 million dollars
Calculate the median.A) 26.55 million dollars
B) 5.15 million dollars
C) 39.19 million dollars
D) 54.00 million dollars
Question
Question
Question
Question
Question
The following data represents a random sample of 15 complaints registered with the customer servicedepartment of a store. Determine the median complaint. 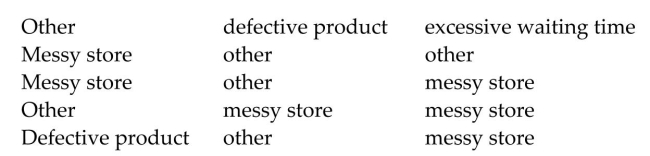
A) No median
B) Messy store
C) Defective product
D) Excessive waiting time
A) No median
B) Messy store
C) Defective product
D) Excessive waiting time
Question
Question
Question
The following data represent the bachelor degrees of CEOʹs at area small businesses. Determine the modedegree. 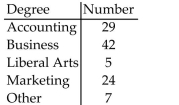
A) business
B) accounting
C) marketing
D) no mode
A) business
B) accounting
C) marketing
D) no mode
Question
Describe the shape of the histogram. The data set: Pick-Three lottery results for 10 consecutive weeks 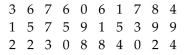
A) uniform
B) symmetric
C) skewed to the left
D) skewed to the right
A) uniform
B) symmetric
C) skewed to the left
D) skewed to the right
Question
Describe the shape of the histogram. The data set: age of 20 household stereo systems randomly selectedfrom a neighborhood 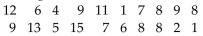
A) symmetric
B) uniform
C) skewed to the left
D) skewed to the right
A) symmetric
B) uniform
C) skewed to the left
D) skewed to the right
Question
Question
Question
Question
Question
Question
Question
Question
If the graph of a distribution of data shows that the graph is skewed to the right then the 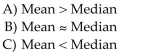
D) No conclusion about the relative position of the mean and the median can be made
D) No conclusion about the relative position of the mean and the median can be made
Question
Describe the shape of the histogram. The data set: round-trip commuting times (in minutes) of 20 randomlyselected employees 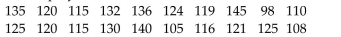
A) skewed to the right
B) uniform
C) skewed to the left
D) symmetric
A) skewed to the right
B) uniform
C) skewed to the left
D) symmetric
Question
Question
The output below gives the mean and median for the national dropout rates of high school students in 2010and 2012. 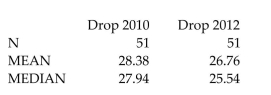 51Use the sample information to determine the shape of the distributions of the high school dropout rates in 2010and 2012.
51Use the sample information to determine the shape of the distributions of the high school dropout rates in 2010and 2012. Question
Question
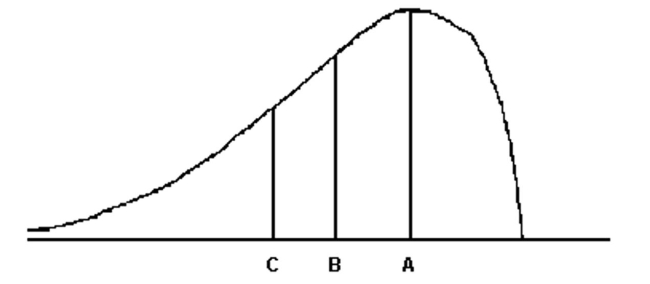 For the distribution drawn here, identify the mean, median, and mode.
A) A = mode, B = median, C = mean
B) A = median, B = mode, C = mean
C) A = mode, B = mean, C = median
D) A = mean, B = mode, C = median
Question
Question
Question
Question
If the graph of a distribution of data shows that the graph is skewed to the left then the 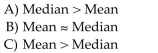
D) No conclusion about the relative position of the mean and the median can be made
D) No conclusion about the relative position of the mean and the median can be made
Question
Question
A severe drought affected several western states for 3 years. A Christmas tree farmer is worried about thedroughtʹs effect on the size of his trees. To decide whether the growth of the trees has been retarded, the farmerdecides to take a sample of the heights of 25 trees and obtains the following results (recorded in inches): 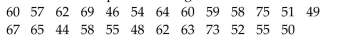 Which measure of central tendency would be considered the best measure to use in this problem?
A) mean
B) median
C) mode
D) range
Which measure of central tendency would be considered the best measure to use in this problem?A) mean
B) median
C) mode
D) range
Question
Question
Question
Question
Question
Question
Question
Question
Question
Question
Question
Question
Question
Question
Question
Question
Question
Question
Question
The January utility bills (in dollars) for 20 residents of a large city are listed below. Find the range of the data. 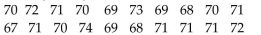
A) $7
B) $2.98
C) $2
D) $1.73
A) $7
B) $2.98
C) $2
D) $1.73
Question
Question
Question
Question
Question
Question
Question
Question
Health care issues are receiving much attention in both academic and political arenas. A sociologist recentlyconducted a survey of citizens over 60 years of age whose net worth is too high to qualify for governmenthealth care but who have no private health insurance. The ages of 25 uninsured senior citizens were as follows: 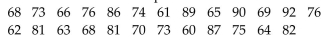 Suppose the mean and standard deviation are 74.0 and 9.7, respectively. If we assume that the distribution ofages is bell shaped, what percentage of the respondents will be between 64.3 and 93.4 years old?
A) approximately 81.5%
B) approximately 68%
C) approximately 95%
D) approximately 83.9%
Suppose the mean and standard deviation are 74.0 and 9.7, respectively. If we assume that the distribution ofages is bell shaped, what percentage of the respondents will be between 64.3 and 93.4 years old?A) approximately 81.5%
B) approximately 68%
C) approximately 95%
D) approximately 83.9%
Question
Each year advertisers spend billions of dollars purchasing commercial time on network sports television. In thefirst 6 months of 1988, advertisers spent $1.1 billion. Who were the largest spenders? In a recent article, listedthe top 10 leading spenders (in million of dollars): 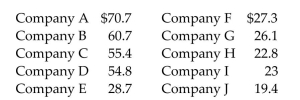 Calculate the sample variance.
A) 367.36
B) 19.17
C) 38.89
D) 51.30
Calculate the sample variance.A) 367.36
B) 19.17
C) 38.89
D) 51.30
Question
Question
Question
Question
Question
Question
Question
Question
Question
Question
Question
Question

Unlock Deck
Sign up to unlock the cards in this deck!
Unlock Deck
Unlock Deck
1/141
Play
Full screen (f)
Deck 3: Numerically Summarizing Data
1
The heights of ten male students (in inches) in a college biology class are listed below. Find the mean.71 67 67 72 76 72 73 68 72 72
A) 71 inches
B) 67 inches
C) 68 inches
D) 72 inches
A) 71 inches
B) 67 inches
C) 68 inches
D) 72 inches
A
2
The heights of ten female students (in inches) in a college math class are listed below. Find the mean.65 66 67 66 67 70 67 70 71 68
A) 67.7 inches
B) 65.5 inches
C) 71.1 inches
D) 70.0 inches
A) 67.7 inches
B) 65.5 inches
C) 71.1 inches
D) 70.0 inches
A
3
The repair costs for five cars which were crashed by a safety testing organization were as follows:$100, $150, $200, $250, and $150. Find the mean cost of repair.
A) $170
B) $160
C) $180
D) $140
A) $170
B) $160
C) $180
D) $140
A
4
Which measure of central tendency may not exist for all numeric data sets?
A) Mode
B) Median
C) Mean
D) Midrange
A) Mode
B) Median
C) Mean
D) Midrange
Unlock Deck
Unlock for access to all 141 flashcards in this deck.
Unlock Deck
k this deck
5
The median of a data set for a variable is the data value that
A) Lies in the middle of the data when the data is arranged in ascending order.
B) Appears the most often
C) Is the average, that is, the sum of all the data values of the variable divided by the number of observations in the data set?
D) None of these
A) Lies in the middle of the data when the data is arranged in ascending order.
B) Appears the most often
C) Is the average, that is, the sum of all the data values of the variable divided by the number of observations in the data set?
D) None of these
Unlock Deck
Unlock for access to all 141 flashcards in this deck.
Unlock Deck
k this deck
6
The commuting times (in minutes) of an employee for ten consecutive days are listed below. Find the mediancommute.71 67 67 72 76 72 73 68 72 72
A) 72 minutes
B) 67 minutes
C) 71 minutes
D) 73 minutes
A) 72 minutes
B) 67 minutes
C) 71 minutes
D) 73 minutes
Unlock Deck
Unlock for access to all 141 flashcards in this deck.
Unlock Deck
k this deck
7
The following data represent a random sample of 15 complaints registered with the customer servicedepartment of a store. Determine the mode complaint.
A) other
B) defective product
C) messy store
D) no mode
A) other
B) defective product
C) messy store
D) no mode
Unlock Deck
Unlock for access to all 141 flashcards in this deck.
Unlock Deck
k this deck
8
The number of students enrolled in a physics class for the last ten semesters are listed below. Find the mediannumber of students.65 66 67 66 67 70 67 70 71 68
A) 67 students
B) 66 students
C) 68 students
D) 70 students
A) 67 students
B) 66 students
C) 68 students
D) 70 students
Unlock Deck
Unlock for access to all 141 flashcards in this deck.
Unlock Deck
k this deck
9
Each year advertisers spend billions of dollars purchasing commercial time on network sports television. In thefirst 6 months of 1988, advertisers spent $1.1 billion. A recent article listed the top 10 leading spenders (inmillions of dollars): Calculate the mean amount spent.
A) 38.81 million dollars
B) 19.52 million dollars
C) 381.01 million dollars
D) 49.40 million dollars
Calculate the mean amount spent.A) 38.81 million dollars
B) 19.52 million dollars
C) 381.01 million dollars
D) 49.40 million dollars
Unlock Deck
Unlock for access to all 141 flashcards in this deck.
Unlock Deck
k this deck
10
If X1, X2, X3, ..., XN are the N observations of a variable from a population, then the population mean issymbolized by ~
A) μ
B) X
C) Σ
D) X
A) μ
B) X
C) Σ
D) X
Unlock Deck
Unlock for access to all 141 flashcards in this deck.
Unlock Deck
k this deck
11
Each year advertisers spend billions of dollars purchasing commercial time on network sports television. In thefirst 6 months of the year, advertisers spent $1.1 billion. A recent article listed the top 10 leading spenders (inmillions of dollars): Calculate the median.
A) 26.55 million dollars
B) 5.15 million dollars
C) 39.19 million dollars
D) 54.00 million dollars
Calculate the median.A) 26.55 million dollars
B) 5.15 million dollars
C) 39.19 million dollars
D) 54.00 million dollars
Unlock Deck
Unlock for access to all 141 flashcards in this deck.
Unlock Deck
k this deck
12
Which measure of central tendency may have more than one value in a numeric data set?
A) Mode
B) Median
C) Mean
D) Midrange
A) Mode
B) Median
C) Mean
D) Midrange
Unlock Deck
Unlock for access to all 141 flashcards in this deck.
Unlock Deck
k this deck
13
Which measure of central tendency is not resistant to extreme values in a numeric data set?
A) Mean
B) Mode
C) Median
D) Parameters
A) Mean
B) Mode
C) Median
D) Parameters
Unlock Deck
Unlock for access to all 141 flashcards in this deck.
Unlock Deck
k this deck
14
The commuting times of ten employees (in minutes) are listed below. Find the mode score.65 66 67 66 67 70 67 70 71 68
A) 67 minutes
B) 65 minutes
C) 66 minutes
D) 68 minutes
A) 67 minutes
B) 65 minutes
C) 66 minutes
D) 68 minutes
Unlock Deck
Unlock for access to all 141 flashcards in this deck.
Unlock Deck
k this deck
15
The ________ of a variable is computed by determining the sum of all the values of the variable in the data setand dividing this sum by the number of observations in the data set.
A) Arithmetic mean
B) Median
C) Mode
D) Geometric mean
A) Arithmetic mean
B) Median
C) Mode
D) Geometric mean
Unlock Deck
Unlock for access to all 141 flashcards in this deck.
Unlock Deck
k this deck
16
The following data represents a random sample of 15 complaints registered with the customer servicedepartment of a store. Determine the median complaint.
A) No median
B) Messy store
C) Defective product
D) Excessive waiting time
A) No median
B) Messy store
C) Defective product
D) Excessive waiting time
Unlock Deck
Unlock for access to all 141 flashcards in this deck.
Unlock Deck
k this deck
17
The February utility bills (in dollars) for ten residents of a large city are listed below. Find the mode amount.71 67 67 72 76 72 73 68 72 72
A) $72
B) $67
C) $76
D) $73
A) $72
B) $67
C) $76
D) $73
Unlock Deck
Unlock for access to all 141 flashcards in this deck.
Unlock Deck
k this deck
18
A numerical summary of a population is a
A) Parameter
B) Statistic
C) Variable
D) Qualitative response
A) Parameter
B) Statistic
C) Variable
D) Qualitative response
Unlock Deck
Unlock for access to all 141 flashcards in this deck.
Unlock Deck
k this deck
19
The following data represent the bachelor degrees of CEOʹs at area small businesses. Determine the modedegree.
A) business
B) accounting
C) marketing
D) no mode
A) business
B) accounting
C) marketing
D) no mode
Unlock Deck
Unlock for access to all 141 flashcards in this deck.
Unlock Deck
k this deck
20
Describe the shape of the histogram. The data set: Pick-Three lottery results for 10 consecutive weeks
A) uniform
B) symmetric
C) skewed to the left
D) skewed to the right
A) uniform
B) symmetric
C) skewed to the left
D) skewed to the right
Unlock Deck
Unlock for access to all 141 flashcards in this deck.
Unlock Deck
k this deck
21
Describe the shape of the histogram. The data set: age of 20 household stereo systems randomly selectedfrom a neighborhood
A) symmetric
B) uniform
C) skewed to the left
D) skewed to the right
A) symmetric
B) uniform
C) skewed to the left
D) skewed to the right
Unlock Deck
Unlock for access to all 141 flashcards in this deck.
Unlock Deck
k this deck
22
13, 14, 15, 16, 17
A) 4
B) 17
C) 0.8
D) 13
A) 4
B) 17
C) 0.8
D) 13
Unlock Deck
Unlock for access to all 141 flashcards in this deck.
Unlock Deck
k this deck
23
Which measure of central tendency is more representative of the typical observation if the graph of the data isskewed to the right?
A) Median
B) Mean
C) Mode
D) Midrange
A) Median
B) Mean
C) Mode
D) Midrange
Unlock Deck
Unlock for access to all 141 flashcards in this deck.
Unlock Deck
k this deck
24
Which measure of central tendency is more representative of the typical observation if the graph of the data isskewed to the left?
A) Median
B) Mean
C) Mode
D) Midrange
A) Median
B) Mean
C) Mode
D) Midrange
Unlock Deck
Unlock for access to all 141 flashcards in this deck.
Unlock Deck
k this deck
25
Many firms use on-the-job training to teach their employees new software. Suppose you work in the personneldepartment of a firm that just finished training a group of its employees in new software, and you have beenrequested to review the performance of one of the trainees on the final test that was given to all trainees. Themean of the test scores is 76. Additional information indicated that the median of the test scores was 83. Whattype of distribution most likely describes the shape of the test scores?
A) skewed to the left
B) symmetric
C) skewed to the right
D) unable to determine with the information given
A) skewed to the left
B) symmetric
C) skewed to the right
D) unable to determine with the information given
Unlock Deck
Unlock for access to all 141 flashcards in this deck.
Unlock Deck
k this deck
26
In distributions that are skewed to the right, what is the relationship of the mean, median, and mode?
A) mean > median > mode
B) median > mean > mode
C) mode > median > mean
D) mode > mean > median
A) mean > median > mode
B) median > mean > mode
C) mode > median > mean
D) mode > mean > median
Unlock Deck
Unlock for access to all 141 flashcards in this deck.
Unlock Deck
k this deck
27
The annual profits of five large corporations in a certain area are given below. Which measure of centraltendency should be used?$135,000 $143,000 $163,000 $133,000 $1,213,000
A) median
B) mean
C) mode
D) midrange
A) median
B) mean
C) mode
D) midrange
Unlock Deck
Unlock for access to all 141 flashcards in this deck.
Unlock Deck
k this deck
28
3, 3, 3, 17, 29, 29, 29
A) 26
B) 16.1
C) 17
D) 169.1
A) 26
B) 16.1
C) 17
D) 169.1
Unlock Deck
Unlock for access to all 141 flashcards in this deck.
Unlock Deck
k this deck
29
If the graph of a distribution of data shows that the graph is skewed to the right then the
D) No conclusion about the relative position of the mean and the median can be made
D) No conclusion about the relative position of the mean and the median can be made
Unlock Deck
Unlock for access to all 141 flashcards in this deck.
Unlock Deck
k this deck
30
Describe the shape of the histogram. The data set: round-trip commuting times (in minutes) of 20 randomlyselected employees
A) skewed to the right
B) uniform
C) skewed to the left
D) symmetric
A) skewed to the right
B) uniform
C) skewed to the left
D) symmetric
Unlock Deck
Unlock for access to all 141 flashcards in this deck.
Unlock Deck
k this deck
31
In distributions that are skewed to the left, what is the relationship of the mean, median, and mode?
A) mode > median > mean
B) mean > median > mode
C) mode < mean < median
D) mode > mean > median
A) mode > median > mean
B) mean > median > mode
C) mode < mean < median
D) mode > mean > median
Unlock Deck
Unlock for access to all 141 flashcards in this deck.
Unlock Deck
k this deck
32
The output below gives the mean and median for the national dropout rates of high school students in 2010and 2012. 51Use the sample information to determine the shape of the distributions of the high school dropout rates in 2010and 2012.
51Use the sample information to determine the shape of the distributions of the high school dropout rates in 2010and 2012. Unlock Deck
Unlock for access to all 141 flashcards in this deck.
Unlock Deck
k this deck
33
9, 20, 9, 20, 9, 20, 9, 20
A) 11
B) 20
C) 14.5
D) 22
A) 11
B) 20
C) 14.5
D) 22
Unlock Deck
Unlock for access to all 141 flashcards in this deck.
Unlock Deck
k this deck
34
For the distribution drawn here, identify the mean, median, and mode.A) A = mode, B = median, C = mean
B) A = median, B = mode, C = mean
C) A = mode, B = mean, C = median
D) A = mean, B = mode, C = median
Unlock Deck
Unlock for access to all 141 flashcards in this deck.
Unlock Deck
k this deck
35
8, 19, 2, 13, 9
A) 17
B) 19
C) 2
D) 1
A) 17
B) 19
C) 2
D) 1
Unlock Deck
Unlock for access to all 141 flashcards in this deck.
Unlock Deck
k this deck
36
The distribution of salaries of professional basketball players is skewed to the right. Which measure of centraltendency would be the best measure to determine the location of the center of the distribution?
A) median
B) mode
C) mean
D) frequency
A) median
B) mode
C) mean
D) frequency
Unlock Deck
Unlock for access to all 141 flashcards in this deck.
Unlock Deck
k this deck
37
25, 34, 13, 42, 52
A) 39
B) 52
C) 13
D) 33.2
A) 39
B) 52
C) 13
D) 33.2
Unlock Deck
Unlock for access to all 141 flashcards in this deck.
Unlock Deck
k this deck
38
If the graph of a distribution of data shows that the graph is skewed to the left then the
D) No conclusion about the relative position of the mean and the median can be made
D) No conclusion about the relative position of the mean and the median can be made
Unlock Deck
Unlock for access to all 141 flashcards in this deck.
Unlock Deck
k this deck
39
If the graph of a distribution of data shows that the graph is symmetric then the
A) Mean is a better measure of central tendency
B) Median is a better measure of central tendency
C) Mode is a better measure of central tendency
D) Midrange is a better measure of central tendency
A) Mean is a better measure of central tendency
B) Median is a better measure of central tendency
C) Mode is a better measure of central tendency
D) Midrange is a better measure of central tendency
Unlock Deck
Unlock for access to all 141 flashcards in this deck.
Unlock Deck
k this deck
40
A severe drought affected several western states for 3 years. A Christmas tree farmer is worried about thedroughtʹs effect on the size of his trees. To decide whether the growth of the trees has been retarded, the farmerdecides to take a sample of the heights of 25 trees and obtains the following results (recorded in inches): Which measure of central tendency would be considered the best measure to use in this problem?
A) mean
B) median
C) mode
D) range
Which measure of central tendency would be considered the best measure to use in this problem?A) mean
B) median
C) mode
D) range
Unlock Deck
Unlock for access to all 141 flashcards in this deck.
Unlock Deck
k this deck
41
The April precipitation amounts (in inches) for 10 cities are listed below. Find the range of the data.2.0 3.2 1.8 2.9 0.9 4.0 3.3 2.9 3.6 0.8
A) 3.2 inches
B) 2.45 inches
C) 1.4 inches
D) 2.8 inches
A) 3.2 inches
B) 2.45 inches
C) 1.4 inches
D) 2.8 inches
Unlock Deck
Unlock for access to all 141 flashcards in this deck.
Unlock Deck
k this deck
42
15, 16, 17, 18, 19
A) 1.6
B) 2.5
C) 1.3
D) 1.5
A) 1.6
B) 2.5
C) 1.3
D) 1.5
Unlock Deck
Unlock for access to all 141 flashcards in this deck.
Unlock Deck
k this deck
43
88, 87, 21, 86, 38, 44, 43, 47, 80
A) 25.7
B) 23.0
C) 589.3
D) 530.4
A) 25.7
B) 23.0
C) 589.3
D) 530.4
Unlock Deck
Unlock for access to all 141 flashcards in this deck.
Unlock Deck
k this deck
44
The top speeds (in mph) for a sample of five new automobile brands are listed below. Calculate the standarddeviation of the speeds.160, 125, 190, 185, 105
A) 37.2 mph
B) 28,458.00 mph
C) 153.00 mph
D) 85 mph
A) 37.2 mph
B) 28,458.00 mph
C) 153.00 mph
D) 85 mph
Unlock Deck
Unlock for access to all 141 flashcards in this deck.
Unlock Deck
k this deck
45
11, 11, 11, 14, 17, 17, 17
A) 3
B) 2.8
C) 7.7
D) 9.0
A) 3
B) 2.8
C) 7.7
D) 9.0
Unlock Deck
Unlock for access to all 141 flashcards in this deck.
Unlock Deck
k this deck
46
The book cost (in dollars) for one semesterʹs books are given below for a sample of five college students.Calculate the sample variance of the book costs.200, 130, 400, 500, 345
A) 22,450.00
B) 149.83
C) 370.00
D) 315.00
A) 22,450.00
B) 149.83
C) 370.00
D) 315.00
Unlock Deck
Unlock for access to all 141 flashcards in this deck.
Unlock Deck
k this deck
47
Over the last 10 years four mutual funds all had the same mean rate of return, 12%. These mutual funds haddifferent standard deviations as follows: Mutual Money 8%, Co-joined Investments 6%, Together Fund 4%, Allfor One Fund 9%. Which mutual fund investment is the most consistent in rate of return?
A) Together Fund
B) Mutual Money
C) Co-joined Investments
D) All for One Fund
A) Together Fund
B) Mutual Money
C) Co-joined Investments
D) All for One Fund
Unlock Deck
Unlock for access to all 141 flashcards in this deck.
Unlock Deck
k this deck
48
112, 494, 230, 565, 401, 257
A) 453
B) 565
C) 112
D) 343.2
A) 453
B) 565
C) 112
D) 343.2
Unlock Deck
Unlock for access to all 141 flashcards in this deck.
Unlock Deck
k this deck
49
The ages of five randomly selected students in the biology department at a private university are 30, 26, 27, 25,and 29. Calculate the sample variance of these ages.
Unlock Deck
Unlock for access to all 141 flashcards in this deck.
Unlock Deck
k this deck
50
19, 16, 17, 12, 8, 7, 16, 9, 12
A) 4.3
B) 4.1
C) 18.6
D) 16.5
A) 4.3
B) 4.1
C) 18.6
D) 16.5
Unlock Deck
Unlock for access to all 141 flashcards in this deck.
Unlock Deck
k this deck
51
9, 9, 7, 1, 6, 10, 9, 7, 9
A) 9
B) 10
C) 7.4
D) 11
A) 9
B) 10
C) 7.4
D) 11
Unlock Deck
Unlock for access to all 141 flashcards in this deck.
Unlock Deck
k this deck
52
11, 5, 11, 13, 16, 13, 19, 12, 12, 19
A) 4.1
B) 3.8
C) 1.5
D) 3.6
A) 4.1
B) 3.8
C) 1.5
D) 3.6
Unlock Deck
Unlock for access to all 141 flashcards in this deck.
Unlock Deck
k this deck
53
The costs (in dollars) of 10 college math textbooks are listed below. Find the sample standard deviation.70 72 71 70 69 73 69 68 70 71
A) $1.49
B) $70.30
C) $5.00
D) $2.23
A) $1.49
B) $70.30
C) $5.00
D) $2.23
Unlock Deck
Unlock for access to all 141 flashcards in this deck.
Unlock Deck
k this deck
54
262, 296, 116, 174, 162, 287, 220, 287, 201
A) 64.3
B) 60.6
C) 4138.2
D) 3678.4
A) 64.3
B) 60.6
C) 4138.2
D) 3678.4
Unlock Deck
Unlock for access to all 141 flashcards in this deck.
Unlock Deck
k this deck
55
The costs (in dollars) of 10 college math textbooks are listed below. Find the population standard deviationand the population variance.70 72 71 70 69 73 69 68 70 71
Unlock Deck
Unlock for access to all 141 flashcards in this deck.
Unlock Deck
k this deck
56
4, 1, 8, 14, 7, 12, 16, 17, 10
A) 5.4
B) 5.1
C) 29.4
D) 26.1
A) 5.4
B) 5.1
C) 29.4
D) 26.1
Unlock Deck
Unlock for access to all 141 flashcards in this deck.
Unlock Deck
k this deck
57
0.23, 0.12, 0.554, 0.379, 0.575, 0.257
A) 0.455
B) 0.575
C) 0.12
D) 0.353 Find the sample standard deviation.
A) 0.455
B) 0.575
C) 0.12
D) 0.353 Find the sample standard deviation.
Unlock Deck
Unlock for access to all 141 flashcards in this deck.
Unlock Deck
k this deck
58
67, 140, 25, 90, 176
A) 151
B) 176
C) 25
D) 99.6
A) 151
B) 176
C) 25
D) 99.6
Unlock Deck
Unlock for access to all 141 flashcards in this deck.
Unlock Deck
k this deck
59
The January utility bills (in dollars) for 20 residents of a large city are listed below. Find the range of the data.
A) $7
B) $2.98
C) $2
D) $1.73
A) $7
B) $2.98
C) $2
D) $1.73
Unlock Deck
Unlock for access to all 141 flashcards in this deck.
Unlock Deck
k this deck
60
2.8, 5.8, 1.6, 4.4, 6.7, 3.8
A) 5.1
B) 6.7
C) 1.6
D) 4.2
A) 5.1
B) 6.7
C) 1.6
D) 4.2
Unlock Deck
Unlock for access to all 141 flashcards in this deck.
Unlock Deck
k this deck
61
At a tennis tournament a statistician keeps track of every serve. The statistician reported that the mean servespeed of a particular player was 104 miles per hour (mph) and the standard deviation of the serve speeds was 8mph. Assume that the statistician also gave us the information that the distribution of the serve speeds was bellshaped. What proportion of the playerʹs serves are expected to be between 112 mph and 120 mph?
A) 0.1350
B) 0.270
C) 0.95
D) 0.68
A) 0.1350
B) 0.270
C) 0.95
D) 0.68
Unlock Deck
Unlock for access to all 141 flashcards in this deck.
Unlock Deck
k this deck
62
A study was designed to investigate the effects of two variables - (1) a studentʹs level of mathematical anxietyand (2) teaching method - on a studentʹs achievement in a mathematics course. Students who had a low levelof mathematical anxiety were taught using the traditional expository method. These students obtained a meanscore of 460 with a standard deviation of 40 on a standardized test. Assuming a bell-shaped distribution,where would approximately 68% of the students score?
A) between 420 and 500
B) between 380 and 540
C) below 380 or above 540
D) below 420 or above 500
A) between 420 and 500
B) between 380 and 540
C) below 380 or above 540
D) below 420 or above 500
Unlock Deck
Unlock for access to all 141 flashcards in this deck.
Unlock Deck
k this deck
63
True or False: Variance is the square root of standard deviation.
Unlock Deck
Unlock for access to all 141 flashcards in this deck.
Unlock Deck
k this deck
64
The scores from a state standardized test have a bell-shaped distribution with a mean of 100 and a standarddeviation of 15. Use the Empirical Rule to find the percentage of students with scores between 70 and 130.
A) 95%
B) 68%
C) 99.7%
D) 100%
A) 95%
B) 68%
C) 99.7%
D) 100%
Unlock Deck
Unlock for access to all 141 flashcards in this deck.
Unlock Deck
k this deck
65
Last year batting averages in professional baseball averaged 0.266 with a high of 0.334 and a low of 0.228(minimum 250 at-bats). Based on this information, which measure of variation could be calculated?
A) range
B) variance
C) standard deviation
D) percentile
A) range
B) variance
C) standard deviation
D) percentile
Unlock Deck
Unlock for access to all 141 flashcards in this deck.
Unlock Deck
k this deck
66
A small computing center has found that the number of jobs submitted per day to its computers has adistribution that is approximately bell shaped, with a mean of 84 jobs and a standard deviation of 10. Where dowe expect most (approximately 95%) of the distribution to fall?
A) between 64 and 104 jobs per day
B) between 74 and 94 jobs per day
C) between 54 and 114 jobs per day
D) between 64 and 114 jobs per day
A) between 64 and 104 jobs per day
B) between 74 and 94 jobs per day
C) between 54 and 114 jobs per day
D) between 64 and 114 jobs per day
Unlock Deck
Unlock for access to all 141 flashcards in this deck.
Unlock Deck
k this deck
67
Health care issues are receiving much attention in both academic and political arenas. A sociologist recentlyconducted a survey of citizens over 60 years of age whose net worth is too high to qualify for governmenthealth care but who have no private health insurance. The ages of 25 uninsured senior citizens were as follows: Suppose the mean and standard deviation are 74.0 and 9.7, respectively. If we assume that the distribution ofages is bell shaped, what percentage of the respondents will be between 64.3 and 93.4 years old?
A) approximately 81.5%
B) approximately 68%
C) approximately 95%
D) approximately 83.9%
Suppose the mean and standard deviation are 74.0 and 9.7, respectively. If we assume that the distribution ofages is bell shaped, what percentage of the respondents will be between 64.3 and 93.4 years old?A) approximately 81.5%
B) approximately 68%
C) approximately 95%
D) approximately 83.9%
Unlock Deck
Unlock for access to all 141 flashcards in this deck.
Unlock Deck
k this deck
68
Each year advertisers spend billions of dollars purchasing commercial time on network sports television. In thefirst 6 months of 1988, advertisers spent $1.1 billion. Who were the largest spenders? In a recent article, listedthe top 10 leading spenders (in million of dollars): Calculate the sample variance.
A) 367.36
B) 19.17
C) 38.89
D) 51.30
Calculate the sample variance.A) 367.36
B) 19.17
C) 38.89
D) 51.30
Unlock Deck
Unlock for access to all 141 flashcards in this deck.
Unlock Deck
k this deck
69
A study was designed to investigate the effects of two variables - (1) a studentʹs level of mathematical anxietyand (2) teaching method - on a studentʹs achievement in a mathematics course. Students who had a low levelof mathematical anxiety were taught using the traditional expository method. These students obtained a meanscore of 460 with a standard deviation of 50 on a standardized test. Assuming a bell-shaped distribution, whatpercentage of scores exceeded 360?
A) approximately 97.5%
B) approximately 95%
C) approximately 2.5%
D) approximately 84%
A) approximately 97.5%
B) approximately 95%
C) approximately 2.5%
D) approximately 84%
Unlock Deck
Unlock for access to all 141 flashcards in this deck.
Unlock Deck
k this deck
70
For the data set given below the sample variance will be computed. How many degrees of freedom are there?6 9 6 1 5 11 5 9 8
A) 8
B) 9
C) 1
D) 10
A) 8
B) 9
C) 1
D) 10
Unlock Deck
Unlock for access to all 141 flashcards in this deck.
Unlock Deck
k this deck
71
The amount of television viewed by todayʹs youth is of primary concern to Parents Against WatchingTelevision (PAWT). 300 parents of elementary school-aged children were asked to estimate the number ofhours per week that their child watched television. The mean and the standard deviation for their responseswere 16 and 4, respectively. PAWT constructed a stem-and-leaf display for the data that showed that thedistribution of times was a bell-shaped distribution. Give an interval around the mean where you believe most(approximately 95%) of the television viewing times fell in the distribution.
A) between 8 and 24 hours per week
B) less than 12 and more than 20 hours per week
C) between 4 and 28 hours per week
D) between 12 and 20 hours per week
A) between 8 and 24 hours per week
B) less than 12 and more than 20 hours per week
C) between 4 and 28 hours per week
D) between 12 and 20 hours per week
Unlock Deck
Unlock for access to all 141 flashcards in this deck.
Unlock Deck
k this deck
72
Which is not a measure of dispersion?
A) Mean
B) Standard deviation
C) Variance
D) Range
A) Mean
B) Standard deviation
C) Variance
D) Range
Unlock Deck
Unlock for access to all 141 flashcards in this deck.
Unlock Deck
k this deck
73
Many firms use on-the-job training to teach their employees new software. Suppose you work in the personneldepartment of a firm that just finished training a group of its employees in new software, and you have beenrequested to review the performance of one of the trainees on the final test that was given to all trainees. Themean and standard deviation of the test scores are 80 and 3, respectively, and the distribution of scores is bellshaped. What percentage of test-takers scored better than a trainee who scored 71?
A) approximately 99.85%
B) approximately 84%
C) approximately 95%
D) approximately 97.5%
A) approximately 99.85%
B) approximately 84%
C) approximately 95%
D) approximately 97.5%
Unlock Deck
Unlock for access to all 141 flashcards in this deck.
Unlock Deck
k this deck
74
The _______________ is the easiest measure of dispersion to calculate.
A) Range
B) Standard deviation
C) Variance
D) Mean absolute deviation
A) Range
B) Standard deviation
C) Variance
D) Mean absolute deviation
Unlock Deck
Unlock for access to all 141 flashcards in this deck.
Unlock Deck
k this deck
75
Solar energy is considered by many to be the energy of the future. A recent survey was taken to compare thecost of solar energy to the cost of gas or electric energy. Results of the survey revealed that the distribution ofthe amount of the monthly utility bill of a 3-bedroom house using gas or electric energy had a mean of $120and a standard deviation of $11. If the distribution can be considered bell shaped, what percentage of homeswill have a monthly utility bill of more than $109?
A) approximately 84%
B) approximately 95%
C) approximately 16%
D) approximately 32%
A) approximately 84%
B) approximately 95%
C) approximately 16%
D) approximately 32%
Unlock Deck
Unlock for access to all 141 flashcards in this deck.
Unlock Deck
k this deck
76
In the computation of the sample standard variance, how many degrees of freedom are there in a data set thathas 15 data values?
A) 14
B) 15
C) 16
D) none of these
A) 14
B) 15
C) 16
D) none of these
Unlock Deck
Unlock for access to all 141 flashcards in this deck.
Unlock Deck
k this deck
77
A statistic is said to be biased if it
A) Systematically underestimates or overestimates a parameter
B) Has exactly the same value as the parameter
C) Is determined from a trimmed sample
D) Leads to an erroneous conclusion about the sample
A) Systematically underestimates or overestimates a parameter
B) Has exactly the same value as the parameter
C) Is determined from a trimmed sample
D) Leads to an erroneous conclusion about the sample
Unlock Deck
Unlock for access to all 141 flashcards in this deck.
Unlock Deck
k this deck
78
A severe drought affected several western states for 3 years. A Christmas tree farmer is worried about thedroughtʹs effect on the size of his trees. To decide whether the growth of the trees has been retarded, the farmerdecides to take a sample of the heights of 25 trees. Typically trees of this age have a mean height of 65 incheswith a standard deviation of 9 inches. Assuming the distribution is bell shaped, where do you expect middle95% of the tree heights to fall?
A) between 47 and 83 inches tall
B) between 56 and 74 inches tall
C) between 38 and 92 inches tall
D) over 56 inches tall
A) between 47 and 83 inches tall
B) between 56 and 74 inches tall
C) between 38 and 92 inches tall
D) over 56 inches tall
Unlock Deck
Unlock for access to all 141 flashcards in this deck.
Unlock Deck
k this deck
79
True or False: The variance of a population is the arithmetic average of the squared deviations about thepopulation mean.
Unlock Deck
Unlock for access to all 141 flashcards in this deck.
Unlock Deck
k this deck
80
The scores from a state standardized test have a mean of 80 and a standard deviation of 10. The distribution ofthe scores is roughly bell shaped. Use the Empirical Rule to find the percentage of scores that lie between 60and 80.
A) 47.5%
B) 68%
C) 34%
D) 95%
A) 47.5%
B) 68%
C) 34%
D) 95%
Unlock Deck
Unlock for access to all 141 flashcards in this deck.
Unlock Deck
k this deck
Unlock Deck
Unlock for access to all 141 flashcards in this deck.


