Deck 2: Graphical Summaries of Data
Full screen (f)
Question
The following frequency distribution presents the weights in pounds (lb)of a sample of visitors to 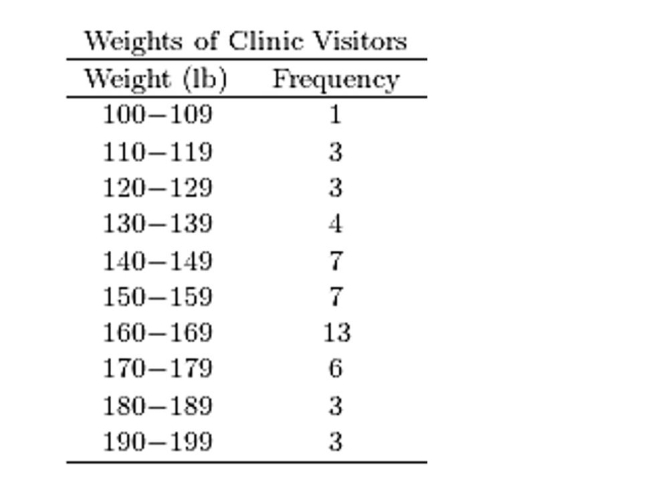 Construct a frequency histogram.
 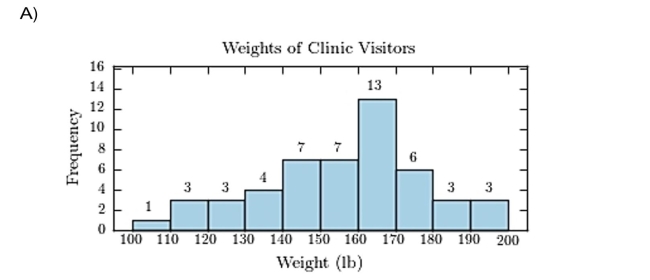 12
12 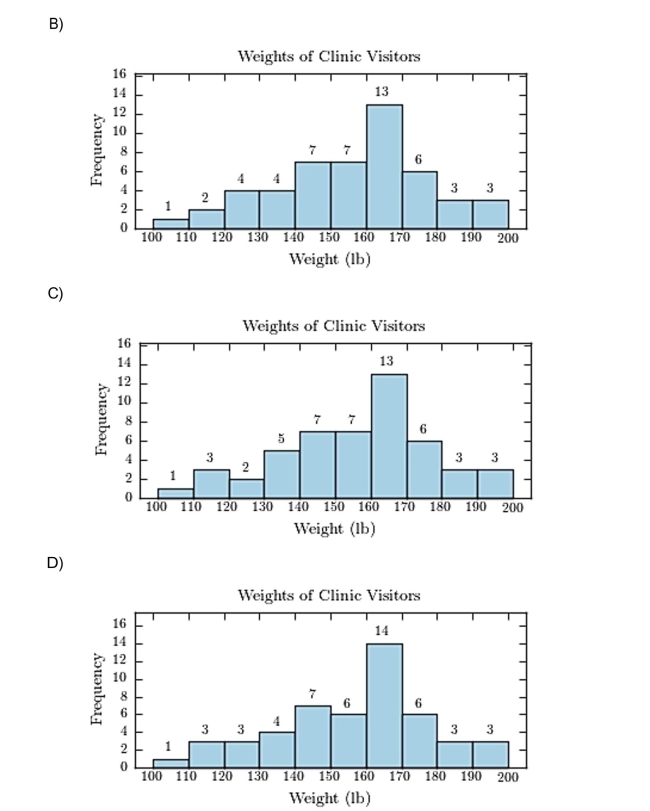
Construct a frequency histogram. 12 Question
The following pie chart presents the percentages of fish caught in each of four ratings categories. 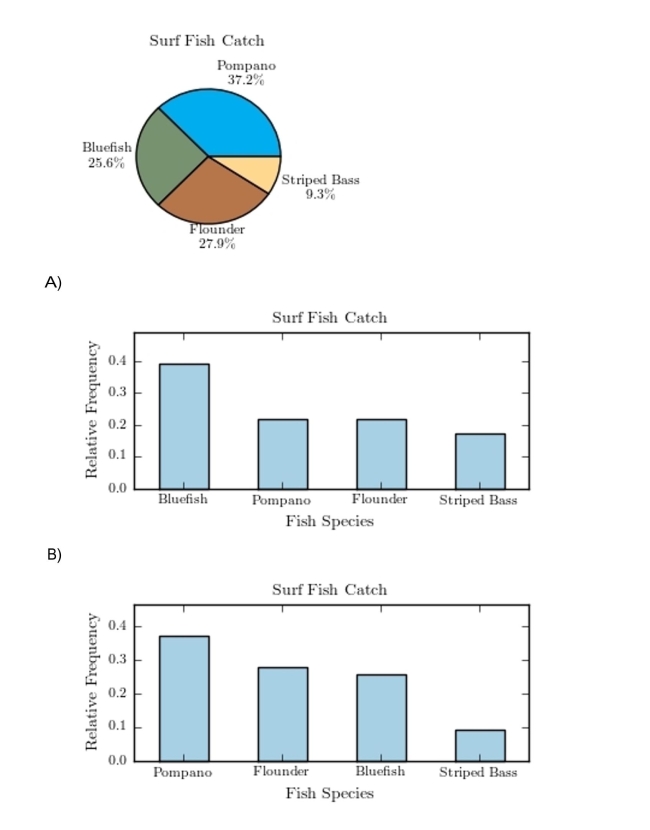 3
3 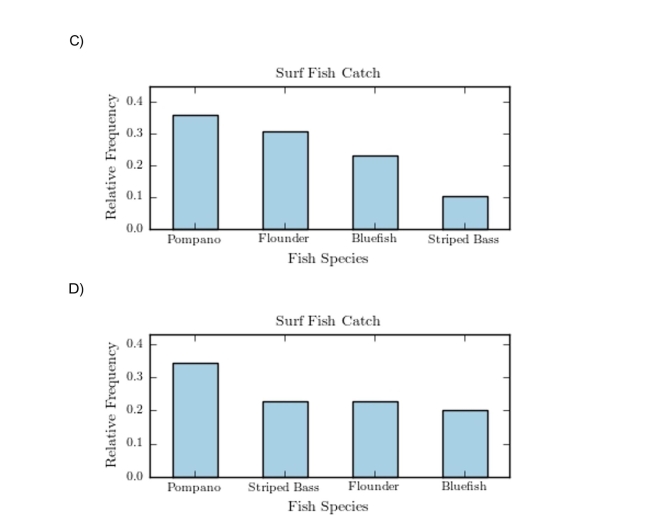
3 Question
Following is a pie chart that presents the percentages spent by a certain household on its five 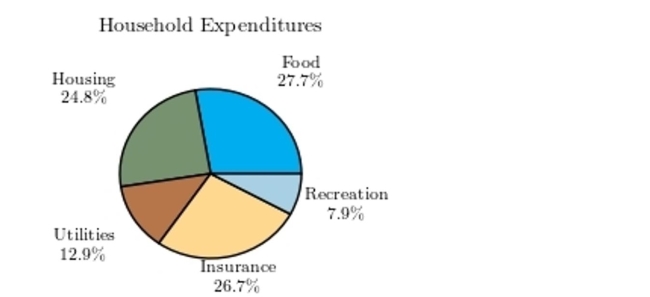
A)47%
B)52.5%
C)65.4%
D)60.4%
A)47%
B)52.5%
C)65.4%
D)60.4%
Question
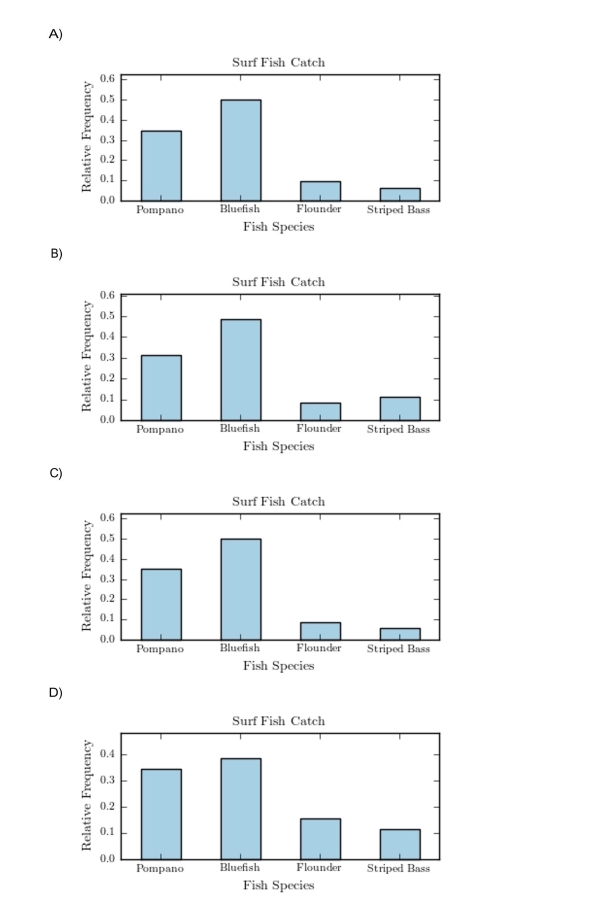
The following pie chart presents the percentages of fish caught in each of four ratings categories. 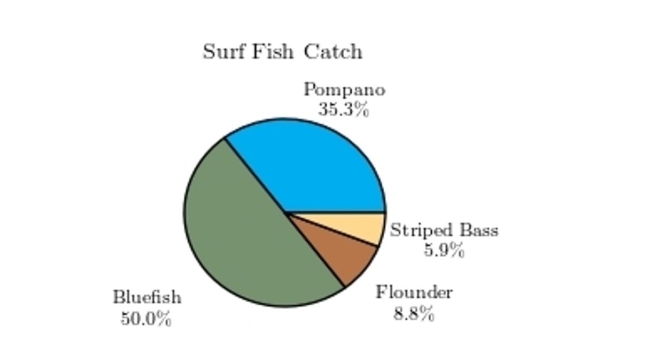
Question
Classify the histogram as skewed to the left,) 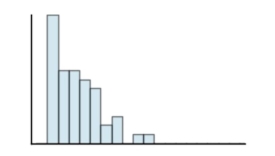
A)approximately symmetric
B)skewed to the left
C)skewed to the right
A)approximately symmetric
B)skewed to the left
C)skewed to the right
Question
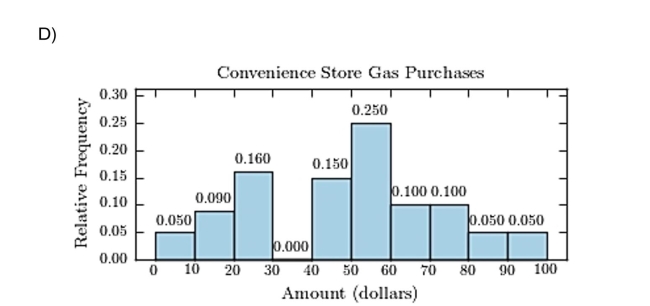
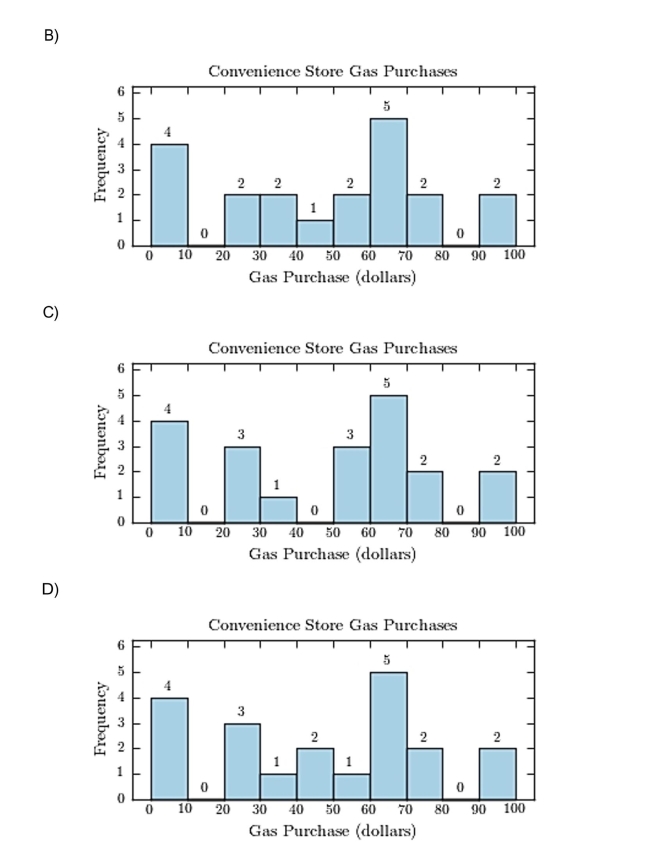
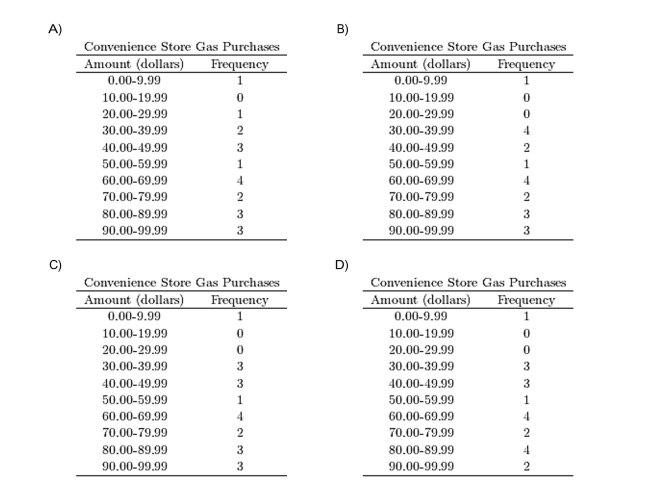
The following table presents the purchase totals (in dollars)of a random sample of gasolinepurchases at a convenience store.Construct a relative frequency histogram using a class width of 10, and using 0 as the lower classlimit for the first class. 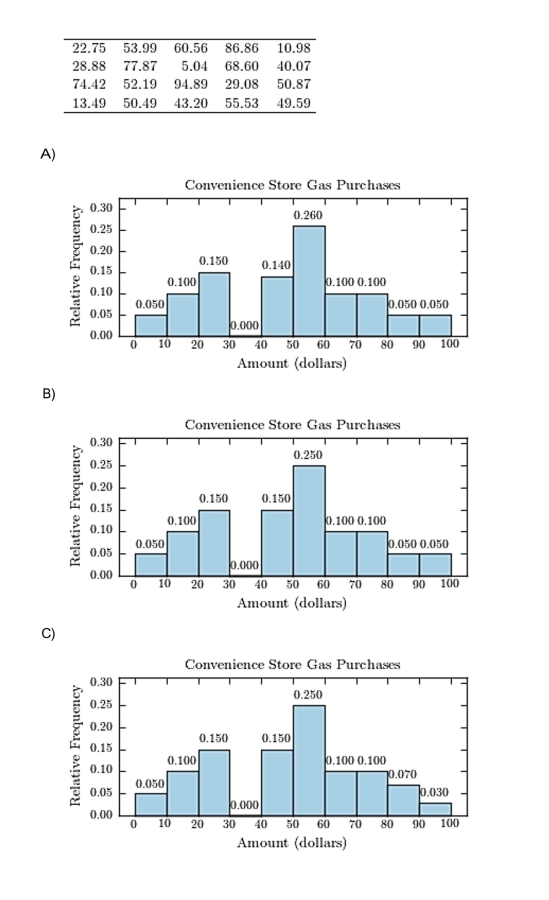
Question
Classify the histogram as unimodal or bimodal. ) 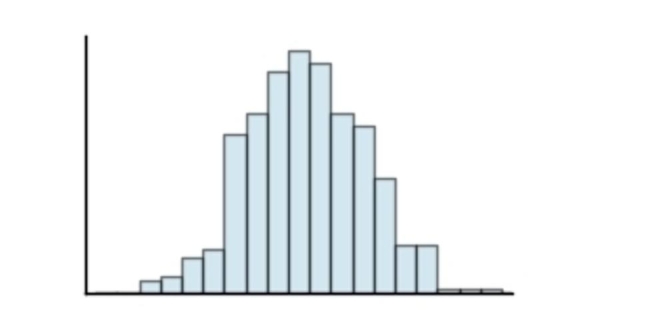
A)bimodal
B)unimodal
A)bimodal
B)unimodal
Question
The following frequency distribution presents the frequency of passenger vehicles that pass 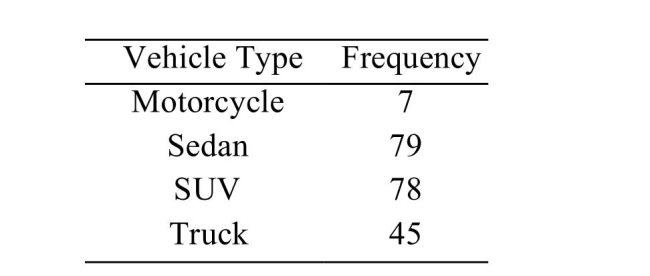 What is the relative frequency of the SUV category?
A)78%
B)0.987
C)0.373
D)78
What is the relative frequency of the SUV category?A)78%
B)0.987
C)0.373
D)78
Question
The following table presents the purchase totals (in dollars)of a random sample of gasoline 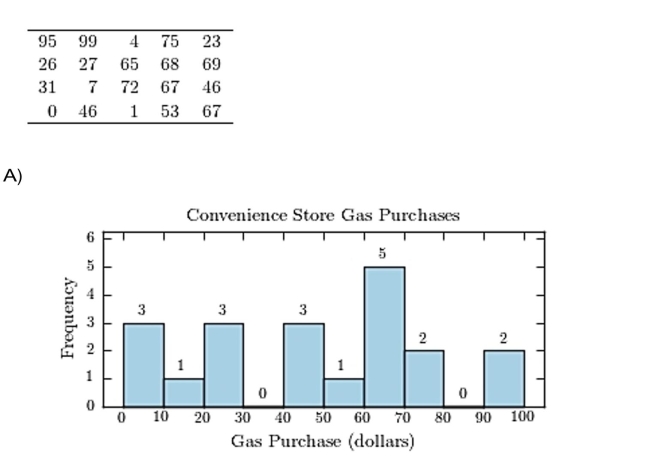
Question
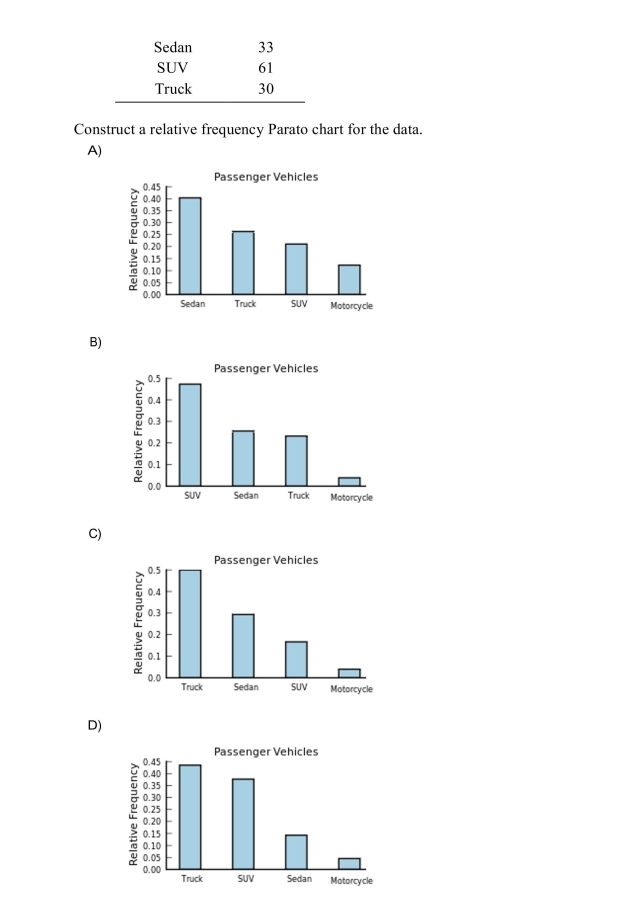
The following frequency distribution presents the frequency of passenger vehicles that pass 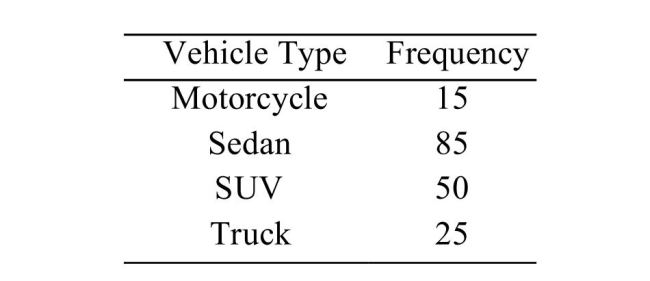 Construct a frequency bar graph for the data.
 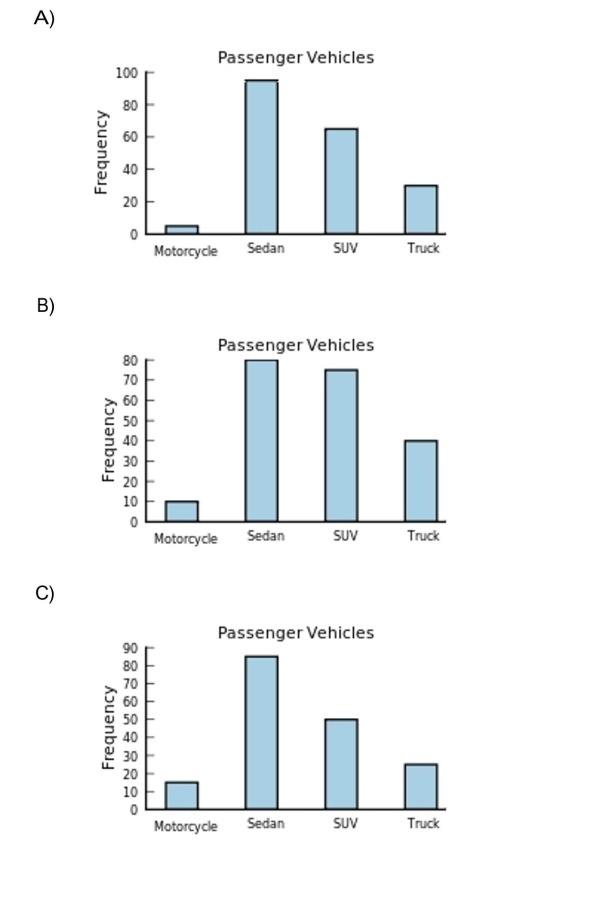 5
5 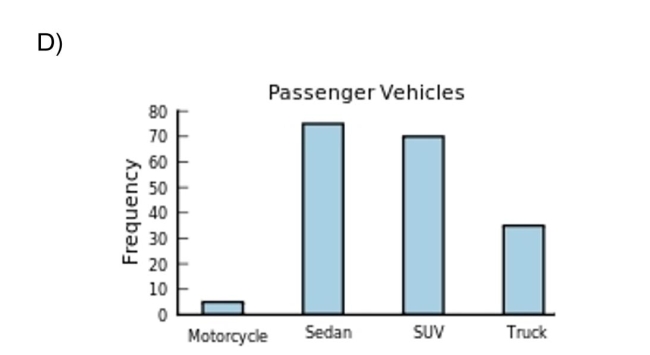
Construct a frequency bar graph for the data. 5 Question
The following frequency distribution presents the frequency of passenger vehicles that pass 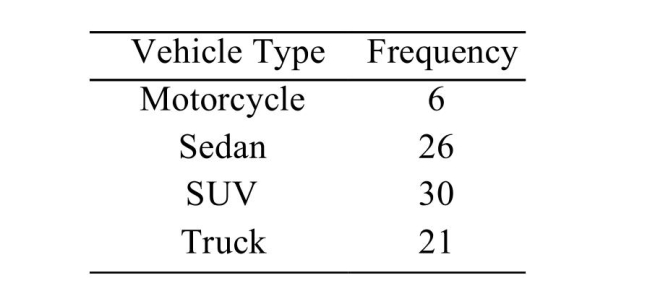 Construct a pie chart for the data.
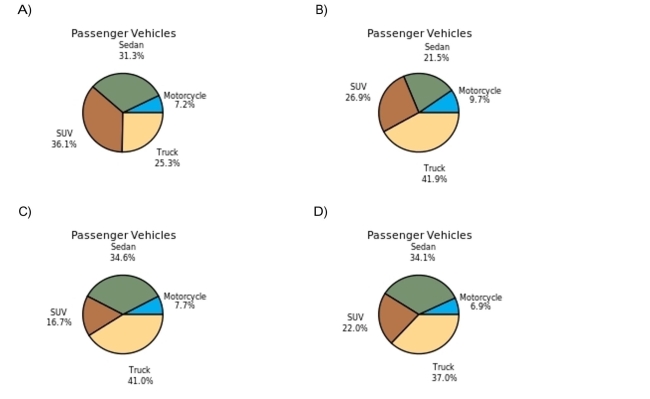
Construct a pie chart for the data. Question
The following bar graph presents the average amount a certain family spent, in dollars, on various 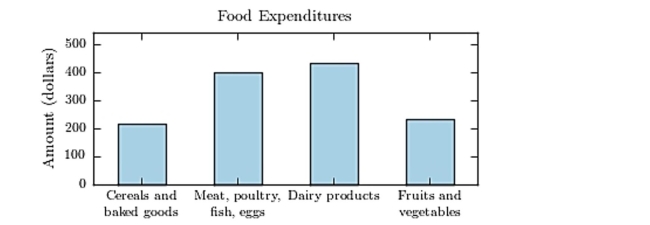
A)Cereals and baked goods
B)Dairy products
C)Fruits and vegetables
D)Meat poultry, fish, eggs
A)Cereals and baked goods
B)Dairy products
C)Fruits and vegetables
D)Meat poultry, fish, eggs
Question
The following frequency distribution presents the frequency of passenger vehicles that pass 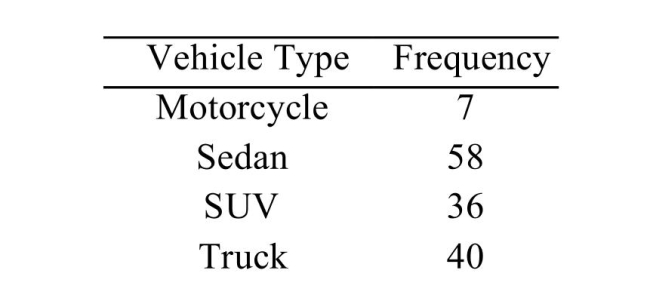 Construct a relative frequency bar graph for the data. 7
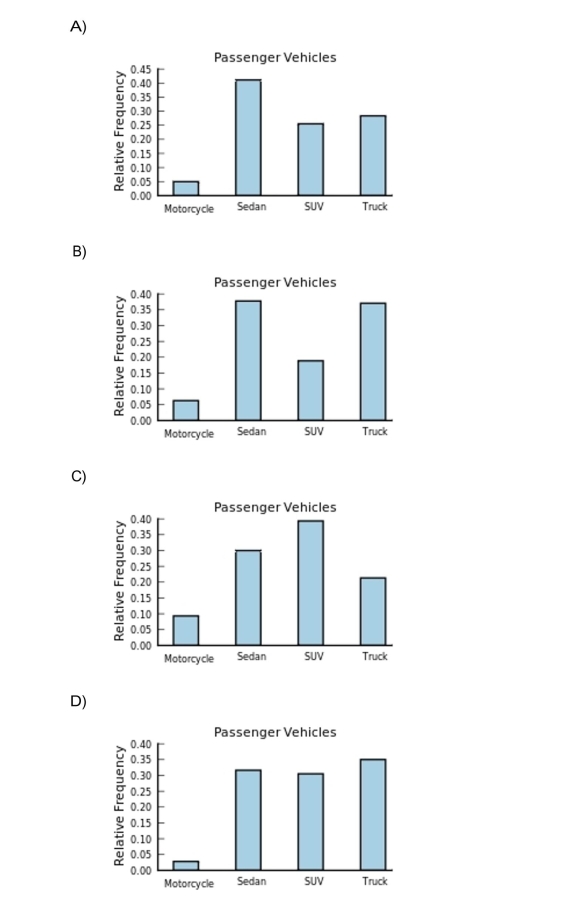
Construct a relative frequency bar graph for the data. 7 Question
One hundred students are shown an eight-digit number on a piece of cardboard for three seconds 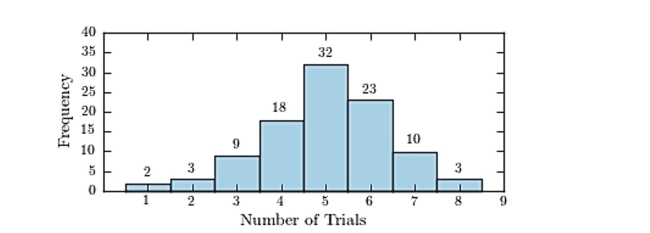 How many students memorized the number in three trials or less?
A)16
B)86
C)14
D)5
How many students memorized the number in three trials or less?A)16
B)86
C)14
D)5
Question
The following frequency distribution presents the frequency of passenger vehicles that pass 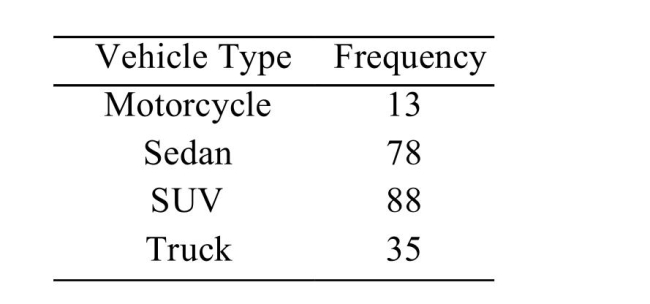 Construct a relative frequency distribution for the data.
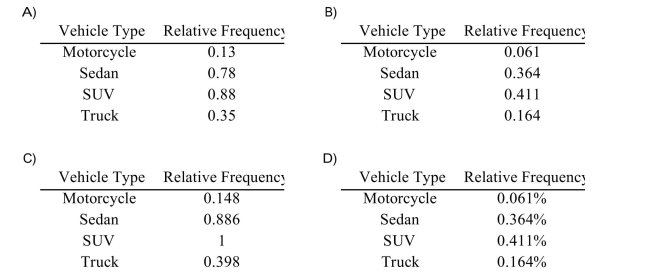
Construct a relative frequency distribution for the data. Question
The following frequency distribution presents the frequency of passenger vehicles that passthrough a certain intersection from 8:00 AM to 9:00 AM on a particular day. 8 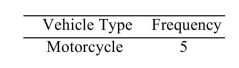
Question
The following table presents the purchase totals (in dollars)of a random sample of gasoline 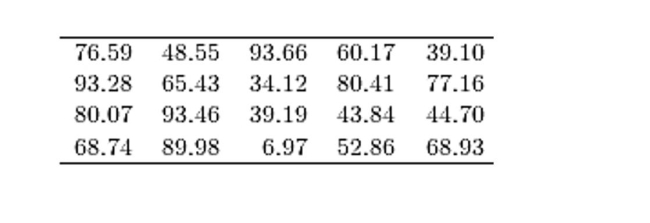
Question
The following table presents the purchase totals (in dollars)of a random sample of gasoline 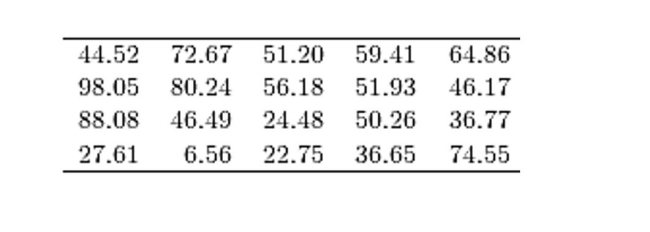 16
16 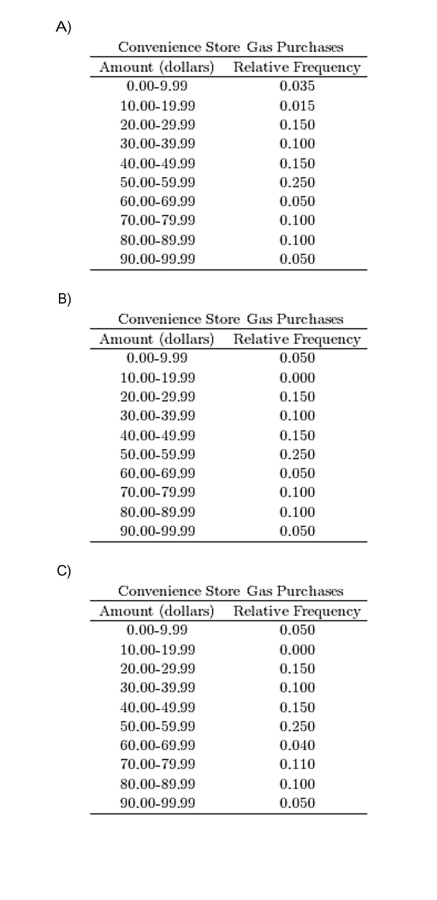 17
17 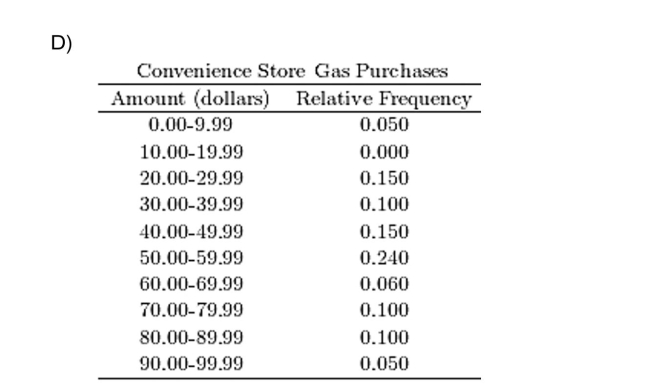
16 17 Question
The following frequency distribution presents the weights in pounds (lb)of a sample of visitors to 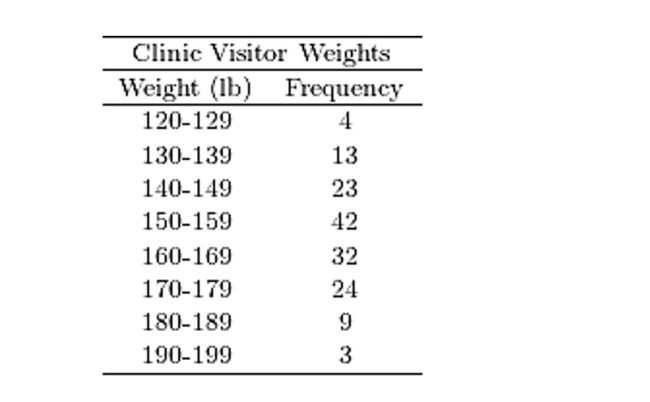 Construct a relative frequency histogram.
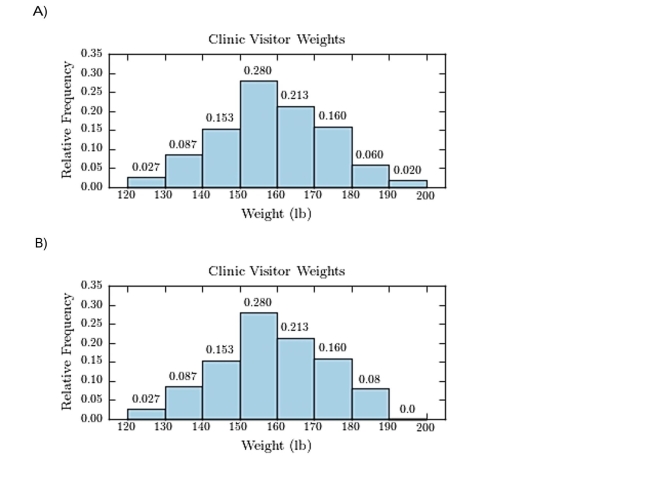
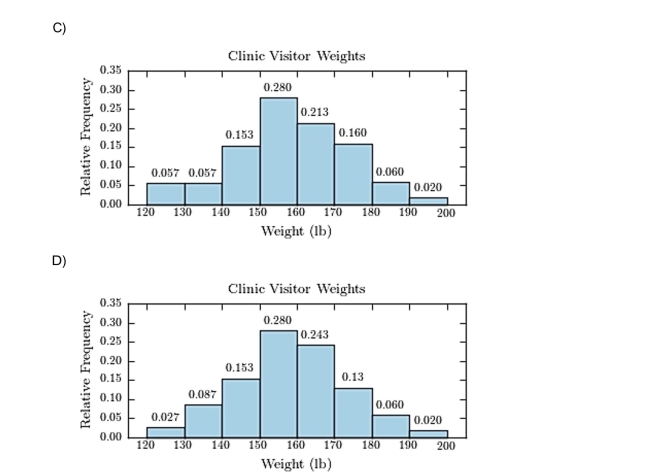
Construct a relative frequency histogram. Question
The following frequency distribution presents the weights in pounds (lb)of a sample of visitors to 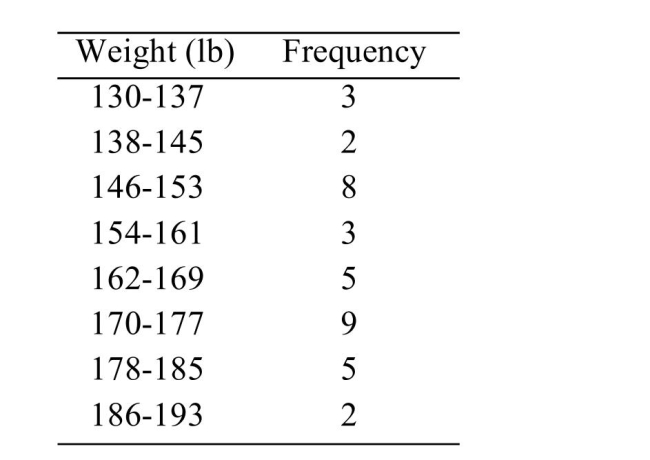 What is the class width?
A)7
B)8
C)64
D)9
What is the class width?A)7
B)8
C)64
D)9
Question
Which of the following presents the most honest graphical representation of the ratio"3 to 4"? 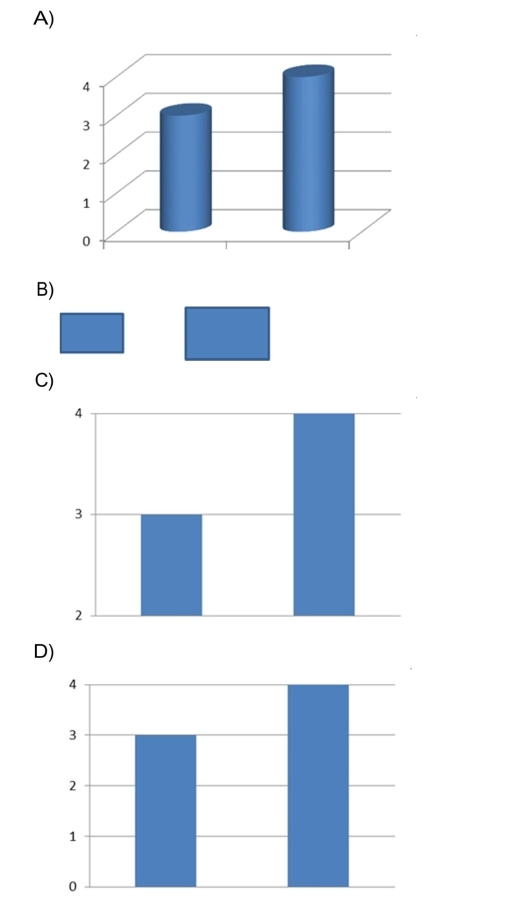
Question
Which of the following presents the most honest graphical representation of the ratio"5 to 2"? 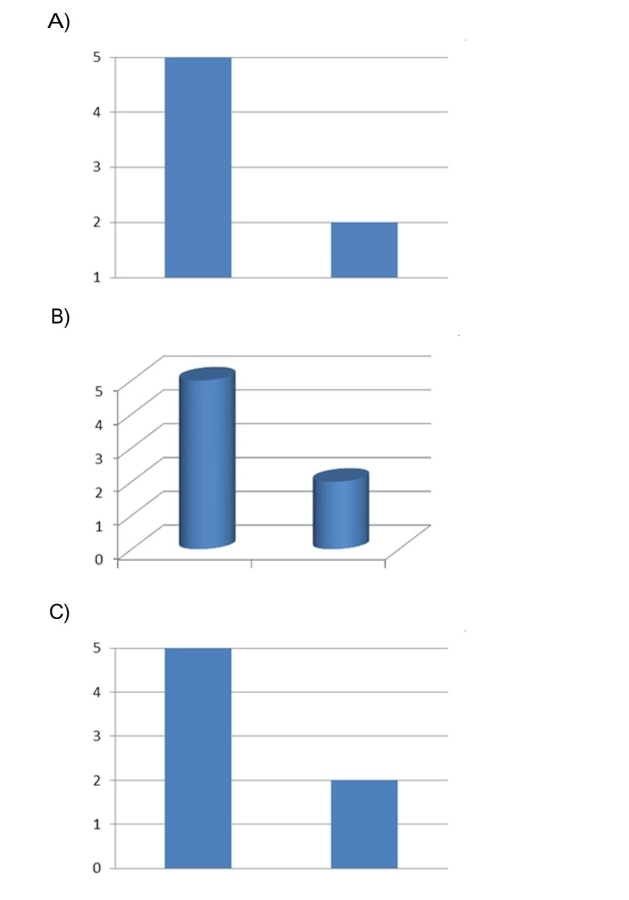 38
38 
38 Question
Construct a dotplot for the following data. ) 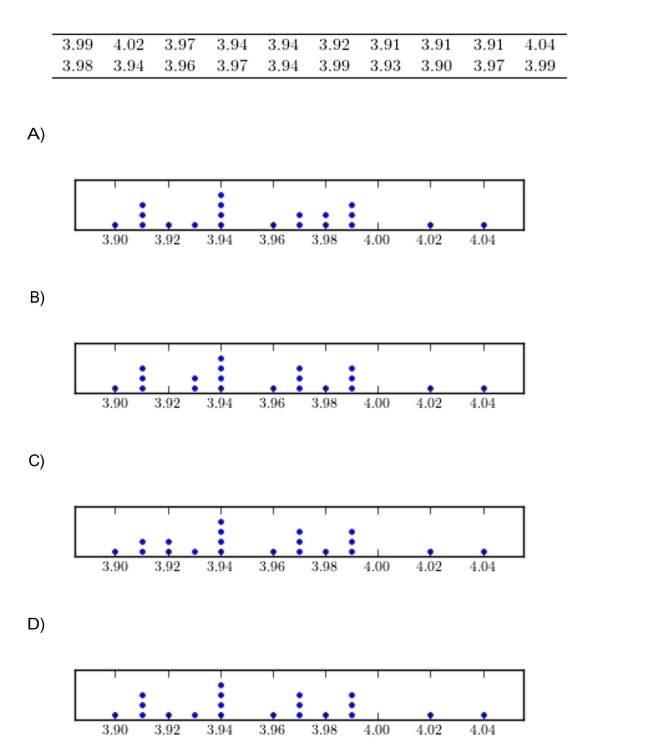
Question
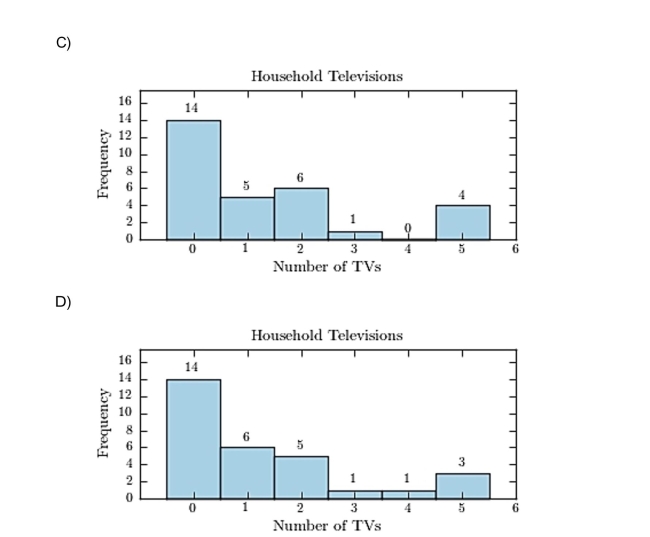
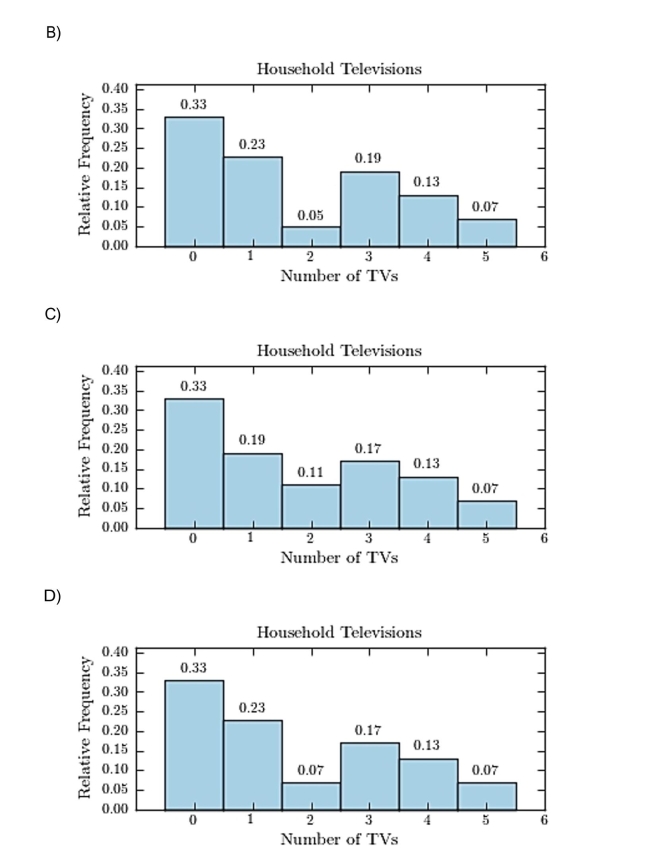
Thirty households were surveyed for the number of televisions in each home. ) 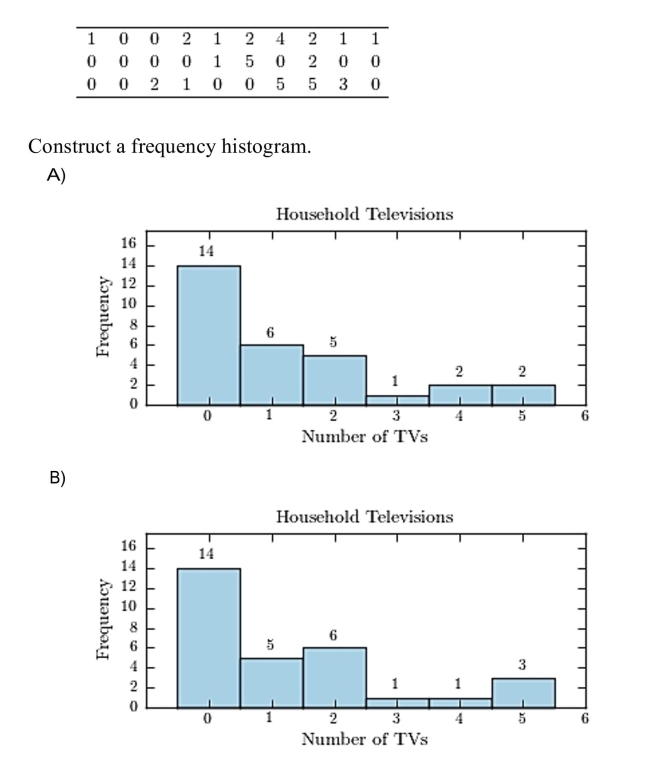
Question
Construct a dotplot for the following data. ) 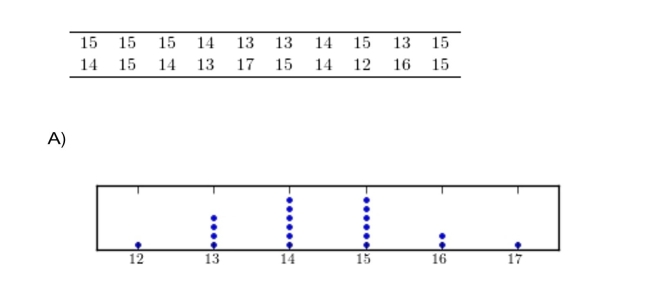 31
31 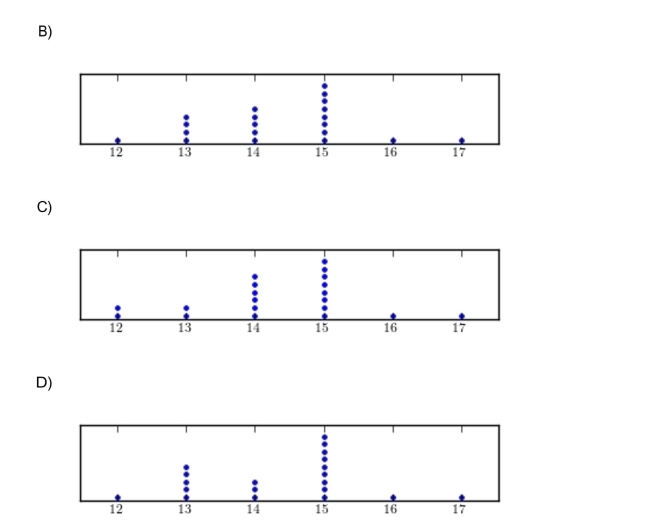
31 Question
Following are the numbers of Dean's List students in a random sample of 20 universitycourses. ) 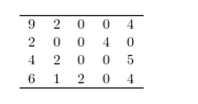 33
33 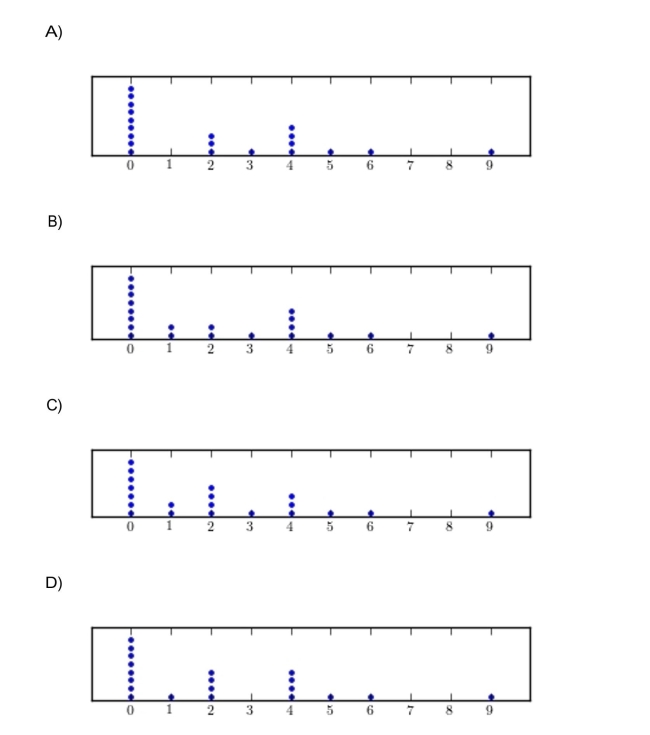
33 Question
A sample of 200 high school students were asked how many hours per week they spend watching 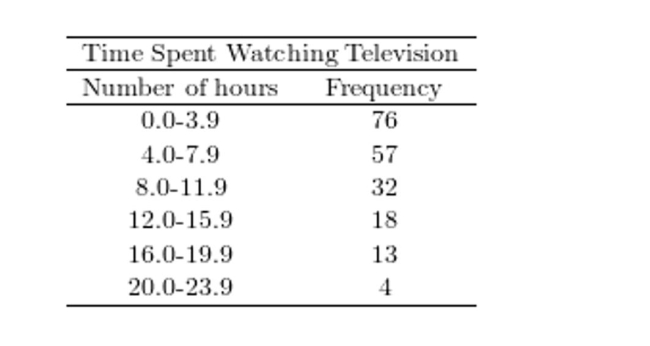 Construct a relative frequency ogive for the frequency distribution. 28
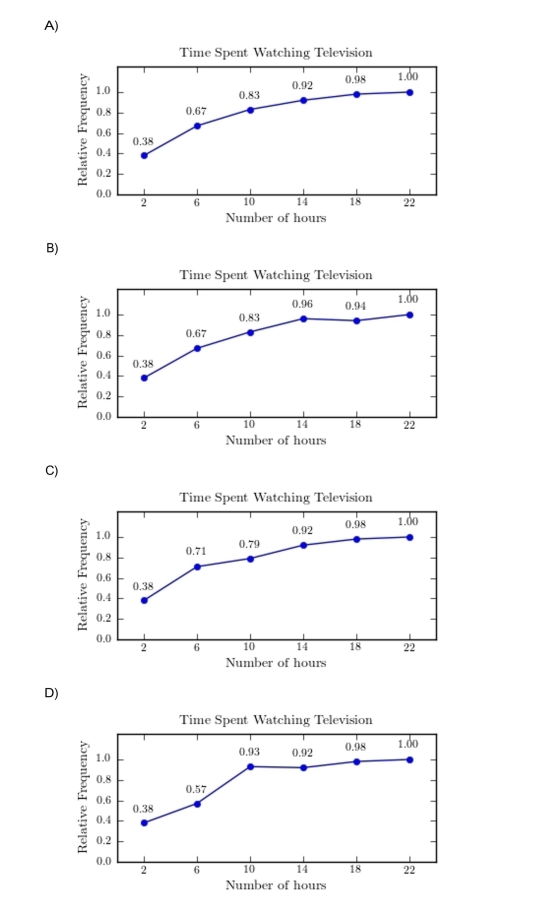
Construct a relative frequency ogive for the frequency distribution. 28 Question
Construct a stem-and-leaf plot for the following data. ) 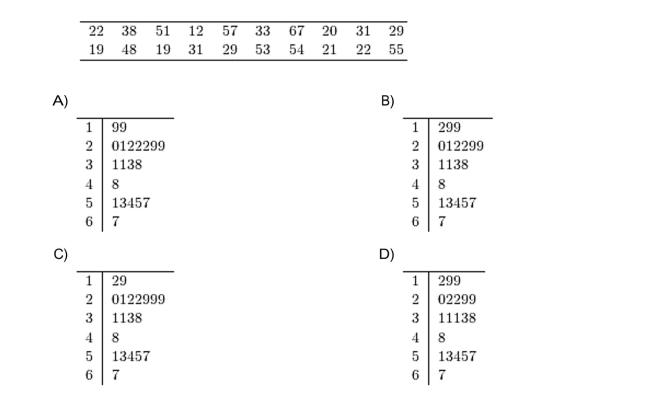
Question
Thirty households were surveyed for the number of televisions in each home. ) 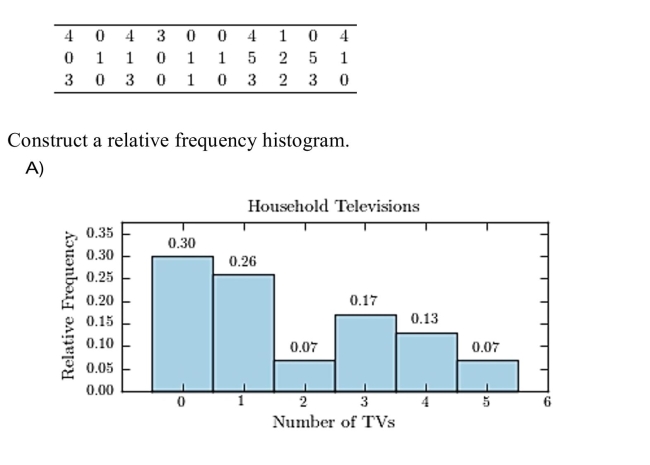
Question
A sample of 200 high school students were asked how many hours per week they spend watching 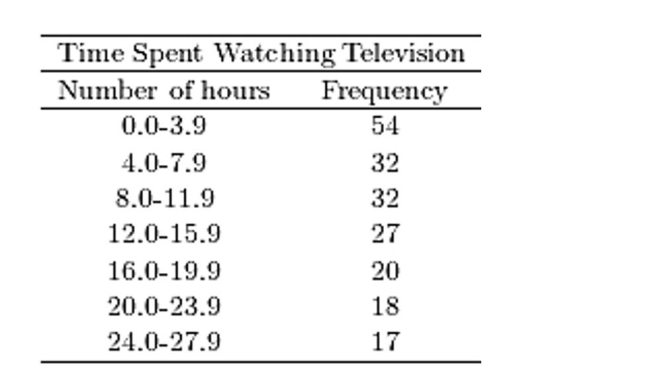 Construct a frequency polygon for the frequency distribution.
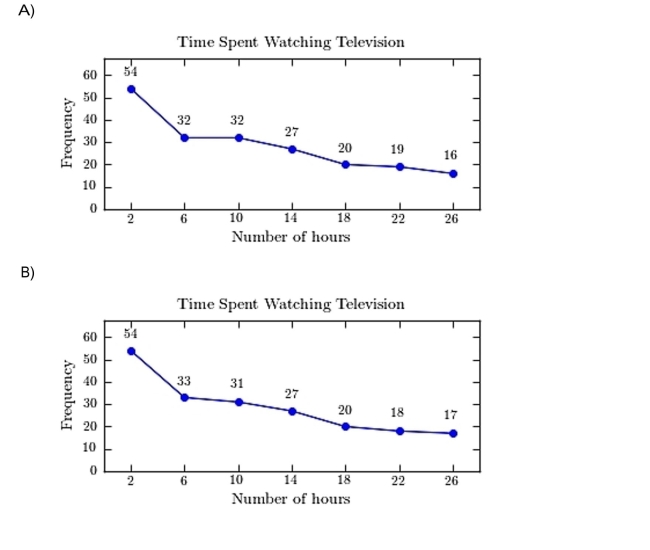
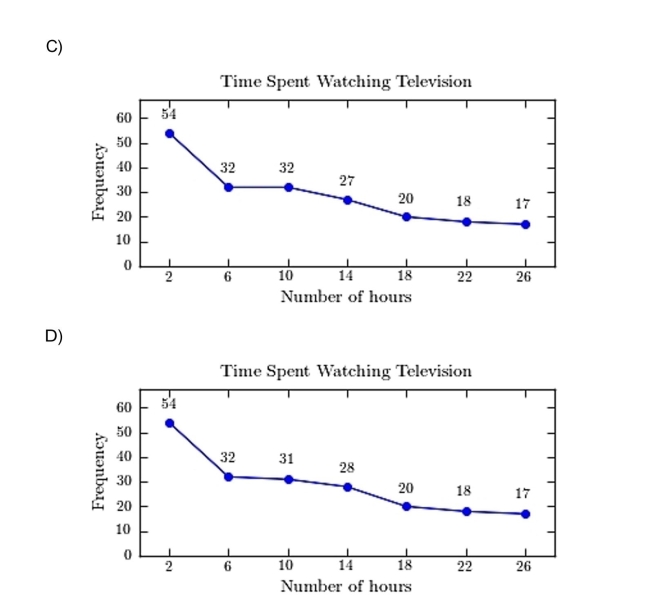
Construct a frequency polygon for the frequency distribution. Question
Construct a stem-and-leaf plot for the following data,) 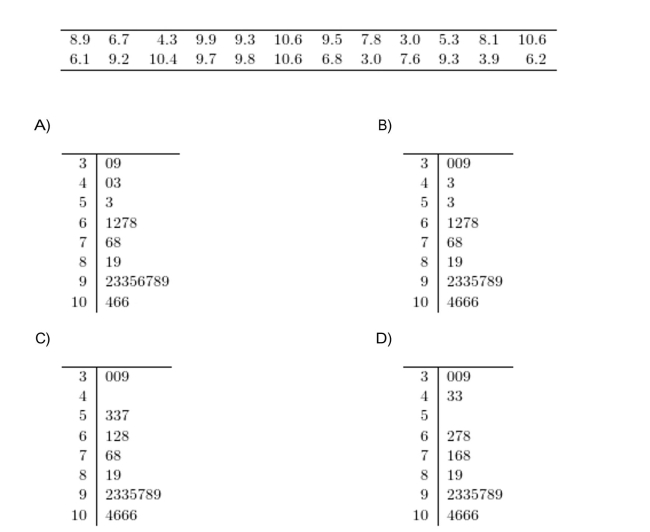
Question
A sample of 200 high school students were asked how many hours per week they spend watching 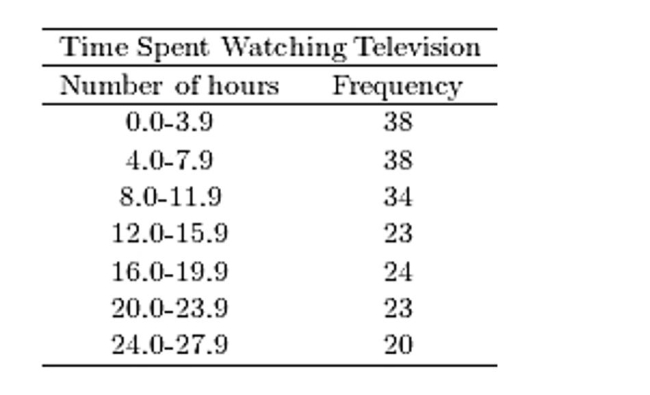 Construct a frequency ogive for the frequency distribution.
 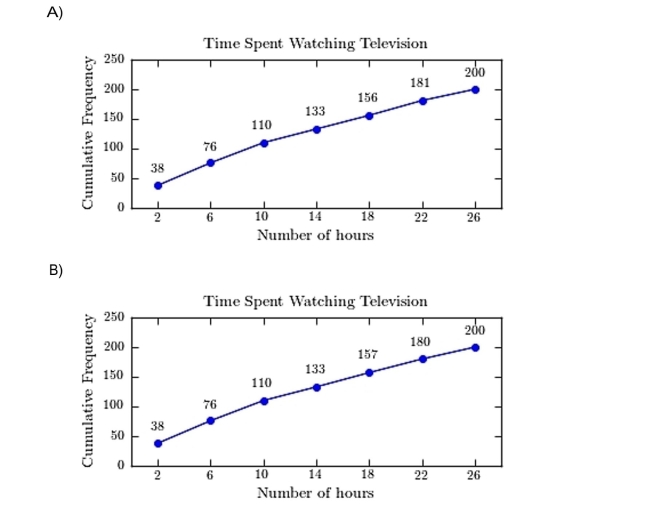 27
27 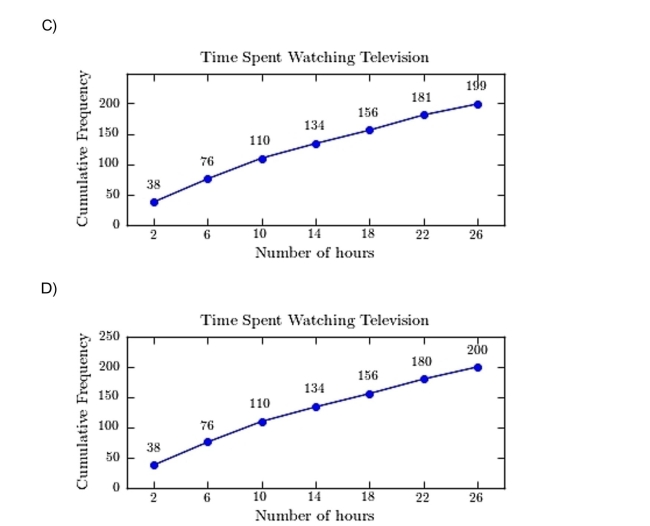
Construct a frequency ogive for the frequency distribution. 27 Question
Which of the following presents the most honest graphical representation of the ratio"3 to 2"? 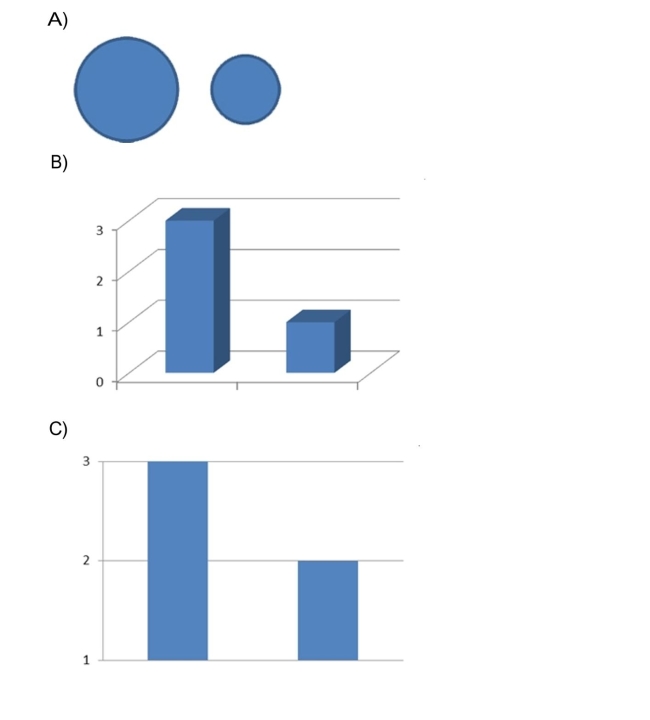 37
37 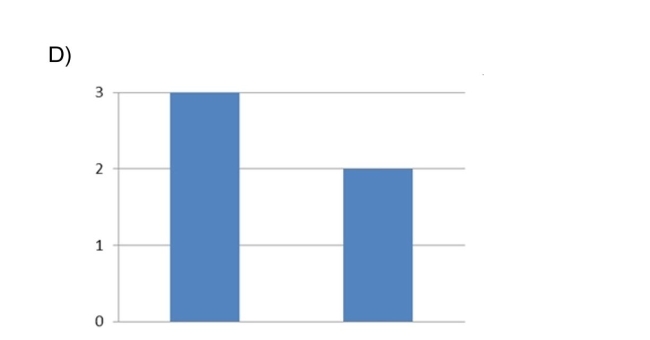
37 Question
A sample of 200 high school students were asked how many hours per week they spend watching 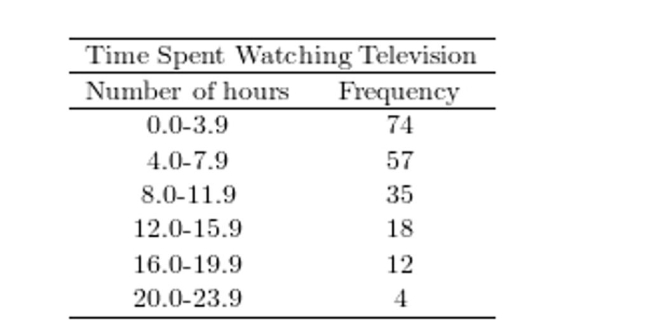 Construct a relative frequency polygon for the frequency distribution.
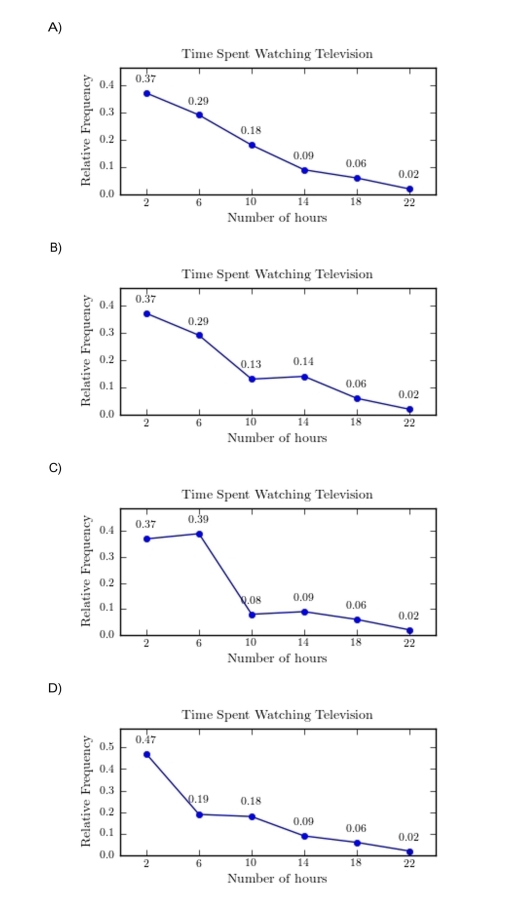
Construct a relative frequency polygon for the frequency distribution. 
Unlock Deck
Sign up to unlock the cards in this deck!
Unlock Deck
Unlock Deck
1/34
Play
Full screen (f)
Deck 2: Graphical Summaries of Data
1
The following frequency distribution presents the weights in pounds (lb)of a sample of visitors to Construct a frequency histogram. 12
Construct a frequency histogram. 12 A
2
The following pie chart presents the percentages of fish caught in each of four ratings categories. 3
3 B
3
Following is a pie chart that presents the percentages spent by a certain household on its five
A)47%
B)52.5%
C)65.4%
D)60.4%
A)47%
B)52.5%
C)65.4%
D)60.4%
C
4
The following pie chart presents the percentages of fish caught in each of four ratings categories.
Unlock Deck
Unlock for access to all 34 flashcards in this deck.
Unlock Deck
k this deck
5
Classify the histogram as skewed to the left,)
A)approximately symmetric
B)skewed to the left
C)skewed to the right
A)approximately symmetric
B)skewed to the left
C)skewed to the right
Unlock Deck
Unlock for access to all 34 flashcards in this deck.
Unlock Deck
k this deck
6
The following table presents the purchase totals (in dollars)of a random sample of gasolinepurchases at a convenience store.Construct a relative frequency histogram using a class width of 10, and using 0 as the lower classlimit for the first class.
Unlock Deck
Unlock for access to all 34 flashcards in this deck.
Unlock Deck
k this deck
7
Classify the histogram as unimodal or bimodal. )
A)bimodal
B)unimodal
A)bimodal
B)unimodal
Unlock Deck
Unlock for access to all 34 flashcards in this deck.
Unlock Deck
k this deck
8
The following frequency distribution presents the frequency of passenger vehicles that pass What is the relative frequency of the SUV category?
A)78%
B)0.987
C)0.373
D)78
What is the relative frequency of the SUV category?A)78%
B)0.987
C)0.373
D)78
Unlock Deck
Unlock for access to all 34 flashcards in this deck.
Unlock Deck
k this deck
9
The following table presents the purchase totals (in dollars)of a random sample of gasoline
Unlock Deck
Unlock for access to all 34 flashcards in this deck.
Unlock Deck
k this deck
10
The following frequency distribution presents the frequency of passenger vehicles that pass Construct a frequency bar graph for the data. 5
Construct a frequency bar graph for the data. 5 Unlock Deck
Unlock for access to all 34 flashcards in this deck.
Unlock Deck
k this deck
11
The following frequency distribution presents the frequency of passenger vehicles that pass Construct a pie chart for the data.
Construct a pie chart for the data. Unlock Deck
Unlock for access to all 34 flashcards in this deck.
Unlock Deck
k this deck
12
The following bar graph presents the average amount a certain family spent, in dollars, on various
A)Cereals and baked goods
B)Dairy products
C)Fruits and vegetables
D)Meat poultry, fish, eggs
A)Cereals and baked goods
B)Dairy products
C)Fruits and vegetables
D)Meat poultry, fish, eggs
Unlock Deck
Unlock for access to all 34 flashcards in this deck.
Unlock Deck
k this deck
13
The following frequency distribution presents the frequency of passenger vehicles that pass Construct a relative frequency bar graph for the data. 7
Construct a relative frequency bar graph for the data. 7 Unlock Deck
Unlock for access to all 34 flashcards in this deck.
Unlock Deck
k this deck
14
One hundred students are shown an eight-digit number on a piece of cardboard for three seconds How many students memorized the number in three trials or less?
A)16
B)86
C)14
D)5
How many students memorized the number in three trials or less?A)16
B)86
C)14
D)5
Unlock Deck
Unlock for access to all 34 flashcards in this deck.
Unlock Deck
k this deck
15
The following frequency distribution presents the frequency of passenger vehicles that pass Construct a relative frequency distribution for the data.
Construct a relative frequency distribution for the data. Unlock Deck
Unlock for access to all 34 flashcards in this deck.
Unlock Deck
k this deck
16
The following frequency distribution presents the frequency of passenger vehicles that passthrough a certain intersection from 8:00 AM to 9:00 AM on a particular day. 8
Unlock Deck
Unlock for access to all 34 flashcards in this deck.
Unlock Deck
k this deck
17
The following table presents the purchase totals (in dollars)of a random sample of gasoline
Unlock Deck
Unlock for access to all 34 flashcards in this deck.
Unlock Deck
k this deck
18
The following table presents the purchase totals (in dollars)of a random sample of gasoline 16 17
16 17 Unlock Deck
Unlock for access to all 34 flashcards in this deck.
Unlock Deck
k this deck
19
The following frequency distribution presents the weights in pounds (lb)of a sample of visitors to Construct a relative frequency histogram.
Construct a relative frequency histogram. Unlock Deck
Unlock for access to all 34 flashcards in this deck.
Unlock Deck
k this deck
20
The following frequency distribution presents the weights in pounds (lb)of a sample of visitors to What is the class width?
A)7
B)8
C)64
D)9
What is the class width?A)7
B)8
C)64
D)9
Unlock Deck
Unlock for access to all 34 flashcards in this deck.
Unlock Deck
k this deck
21
Which of the following presents the most honest graphical representation of the ratio"3 to 4"?
Unlock Deck
Unlock for access to all 34 flashcards in this deck.
Unlock Deck
k this deck
22
Which of the following presents the most honest graphical representation of the ratio"5 to 2"? 38
38 Unlock Deck
Unlock for access to all 34 flashcards in this deck.
Unlock Deck
k this deck
23
Construct a dotplot for the following data. )
Unlock Deck
Unlock for access to all 34 flashcards in this deck.
Unlock Deck
k this deck
24
Thirty households were surveyed for the number of televisions in each home. )
Unlock Deck
Unlock for access to all 34 flashcards in this deck.
Unlock Deck
k this deck
25
Construct a dotplot for the following data. ) 31
31 Unlock Deck
Unlock for access to all 34 flashcards in this deck.
Unlock Deck
k this deck
26
Following are the numbers of Dean's List students in a random sample of 20 universitycourses. ) 33
33 Unlock Deck
Unlock for access to all 34 flashcards in this deck.
Unlock Deck
k this deck
27
A sample of 200 high school students were asked how many hours per week they spend watching Construct a relative frequency ogive for the frequency distribution. 28
Construct a relative frequency ogive for the frequency distribution. 28 Unlock Deck
Unlock for access to all 34 flashcards in this deck.
Unlock Deck
k this deck
28
Construct a stem-and-leaf plot for the following data. )
Unlock Deck
Unlock for access to all 34 flashcards in this deck.
Unlock Deck
k this deck
29
Thirty households were surveyed for the number of televisions in each home. )
Unlock Deck
Unlock for access to all 34 flashcards in this deck.
Unlock Deck
k this deck
30
A sample of 200 high school students were asked how many hours per week they spend watching Construct a frequency polygon for the frequency distribution.
Construct a frequency polygon for the frequency distribution. Unlock Deck
Unlock for access to all 34 flashcards in this deck.
Unlock Deck
k this deck
31
Construct a stem-and-leaf plot for the following data,)
Unlock Deck
Unlock for access to all 34 flashcards in this deck.
Unlock Deck
k this deck
32
A sample of 200 high school students were asked how many hours per week they spend watching Construct a frequency ogive for the frequency distribution. 27
Construct a frequency ogive for the frequency distribution. 27 Unlock Deck
Unlock for access to all 34 flashcards in this deck.
Unlock Deck
k this deck
33
Which of the following presents the most honest graphical representation of the ratio"3 to 2"? 37
37 Unlock Deck
Unlock for access to all 34 flashcards in this deck.
Unlock Deck
k this deck
34
A sample of 200 high school students were asked how many hours per week they spend watching Construct a relative frequency polygon for the frequency distribution.
Construct a relative frequency polygon for the frequency distribution. Unlock Deck
Unlock for access to all 34 flashcards in this deck.
Unlock Deck
k this deck
Unlock Deck
Unlock for access to all 34 flashcards in this deck.


