Deck 12: Statistical Analysis Questions in ANOVA and Rank-Sum Test
Full screen (f)
Question
Find the critical value at the  level for the following sample, for testing
  m= 41 versus

A) 4
B) 1
C) 3
D) 2
level for the following sample, for testing m= 41 versus A) 4
B) 1
C) 3
D) 2
Question
A wild life biologist believes that the median length of the fish in a lake is 35 cm. ) 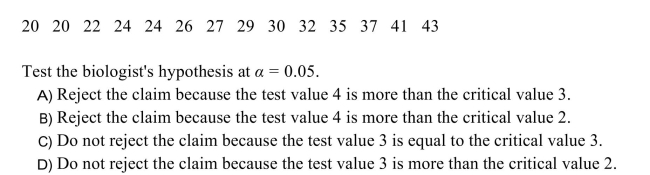
Question
Monthly rents were recorded for a sample of 36 apartments in a certain city. ) 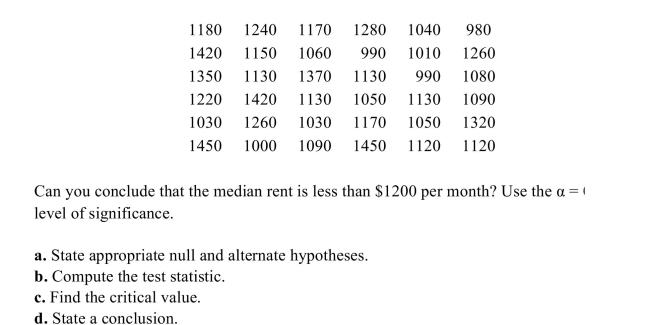 were as follows.
were as follows. Question
Question
Question
Question
Given 
find the P -value.
A) 0.0571
B) 0.0286
C) 0.1142
D) 0.9429
find the P -value.
A) 0.0571
B) 0.0286
C) 0.1142
D) 0.9429
Question
The sign test is performed to test 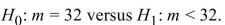
There are 17 positive signs and 21 negative signs in a test involving 38 samples. What is the value of the test statistic?
A) -0.65
B) 0.65
C) -0.49
D) 0.81
There are 17 positive signs and 21 negative signs in a test involving 38 samples. What is the value of the test statistic?
A) -0.65
B) 0.65
C) -0.49
D) 0.81
Question
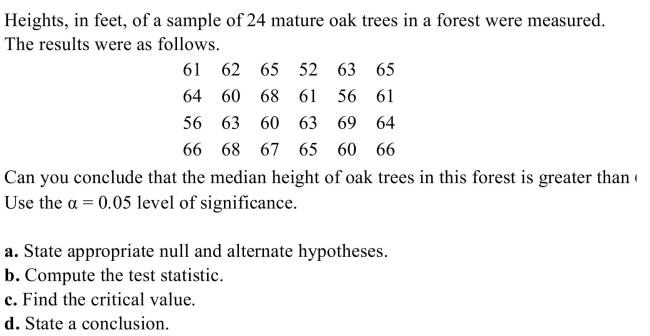 feet
feet Question
The following data was collected as part of a study examining whether there is a 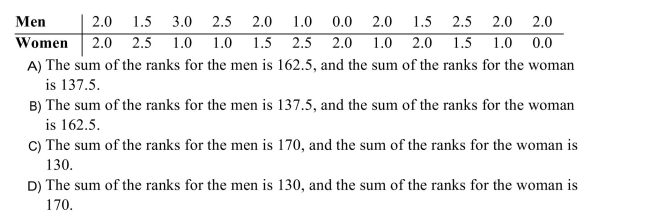
Question
Given 
find the P -value.
A) 0.9599
B) 0.0802
C) 0.0201
D) 0.0401
find the P -value.
A) 0.9599
B) 0.0802
C) 0.0201
D) 0.0401
Question
The sign test is performed to test 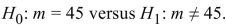
There are 15 positive signs and 7 negative signs. What is the value of the test statistic?
A) 15
B) -8
C) 7
D) 8
There are 15 positive signs and 7 negative signs. What is the value of the test statistic?
A) 15
B) -8
C) 7
D) 8
Question
Find the critical value at the  level for the following sample, for testing
  m= 48 versus

A) 2
B) 4
C) 3
D) 1
level for the following sample, for testing m= 48 versus A) 2
B) 4
C) 3
D) 1
Question
Given  compute
A) -0.61
B) 277.5
C) 37
D) 31.16
compute A) -0.61
B) 277.5
C) 37
D) 31.16
Question
The following data was collected as part of a study examining whether there is a difference 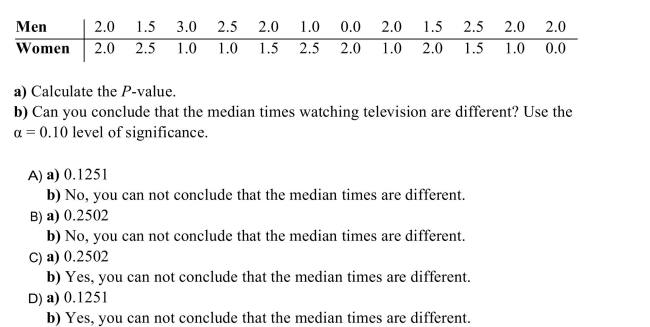
Question
Given  compute z .
A) 0.74
B) 1.28
C) 17.95
D) 2.22
compute z .A) 0.74
B) 1.28
C) 17.95
D) 2.22
Question
The length of time that customers spent eating dinner was compared with and without music 
Question
Six second-graders tried tossing a ball into a basket ten times each. ) 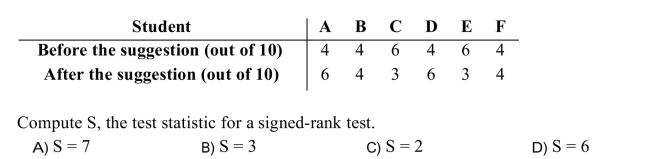
Question
Fill in the blank with the appropriate word or phrase.
When performing the Rank-sum test we reject the null hypothesis when ?
A)
B)
C)
D)
When performing the Rank-sum test we reject the null hypothesis when ?
A)
B)
C)
D)
Question
Given  compute
A) 338
B) 0.36
C) 307.5
D) 35.79
compute A) 338
B) 0.36
C) 307.5
D) 35.79
Question
Question
Question
Samples were drawn from three populations. The sample sizes were 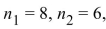 and
and
 The sample means were
  The sample standard deviations were
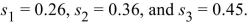
The grand mean is
Compute the mean squares MSTr.
A) 0.5932
B) 4.7259
C) 2.1337
D) 1.1863
and The sample means were The sample standard deviations were The grand mean is
Compute the mean squares MSTr.
A) 0.5932
B) 4.7259
C) 2.1337
D) 1.1863
Question
Question
Samples were drawn from three populations. The sample sizes were 
 The sample means were
 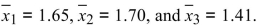 the sample standard deviations were
 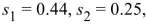 and
and  The grand mean is
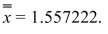
Compute the sum of squares SSTr.
A) 1.4976
B) 0.3184
C) 1.5944
D) 0.1592
The sample means were the sample standard deviations were and The grand mean is Compute the sum of squares SSTr.
A) 1.4976
B) 0.3184
C) 1.5944
D) 0.1592
Question
Ten subjects were weighed before and after a new diet. ) 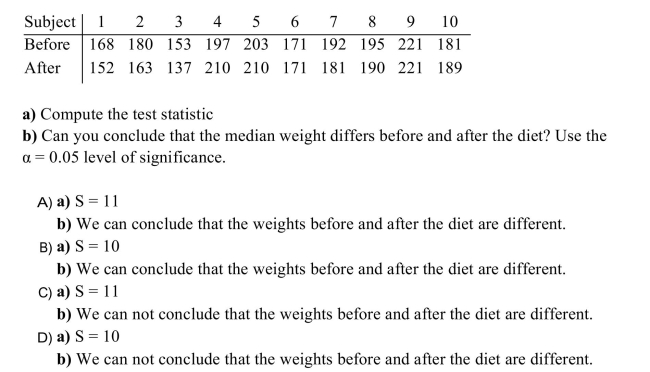
Question
Samples were drawn from three populations. The sample sizes were 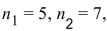
and The sample means were
 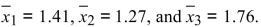 The sample standard deviations were
 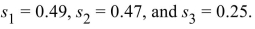 The grand mean is
Compute the sum of squares SSE.
A) 0.9516
B) 2.9701
C) 2.7233
D) 0.4758
and
The sample means were The sample standard deviations were The grand mean is Compute the sum of squares SSE.
A) 0.9516
B) 2.9701
C) 2.7233
D) 0.4758
Question
A sample of eight people attended a two day course that prepares students for college admission 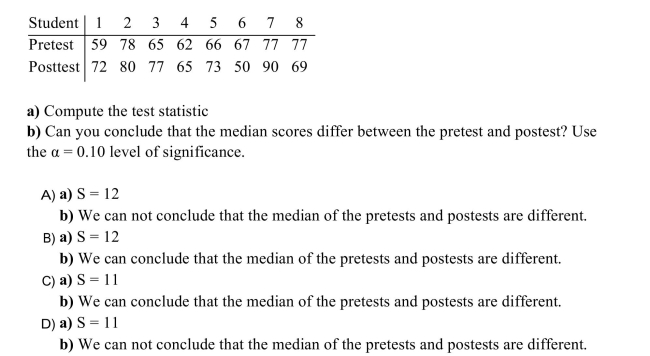
Question
Samples were drawn from three populations. The sample sizes were 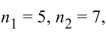 and
and  The sample means were
 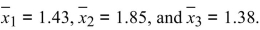 The sample standard deviations were
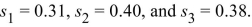
The grand mean is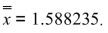
Compute the mean squares MSE.
A) 0.8216
B) 0.4108
C) 0.1373
D) 1.9220
and The sample means were The sample standard deviations were The grand mean is
Compute the mean squares MSE.
A) 0.8216
B) 0.4108
C) 0.1373
D) 1.9220
Question
Question
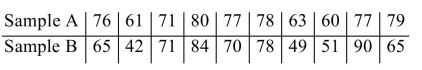
For the following data, compute the test statistic and the critical value, and determine whether to reject  at the
  level.
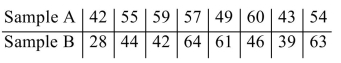
A) S=10 , Critical value is 6, Do not reject
B) S=10 , Critical value is 6, Reject
C) S=11 , Critical value is 4 , Do not reject
D) S=11 , Critical value is 4 , Reject
at the level.A) S=10 , Critical value is 6, Do not reject
B) S=10 , Critical value is 6, Reject
C) S=11 , Critical value is 4 , Do not reject
D) S=11 , Critical value is 4 , Reject
Question
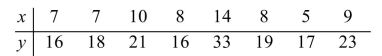
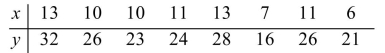
For the following data, compute the test statistic and the critical value, and determine whether to reject  at the
  level.
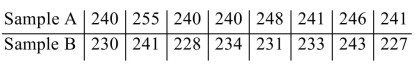
A) S=36 , Critical value is 6, Do not reject
B) S=0 , Critical value is 4, Reject
C) S=0 , Critical value is 6, Do not reject
D) S=36 , Critical value is 4, Reject
at the level.A) S=36 , Critical value is 6, Do not reject
B) S=0 , Critical value is 4, Reject
C) S=0 , Critical value is 6, Do not reject
D) S=36 , Critical value is 4, Reject
Question
Samples were drawn from three populations. The sample sizes were 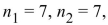
and The sample means were
 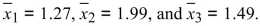 The sample standard deviations were
  The grand mean is
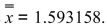
How many degrees of freedom are there for SSTr.
A) 2
B) 3
C) 16
D) 15
and
The sample means were The sample standard deviations were The grand mean is How many degrees of freedom are there for SSTr.
A) 2
B) 3
C) 16
D) 15
Question
For the following data, compute the test statistic and the critical value, and determine whether to reject  at the
  level.
A) S=7 , Critical value is 4, Do not reject
B) S=6 , Critical value is 8, Reject
C) S=7 , Critical value is 4, Reject
D) S=6 , Critical value is 8, Do not reject
at the level.A) S=7 , Critical value is 4, Do not reject
B) S=6 , Critical value is 8, Reject
C) S=7 , Critical value is 4, Reject
D) S=6 , Critical value is 8, Do not reject
Question
Samples were drawn from three populations. The sample sizes were 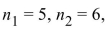
and The sample means were
 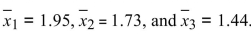 The sample standard deviations were
 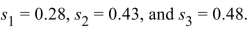 The grand mean is
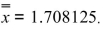
How many degrees of freedom are there for SSE.
A) 13
B) 12
C) 3
D) 2
and
The sample means were The sample standard deviations were The grand mean is How many degrees of freedom are there for SSE.
A) 13
B) 12
C) 3
D) 2
Question
Question
If the test value for a signed-rank test is 7 , the sample size is 9 , and the test is to be carried out at the  level of significance, should the null hypothesis be rejected? Use the table of critical values for the signed-rank test below.
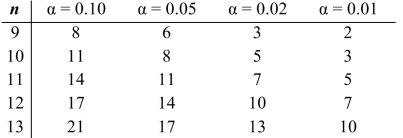
A) Do not reject because the test value 7 is greater than the critical value 6 .
B) Do not reject because the test value 7 is less than the critical value 8 .
C) Reject because the test value 7 is greater than the critical value 6 .
D) Reject because the test value 7 is less than the critical value 8 .
level of significance, should the null hypothesis be rejected? Use the table of critical values for the signed-rank test below.A) Do not reject
because the test value 7 is greater than the critical value 6 .B) Do not reject
because the test value 7 is less than the critical value 8 . C) Reject
because the test value 7 is greater than the critical value 6 .D) Reject
because the test value 7 is less than the critical value 8 . Question
Samples were drawn from three populations. The sample sizes were 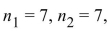 and
and  The sample means were
 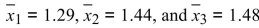 The sample standard deviations were
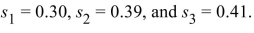
The grand mean is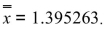
Compute the value of the test statistic F .
A) 2.125
B) 0.480
C) 0.064
D) 0.127
and The sample means were The sample standard deviations were The grand mean is
Compute the value of the test statistic F .
A) 2.125
B) 0.480
C) 0.064
D) 0.127
Question
A consumer advice web site tested a fuel additive. ) 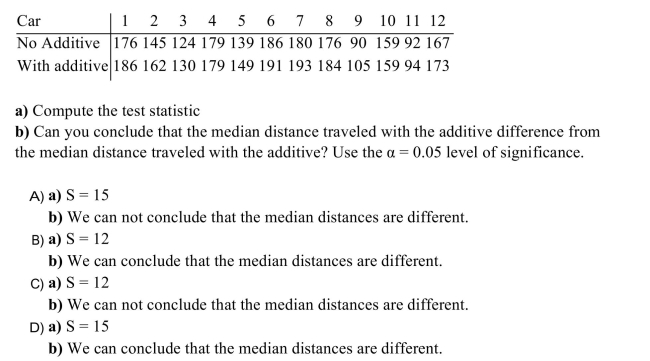
Question
Question
Question
In a water-bottling facility,) 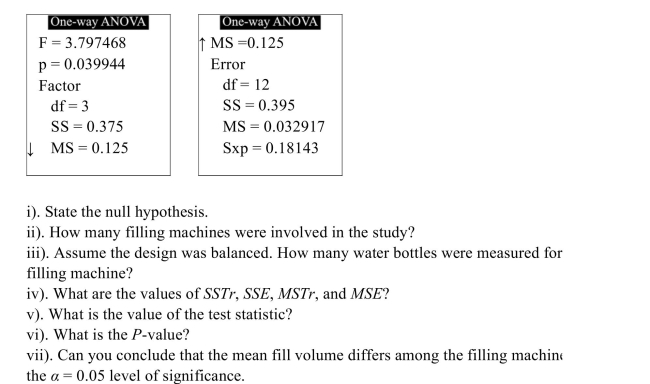 drinking water. The following TI-84 Plus display presents the results of a one-way
drinking water. The following TI-84 Plus display presents the results of a one-way Question
In a water-bottling facility,) 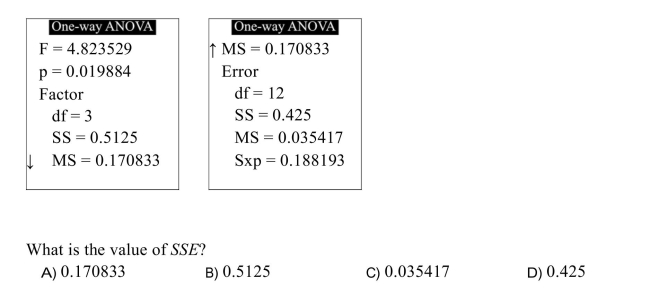
Question
An experiment is conducted to study the effects of curing times and curing temperatures 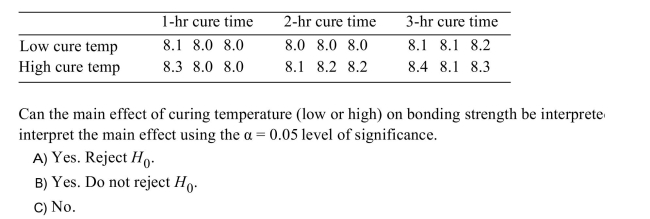
Question
In a water-bottling facility,) 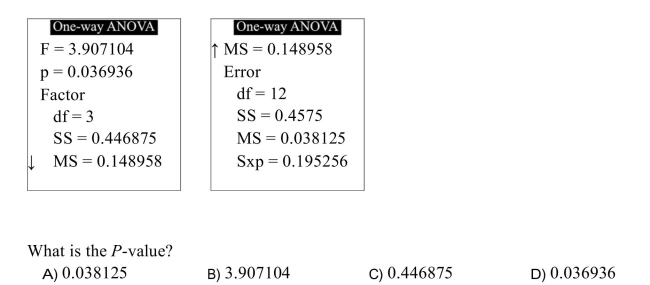
Question
Artificial hip joints consist of a ball and socket. ) 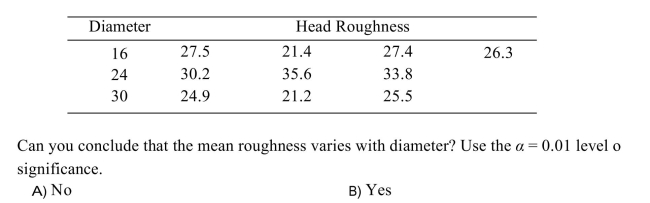
Question
In a water-bottling facility,) 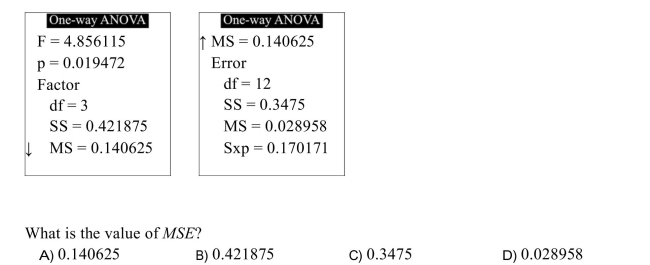
Question
In a water-bottling facility,) 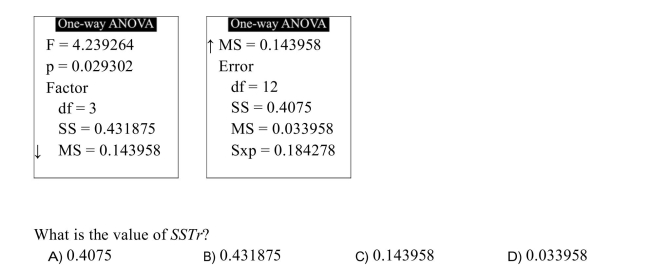
Question
The following table shows the weekly total sales (in dollars)at a small roadside vegetable stand 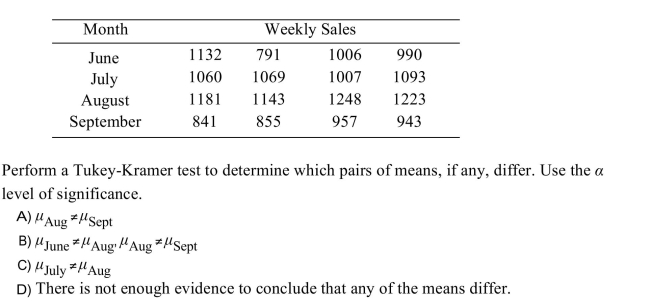
Question
An experiment is conducted to study the effects of curing times and curing temperatures 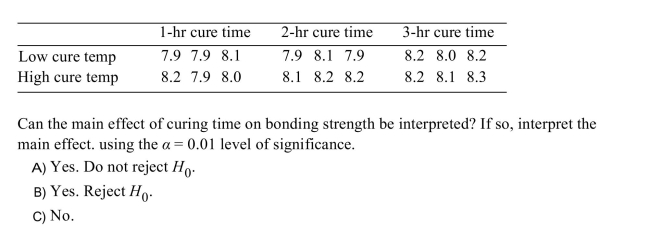
Question
In a water-bottling facility,) 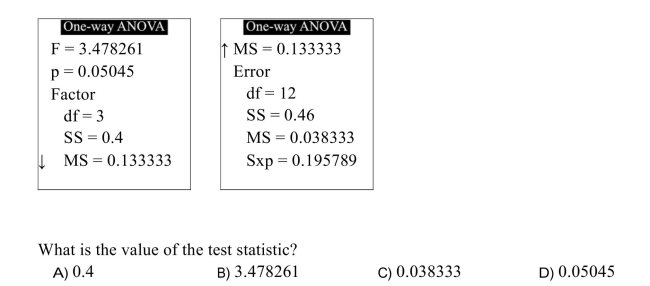
Question
level 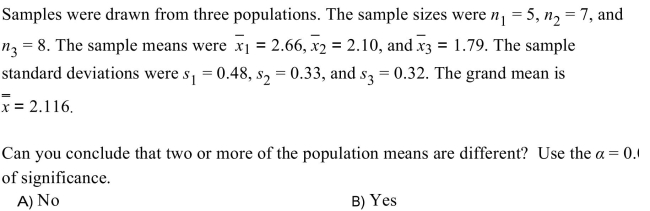
Question
In a water-bottling facility,) 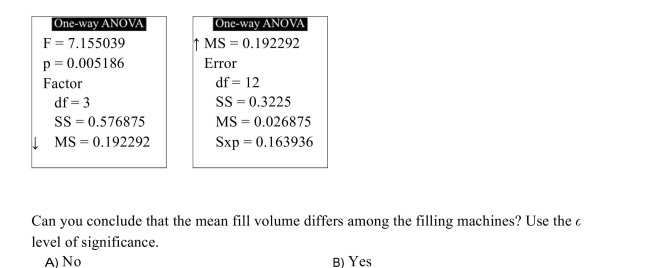
Question
An experiment is conducted to study the effects of curing times and curing temperatures 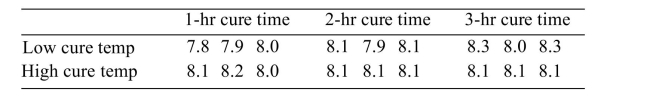 Can you reject the hypothesis of no interactions?
A)Yes
B)No
Can you reject the hypothesis of no interactions?A)Yes
B)No
Question
The following table shows the weekly total sales (in dollars)at a small roadside 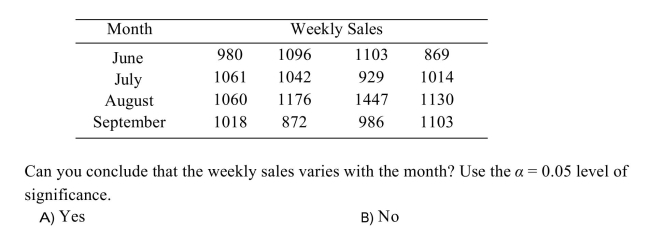
Question
Question
Question
Interpret the interaction plot by explaining whether there appear to be large interactions 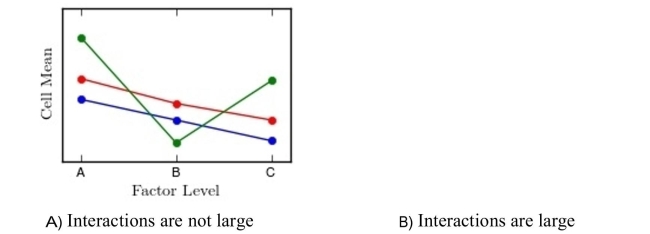
Question
In a water-bottling facility,) 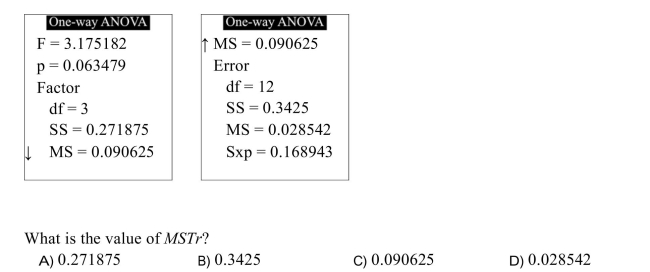
Question
Artificial hip joints consist of a ball and socket. ) 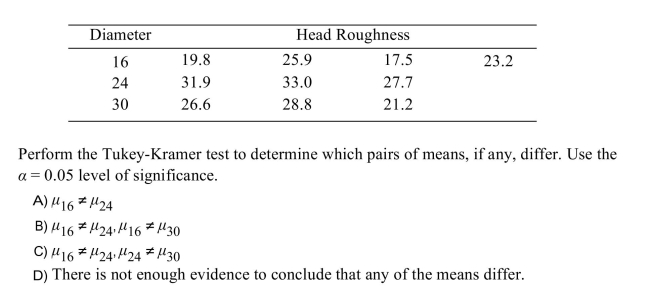
Question
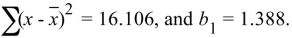
The summary statistics for a certain set of points are: 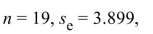
Assume the conditions of the linear model hold A 99% confidence interval for will be constructed.
Construct the 99% confidence interval.
A)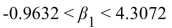
B)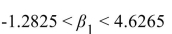
C)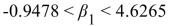
D)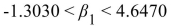
Assume the conditions of the linear model hold A 99% confidence interval for
will be constructed.Construct the 99% confidence interval.
A)
B)
C)
D)
Question
What is the critical value? 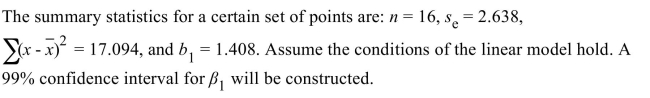
A)2.947
B)2.624
C)2.602
D)2.977
A)2.947
B)2.624
C)2.602
D)2.977
Question
What is the margin of error? 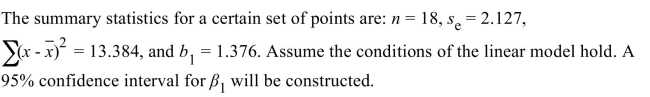
A)28.374080
B)1.011635
C)1.226753
D)1.232567
A)28.374080
B)1.011635
C)1.226753
D)1.232567
Question
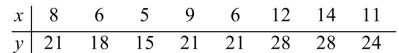
Use the given set of points to construct a 95% confidence interval for 
A)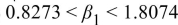
B)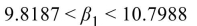
C)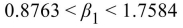
D)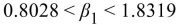
A)
B)
C)
D)
Question
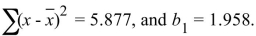
Use the given set of points to compute the sum of squares for x , 
A) 10.1596
B) 23.5000
C) 1.4149
D) 1.7238
A) 10.1596
B) 23.5000
C) 1.4149
D) 1.7238
Question
Use the given set of points to compute 
A) 1.8401
B) 2.7257
C) 89.8750
D) 6.4145
A) 1.8401
B) 2.7257
C) 89.8750
D) 6.4145
Question
How many degrees of freedom are there for the critical value? 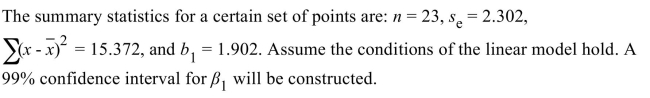
A)24
B)23
C)22
D)21
A)24
B)23
C)22
D)21
Question
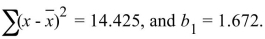
The summary statistics for a certain set of points are: n=13 , 
 Assume the conditions of the linear model hold A
99% confidence interval for will be constructed.
Test the null hypothesis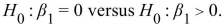
Use the level of significance.
A) Do not reject
B) Reject
Assume the conditions of the linear model hold A99% confidence interval for
will be constructed.Test the null hypothesis
Use the
level of significance.A) Do not reject
B) Reject
Question
An agricultural scientist performs a 2-way ANOVA to determine the effects of three 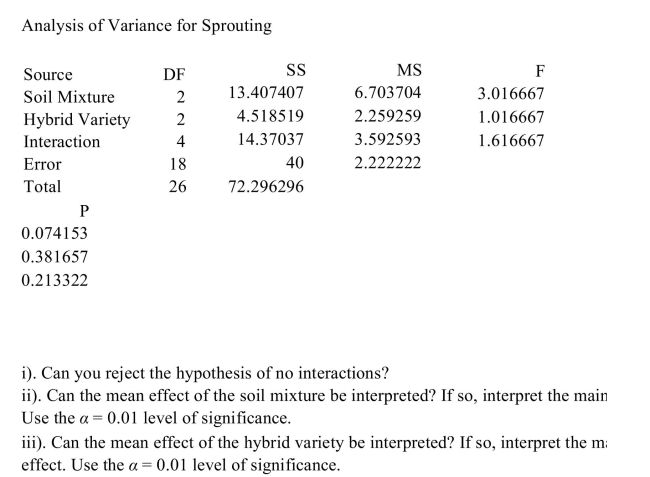 different soil mixtures on the sprouting time (in days)of three varieties of hybrid
different soil mixtures on the sprouting time (in days)of three varieties of hybrid Question
The following table presents measurements of the tensile strength (in kilopascals)of 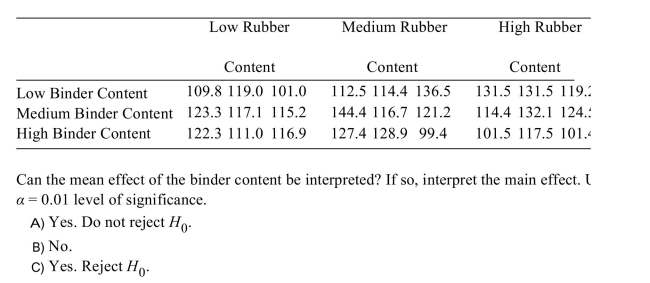
Question
An agricultural scientist performs a 2-way ANOVA to determine the effects of three different 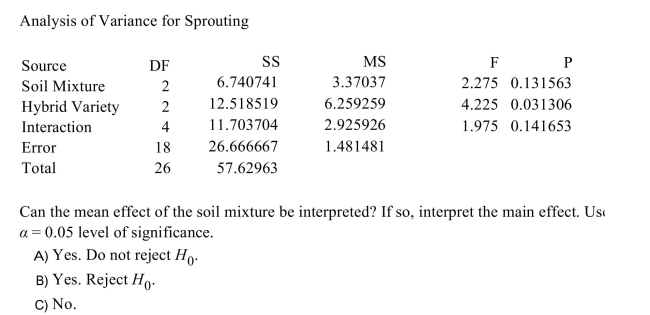
Question
The following table presents measurements of the tensile strength (in kilopascals)of 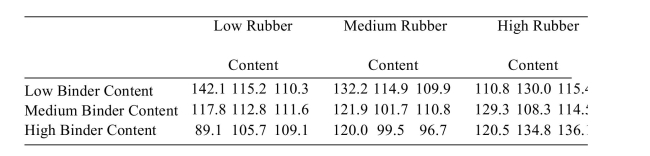 Can you reject the hypothesis of no interactions?
A)Yes
B)No
Can you reject the hypothesis of no interactions?A)Yes
B)No
Question
An agricultural scientist performs a 2-way ANOVA to determine the effects of three different 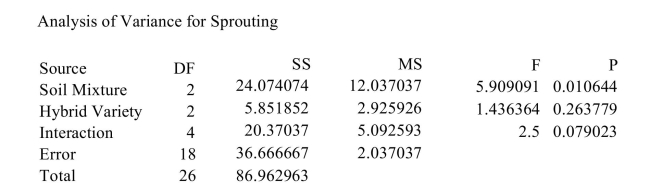 Can you reject the hypothesis of no interactions?
A)Yes
B)No
Can you reject the hypothesis of no interactions?A)Yes
B)No
Question
The summary statistics for a certain set of points are: n=17 , 
 Assume the conditions of the linear model
hold A 95% confidence interval for will be constructed.
i). How many degrees of freedom are there for the critical value?
ii). What is the critical value?
iii). What is the margin of error?
iv). Construct the 95 % confidence interval.
Assume the conditions of the linear modelhold A 95% confidence interval for
will be constructed.i). How many degrees of freedom are there for the critical value?
ii). What is the critical value?
iii). What is the margin of error?
iv). Construct the 95 % confidence interval.
Question
The following table presents measurements of the tensile strength (in kilopascals)of 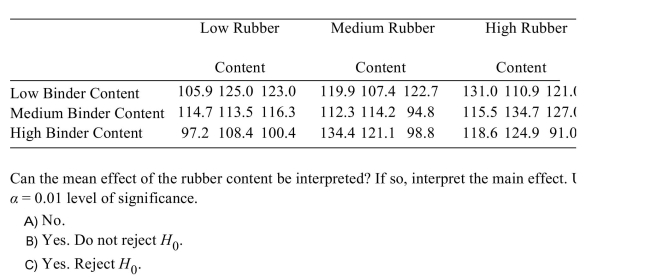
Question
Question
Use the given set of points to compute the margin of error for a 95% confidence interval for 
A) 2.2860
B) 0.5409
C) 1.3236
D) 4.4235
A) 2.2860
B) 0.5409
C) 1.3236
D) 4.4235
Question
An agricultural scientist performs a 2-way ANOVA to determine the effects of three different 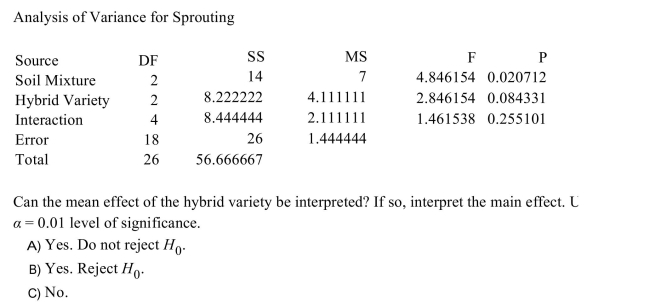
Question
Use the given set of points to compute the standard error of 
A) 2.5043
B) 50.0000
C) 0.3542
D) 1.9300
A) 2.5043
B) 50.0000
C) 0.3542
D) 1.9300
Question
Use the given set of points to compute the residual standard deviation 
A) 44.8750
B) 2.5696
C) 7.9164
D) 1.6379
A) 44.8750
B) 2.5696
C) 7.9164
D) 1.6379

Unlock Deck
Sign up to unlock the cards in this deck!
Unlock Deck
Unlock Deck
1/140
Play
Full screen (f)
Deck 12: Statistical Analysis Questions in ANOVA and Rank-Sum Test
1
Find the critical value at the level for the following sample, for testing m= 41 versus
A) 4
B) 1
C) 3
D) 2
level for the following sample, for testing m= 41 versus A) 4
B) 1
C) 3
D) 2
1
2
A wild life biologist believes that the median length of the fish in a lake is 35 cm. )
D
3
Monthly rents were recorded for a sample of 36 apartments in a certain city. ) were as follows.
were as follows.
4
The owners of a coffee stand hypothesize that the median number of sales during
Unlock Deck
Unlock for access to all 140 flashcards in this deck.
Unlock Deck
k this deck
5
A sample of 10 students took a class online and 12 students took an equivalent class in a
Unlock Deck
Unlock for access to all 140 flashcards in this deck.
Unlock Deck
k this deck
6
Fill in the blank with the appropriate word or phrase.The null hypothesis for the rank-sum test is that the two population ?
A)rank-sums
B)modes
C)means
D)medians
A)rank-sums
B)modes
C)means
D)medians
Unlock Deck
Unlock for access to all 140 flashcards in this deck.
Unlock Deck
k this deck
7
Given
find the P -value.
A) 0.0571
B) 0.0286
C) 0.1142
D) 0.9429
find the P -value.
A) 0.0571
B) 0.0286
C) 0.1142
D) 0.9429
Unlock Deck
Unlock for access to all 140 flashcards in this deck.
Unlock Deck
k this deck
8
The sign test is performed to test
There are 17 positive signs and 21 negative signs in a test involving 38 samples. What is the value of the test statistic?
A) -0.65
B) 0.65
C) -0.49
D) 0.81
There are 17 positive signs and 21 negative signs in a test involving 38 samples. What is the value of the test statistic?
A) -0.65
B) 0.65
C) -0.49
D) 0.81
Unlock Deck
Unlock for access to all 140 flashcards in this deck.
Unlock Deck
k this deck
9
feet Unlock Deck
Unlock for access to all 140 flashcards in this deck.
Unlock Deck
k this deck
10
The following data was collected as part of a study examining whether there is a
Unlock Deck
Unlock for access to all 140 flashcards in this deck.
Unlock Deck
k this deck
11
Given
find the P -value.
A) 0.9599
B) 0.0802
C) 0.0201
D) 0.0401
find the P -value.
A) 0.9599
B) 0.0802
C) 0.0201
D) 0.0401
Unlock Deck
Unlock for access to all 140 flashcards in this deck.
Unlock Deck
k this deck
12
The sign test is performed to test
There are 15 positive signs and 7 negative signs. What is the value of the test statistic?
A) 15
B) -8
C) 7
D) 8
There are 15 positive signs and 7 negative signs. What is the value of the test statistic?
A) 15
B) -8
C) 7
D) 8
Unlock Deck
Unlock for access to all 140 flashcards in this deck.
Unlock Deck
k this deck
13
Find the critical value at the level for the following sample, for testing m= 48 versus
A) 2
B) 4
C) 3
D) 1
level for the following sample, for testing m= 48 versus A) 2
B) 4
C) 3
D) 1
Unlock Deck
Unlock for access to all 140 flashcards in this deck.
Unlock Deck
k this deck
14
Given compute
A) -0.61
B) 277.5
C) 37
D) 31.16
compute A) -0.61
B) 277.5
C) 37
D) 31.16
Unlock Deck
Unlock for access to all 140 flashcards in this deck.
Unlock Deck
k this deck
15
The following data was collected as part of a study examining whether there is a difference
Unlock Deck
Unlock for access to all 140 flashcards in this deck.
Unlock Deck
k this deck
16
Given compute z .
A) 0.74
B) 1.28
C) 17.95
D) 2.22
compute z .A) 0.74
B) 1.28
C) 17.95
D) 2.22
Unlock Deck
Unlock for access to all 140 flashcards in this deck.
Unlock Deck
k this deck
17
The length of time that customers spent eating dinner was compared with and without music
Unlock Deck
Unlock for access to all 140 flashcards in this deck.
Unlock Deck
k this deck
18
Six second-graders tried tossing a ball into a basket ten times each. )
Unlock Deck
Unlock for access to all 140 flashcards in this deck.
Unlock Deck
k this deck
19
Fill in the blank with the appropriate word or phrase.
When performing the Rank-sum test we reject the null hypothesis when ?
A)
B)
C)
D)
When performing the Rank-sum test we reject the null hypothesis when ?
A)
B)
C)
D)
Unlock Deck
Unlock for access to all 140 flashcards in this deck.
Unlock Deck
k this deck
20
Given compute
A) 338
B) 0.36
C) 307.5
D) 35.79
compute A) 338
B) 0.36
C) 307.5
D) 35.79
Unlock Deck
Unlock for access to all 140 flashcards in this deck.
Unlock Deck
k this deck
21
In a one-way ANOVA, the following data were collected: SSTr=0.24, S S E=1.52 , N=21, I=5 .
Compute the mean squares MSTr.
A) 0.0600
B) 0.6316
C) 0.0950
D) 0.0150
Compute the mean squares MSTr.
A) 0.0600
B) 0.6316
C) 0.0950
D) 0.0150
Unlock Deck
Unlock for access to all 140 flashcards in this deck.
Unlock Deck
k this deck
22
In a one-way ANOVA, the following data were collected: SSTr=0.49, S S E=2.38 , N=22, I=5 .
How many samples are there?
A) 17
B) 4
C) 22
D) 5
How many samples are there?
A) 17
B) 4
C) 22
D) 5
Unlock Deck
Unlock for access to all 140 flashcards in this deck.
Unlock Deck
k this deck
23
Samples were drawn from three populations. The sample sizes were and
The sample means were The sample standard deviations were
The grand mean is
Compute the mean squares MSTr.
A) 0.5932
B) 4.7259
C) 2.1337
D) 1.1863
and The sample means were The sample standard deviations were The grand mean is
Compute the mean squares MSTr.
A) 0.5932
B) 4.7259
C) 2.1337
D) 1.1863
Unlock Deck
Unlock for access to all 140 flashcards in this deck.
Unlock Deck
k this deck
24
In a one-way ANOVA, the following data were collected: SSTr=0.41, S S E=2.07 , N=26, I=6 .
How many degrees of freedom are there for SSTr?
A) 5
B) 6
C) 20
D) 26
How many degrees of freedom are there for SSTr?
A) 5
B) 6
C) 20
D) 26
Unlock Deck
Unlock for access to all 140 flashcards in this deck.
Unlock Deck
k this deck
25
Samples were drawn from three populations. The sample sizes were
The sample means were the sample standard deviations were and The grand mean is
Compute the sum of squares SSTr.
A) 1.4976
B) 0.3184
C) 1.5944
D) 0.1592
The sample means were the sample standard deviations were and The grand mean is Compute the sum of squares SSTr.
A) 1.4976
B) 0.3184
C) 1.5944
D) 0.1592
Unlock Deck
Unlock for access to all 140 flashcards in this deck.
Unlock Deck
k this deck
26
Ten subjects were weighed before and after a new diet. )
Unlock Deck
Unlock for access to all 140 flashcards in this deck.
Unlock Deck
k this deck
27
Samples were drawn from three populations. The sample sizes were
and The sample means were The sample standard deviations were The grand mean is
Compute the sum of squares SSE.
A) 0.9516
B) 2.9701
C) 2.7233
D) 0.4758
and
The sample means were The sample standard deviations were The grand mean is Compute the sum of squares SSE.
A) 0.9516
B) 2.9701
C) 2.7233
D) 0.4758
Unlock Deck
Unlock for access to all 140 flashcards in this deck.
Unlock Deck
k this deck
28
A sample of eight people attended a two day course that prepares students for college admission
Unlock Deck
Unlock for access to all 140 flashcards in this deck.
Unlock Deck
k this deck
29
Samples were drawn from three populations. The sample sizes were and The sample means were The sample standard deviations were
The grand mean is
Compute the mean squares MSE.
A) 0.8216
B) 0.4108
C) 0.1373
D) 1.9220
and The sample means were The sample standard deviations were The grand mean is
Compute the mean squares MSE.
A) 0.8216
B) 0.4108
C) 0.1373
D) 1.9220
Unlock Deck
Unlock for access to all 140 flashcards in this deck.
Unlock Deck
k this deck
30
In a one-way ANOVA, the following data were collected: SSTr=0.34, S S E=2.33 , N=35, I=4 .
Compute the mean squares M S E .
A) 0.0752
B) 0.0110
C) 1.5079
D) 0.1133
Compute the mean squares M S E .
A) 0.0752
B) 0.0110
C) 1.5079
D) 0.1133
Unlock Deck
Unlock for access to all 140 flashcards in this deck.
Unlock Deck
k this deck
31
For the following data, compute the test statistic and the critical value, and determine whether to reject at the level.
A) S=10 , Critical value is 6, Do not reject
B) S=10 , Critical value is 6, Reject
C) S=11 , Critical value is 4 , Do not reject
D) S=11 , Critical value is 4 , Reject
at the level.A) S=10 , Critical value is 6, Do not reject
B) S=10 , Critical value is 6, Reject
C) S=11 , Critical value is 4 , Do not reject
D) S=11 , Critical value is 4 , Reject
Unlock Deck
Unlock for access to all 140 flashcards in this deck.
Unlock Deck
k this deck
32
For the following data, compute the test statistic and the critical value, and determine whether to reject at the level.
A) S=36 , Critical value is 6, Do not reject
B) S=0 , Critical value is 4, Reject
C) S=0 , Critical value is 6, Do not reject
D) S=36 , Critical value is 4, Reject
at the level.A) S=36 , Critical value is 6, Do not reject
B) S=0 , Critical value is 4, Reject
C) S=0 , Critical value is 6, Do not reject
D) S=36 , Critical value is 4, Reject
Unlock Deck
Unlock for access to all 140 flashcards in this deck.
Unlock Deck
k this deck
33
Samples were drawn from three populations. The sample sizes were
and The sample means were The sample standard deviations were The grand mean is
How many degrees of freedom are there for SSTr.
A) 2
B) 3
C) 16
D) 15
and
The sample means were The sample standard deviations were The grand mean is How many degrees of freedom are there for SSTr.
A) 2
B) 3
C) 16
D) 15
Unlock Deck
Unlock for access to all 140 flashcards in this deck.
Unlock Deck
k this deck
34
For the following data, compute the test statistic and the critical value, and determine whether to reject at the level.
A) S=7 , Critical value is 4, Do not reject
B) S=6 , Critical value is 8, Reject
C) S=7 , Critical value is 4, Reject
D) S=6 , Critical value is 8, Do not reject
at the level.A) S=7 , Critical value is 4, Do not reject
B) S=6 , Critical value is 8, Reject
C) S=7 , Critical value is 4, Reject
D) S=6 , Critical value is 8, Do not reject
Unlock Deck
Unlock for access to all 140 flashcards in this deck.
Unlock Deck
k this deck
35
Samples were drawn from three populations. The sample sizes were
and The sample means were The sample standard deviations were The grand mean is
How many degrees of freedom are there for SSE.
A) 13
B) 12
C) 3
D) 2
and
The sample means were The sample standard deviations were The grand mean is How many degrees of freedom are there for SSE.
A) 13
B) 12
C) 3
D) 2
Unlock Deck
Unlock for access to all 140 flashcards in this deck.
Unlock Deck
k this deck
36
In a one-way ANOVA, the following data were collected: SSTr=0.21, SSE=2.49 , N=24, I=3.
How many degrees of freedom are there for SSE?
A) 24
B) 3
C) 2
D) 21
How many degrees of freedom are there for SSE?
A) 24
B) 3
C) 2
D) 21
Unlock Deck
Unlock for access to all 140 flashcards in this deck.
Unlock Deck
k this deck
37
If the test value for a signed-rank test is 7 , the sample size is 9 , and the test is to be carried out at the level of significance, should the null hypothesis be rejected? Use the table of critical values for the signed-rank test below.
A) Do not reject because the test value 7 is greater than the critical value 6 .
B) Do not reject because the test value 7 is less than the critical value 8 .
C) Reject because the test value 7 is greater than the critical value 6 .
D) Reject because the test value 7 is less than the critical value 8 .
level of significance, should the null hypothesis be rejected? Use the table of critical values for the signed-rank test below.A) Do not reject
because the test value 7 is greater than the critical value 6 .B) Do not reject
because the test value 7 is less than the critical value 8 . C) Reject
because the test value 7 is greater than the critical value 6 .D) Reject
because the test value 7 is less than the critical value 8 . Unlock Deck
Unlock for access to all 140 flashcards in this deck.
Unlock Deck
k this deck
38
Samples were drawn from three populations. The sample sizes were and The sample means were The sample standard deviations were
The grand mean is
Compute the value of the test statistic F .
A) 2.125
B) 0.480
C) 0.064
D) 0.127
and The sample means were The sample standard deviations were The grand mean is
Compute the value of the test statistic F .
A) 2.125
B) 0.480
C) 0.064
D) 0.127
Unlock Deck
Unlock for access to all 140 flashcards in this deck.
Unlock Deck
k this deck
39
A consumer advice web site tested a fuel additive. )
Unlock Deck
Unlock for access to all 140 flashcards in this deck.
Unlock Deck
k this deck
40
In a one-way ANOVA, the following data were collected: SSTr=0.23, S S E=2.15 , N=33, I=6 .
Compute the value of the test statistic F .
A) 0.0796
B) 0.5777
C) 0.0460
D) 0.0085
Compute the value of the test statistic F .
A) 0.0796
B) 0.5777
C) 0.0460
D) 0.0085
Unlock Deck
Unlock for access to all 140 flashcards in this deck.
Unlock Deck
k this deck
41
Artificial hip joints consist of a ball and socket. As the joint wears, the ball (head)
Unlock Deck
Unlock for access to all 140 flashcards in this deck.
Unlock Deck
k this deck
42
In a water-bottling facility,) drinking water. The following TI-84 Plus display presents the results of a one-way
drinking water. The following TI-84 Plus display presents the results of a one-way Unlock Deck
Unlock for access to all 140 flashcards in this deck.
Unlock Deck
k this deck
43
In a water-bottling facility,)
Unlock Deck
Unlock for access to all 140 flashcards in this deck.
Unlock Deck
k this deck
44
An experiment is conducted to study the effects of curing times and curing temperatures
Unlock Deck
Unlock for access to all 140 flashcards in this deck.
Unlock Deck
k this deck
45
In a water-bottling facility,)
Unlock Deck
Unlock for access to all 140 flashcards in this deck.
Unlock Deck
k this deck
46
Artificial hip joints consist of a ball and socket. )
Unlock Deck
Unlock for access to all 140 flashcards in this deck.
Unlock Deck
k this deck
47
In a water-bottling facility,)
Unlock Deck
Unlock for access to all 140 flashcards in this deck.
Unlock Deck
k this deck
48
In a water-bottling facility,)
Unlock Deck
Unlock for access to all 140 flashcards in this deck.
Unlock Deck
k this deck
49
The following table shows the weekly total sales (in dollars)at a small roadside vegetable stand
Unlock Deck
Unlock for access to all 140 flashcards in this deck.
Unlock Deck
k this deck
50
An experiment is conducted to study the effects of curing times and curing temperatures
Unlock Deck
Unlock for access to all 140 flashcards in this deck.
Unlock Deck
k this deck
51
In a water-bottling facility,)
Unlock Deck
Unlock for access to all 140 flashcards in this deck.
Unlock Deck
k this deck
52
level
Unlock Deck
Unlock for access to all 140 flashcards in this deck.
Unlock Deck
k this deck
53
In a water-bottling facility,)
Unlock Deck
Unlock for access to all 140 flashcards in this deck.
Unlock Deck
k this deck
54
An experiment is conducted to study the effects of curing times and curing temperatures Can you reject the hypothesis of no interactions?
A)Yes
B)No
Can you reject the hypothesis of no interactions?A)Yes
B)No
Unlock Deck
Unlock for access to all 140 flashcards in this deck.
Unlock Deck
k this deck
55
The following table shows the weekly total sales (in dollars)at a small roadside
Unlock Deck
Unlock for access to all 140 flashcards in this deck.
Unlock Deck
k this deck
56
The following table shows the weekly total sales (in dollars)at a small roadside
Unlock Deck
Unlock for access to all 140 flashcards in this deck.
Unlock Deck
k this deck
57
An experiment is conducted to study the effects of curing times and curing
Unlock Deck
Unlock for access to all 140 flashcards in this deck.
Unlock Deck
k this deck
58
Interpret the interaction plot by explaining whether there appear to be large interactions
Unlock Deck
Unlock for access to all 140 flashcards in this deck.
Unlock Deck
k this deck
59
In a water-bottling facility,)
Unlock Deck
Unlock for access to all 140 flashcards in this deck.
Unlock Deck
k this deck
60
Artificial hip joints consist of a ball and socket. )
Unlock Deck
Unlock for access to all 140 flashcards in this deck.
Unlock Deck
k this deck
61
The summary statistics for a certain set of points are:
Assume the conditions of the linear model hold A 99% confidence interval for will be constructed.
Construct the 99% confidence interval.
A)
B)
C)
D)
Assume the conditions of the linear model hold A 99% confidence interval for
will be constructed.Construct the 99% confidence interval.
A)
B)
C)
D)
Unlock Deck
Unlock for access to all 140 flashcards in this deck.
Unlock Deck
k this deck
62
What is the critical value?
A)2.947
B)2.624
C)2.602
D)2.977
A)2.947
B)2.624
C)2.602
D)2.977
Unlock Deck
Unlock for access to all 140 flashcards in this deck.
Unlock Deck
k this deck
63
What is the margin of error?
A)28.374080
B)1.011635
C)1.226753
D)1.232567
A)28.374080
B)1.011635
C)1.226753
D)1.232567
Unlock Deck
Unlock for access to all 140 flashcards in this deck.
Unlock Deck
k this deck
64
Use the given set of points to construct a 95% confidence interval for
A)
B)
C)
D)
A)
B)
C)
D)
Unlock Deck
Unlock for access to all 140 flashcards in this deck.
Unlock Deck
k this deck
65
Use the given set of points to compute the sum of squares for x ,
A) 10.1596
B) 23.5000
C) 1.4149
D) 1.7238
A) 10.1596
B) 23.5000
C) 1.4149
D) 1.7238
Unlock Deck
Unlock for access to all 140 flashcards in this deck.
Unlock Deck
k this deck
66
Use the given set of points to compute
A) 1.8401
B) 2.7257
C) 89.8750
D) 6.4145
A) 1.8401
B) 2.7257
C) 89.8750
D) 6.4145
Unlock Deck
Unlock for access to all 140 flashcards in this deck.
Unlock Deck
k this deck
67
How many degrees of freedom are there for the critical value?
A)24
B)23
C)22
D)21
A)24
B)23
C)22
D)21
Unlock Deck
Unlock for access to all 140 flashcards in this deck.
Unlock Deck
k this deck
68
The summary statistics for a certain set of points are: n=13 ,
Assume the conditions of the linear model hold A
99% confidence interval for will be constructed.
Test the null hypothesis
Use the level of significance.
A) Do not reject
B) Reject
Assume the conditions of the linear model hold A99% confidence interval for
will be constructed.Test the null hypothesis
Use the
level of significance.A) Do not reject
B) Reject
Unlock Deck
Unlock for access to all 140 flashcards in this deck.
Unlock Deck
k this deck
69
An agricultural scientist performs a 2-way ANOVA to determine the effects of three different soil mixtures on the sprouting time (in days)of three varieties of hybrid
different soil mixtures on the sprouting time (in days)of three varieties of hybrid Unlock Deck
Unlock for access to all 140 flashcards in this deck.
Unlock Deck
k this deck
70
The following table presents measurements of the tensile strength (in kilopascals)of
Unlock Deck
Unlock for access to all 140 flashcards in this deck.
Unlock Deck
k this deck
71
An agricultural scientist performs a 2-way ANOVA to determine the effects of three different
Unlock Deck
Unlock for access to all 140 flashcards in this deck.
Unlock Deck
k this deck
72
The following table presents measurements of the tensile strength (in kilopascals)of Can you reject the hypothesis of no interactions?
A)Yes
B)No
Can you reject the hypothesis of no interactions?A)Yes
B)No
Unlock Deck
Unlock for access to all 140 flashcards in this deck.
Unlock Deck
k this deck
73
An agricultural scientist performs a 2-way ANOVA to determine the effects of three different Can you reject the hypothesis of no interactions?
A)Yes
B)No
Can you reject the hypothesis of no interactions?A)Yes
B)No
Unlock Deck
Unlock for access to all 140 flashcards in this deck.
Unlock Deck
k this deck
74
The summary statistics for a certain set of points are: n=17 ,
Assume the conditions of the linear model
hold A 95% confidence interval for will be constructed.
i). How many degrees of freedom are there for the critical value?
ii). What is the critical value?
iii). What is the margin of error?
iv). Construct the 95 % confidence interval.
Assume the conditions of the linear modelhold A 95% confidence interval for
will be constructed.i). How many degrees of freedom are there for the critical value?
ii). What is the critical value?
iii). What is the margin of error?
iv). Construct the 95 % confidence interval.
Unlock Deck
Unlock for access to all 140 flashcards in this deck.
Unlock Deck
k this deck
75
The following table presents measurements of the tensile strength (in kilopascals)of
Unlock Deck
Unlock for access to all 140 flashcards in this deck.
Unlock Deck
k this deck
76
The following table presents measurements of the tensile strength (in kilopascals)of
Unlock Deck
Unlock for access to all 140 flashcards in this deck.
Unlock Deck
k this deck
77
Use the given set of points to compute the margin of error for a 95% confidence interval for
A) 2.2860
B) 0.5409
C) 1.3236
D) 4.4235
A) 2.2860
B) 0.5409
C) 1.3236
D) 4.4235
Unlock Deck
Unlock for access to all 140 flashcards in this deck.
Unlock Deck
k this deck
78
An agricultural scientist performs a 2-way ANOVA to determine the effects of three different
Unlock Deck
Unlock for access to all 140 flashcards in this deck.
Unlock Deck
k this deck
79
Use the given set of points to compute the standard error of
A) 2.5043
B) 50.0000
C) 0.3542
D) 1.9300
A) 2.5043
B) 50.0000
C) 0.3542
D) 1.9300
Unlock Deck
Unlock for access to all 140 flashcards in this deck.
Unlock Deck
k this deck
80
Use the given set of points to compute the residual standard deviation
A) 44.8750
B) 2.5696
C) 7.9164
D) 1.6379
A) 44.8750
B) 2.5696
C) 7.9164
D) 1.6379
Unlock Deck
Unlock for access to all 140 flashcards in this deck.
Unlock Deck
k this deck
Unlock Deck
Unlock for access to all 140 flashcards in this deck.


