Deck 7: Estimating Parameters and Determining Sample Sizes
Full screen (f)
Question
Question
Question
Use the given degree of confidence and sample data to construct a confidence interval for the population proportion p .
n=195, x=162 ; 95 % confidence
A)
B)
C)
D)
n=195, x=162 ; 95 % confidence
A)
B)
C)
D)
Question
Of 380 randomly selected medical students, 21 said that they planned to work in a rural community. Find a 95 % confidence interval for the true proportion of all medical students who plan to work in a rural community.
A)
B)
C)
D)
A)
B)
C)
D)
Question
Do one of the following, as appropriate:
(a) Find the critical value
(b) find the critical value
(c) state that neither the normal nor the t distribution applies.
90% confidence interval for n=9 ;
n=9 ;  population appears to be very skewed.
A)
B)
C)
D) Neither the normal nor the t distribution applies.
(a) Find the critical value
(b) find the critical value
(c) state that neither the normal nor the t distribution applies.
90% confidence interval for
n=9 ; population appears to be very skewed.A)
B)
C)
D) Neither the normal nor the t distribution applies.
Question
Express the confidence interval (0.432,0.52) in the form of 
A)
B)
C)
D)
A)
B)
C)
D)
Question
Use the given degree of confidence and sample data to construct a confidence interval for the population mean  Assume that the population has a normal distribution. n=30 ,
  s=10.5,90 % confidence
A)
B)
C)
D)
Assume that the population has a normal distribution. n=30 , s=10.5,90 % confidenceA)
B)
C)
D)
Question
Find the critical value  corresponding to a sample size of 19 and a confidence level of 99 percent.
A) 37.156
B) 6.265
C) 34.805
D) 7.015
corresponding to a sample size of 19 and a confidence level of 99 percent.A) 37.156
B) 6.265
C) 34.805
D) 7.015
Question
Which critical value is appropriate for a 99% confidence level where n=17 ; is unknown and the population appears to be normally distributed?
A)
B)
C)
D)
is unknown and the population appears to be normally distributed?A)
B)
C)
D)
Question
Question
Question
Find the value of  that corresponds to a confidence level of 89.48%.
A) 1.25
B) 1.62
C) 0.0526
D) -1.62
that corresponds to a confidence level of 89.48%.A) 1.25
B) 1.62
C) 0.0526
D) -1.62
Question
A survey of 300 union members in New York State reveals that 112 favor the Republican candidate for governor. Construct the 98 % confidence interval for the true population proportion of all New York State union members who favor the Republican candidate.
A)
B)
C)
D)
A)
B)
C)
D)
Question
Question
Find the critical value  that corresponds to a 91% confidence level.
A) 1.34
B) 1.645
C) 1.70
D) 1.75
that corresponds to a 91% confidence level.A) 1.34
B) 1.645
C) 1.70
D) 1.75
Question
Use the given degree of confidence and sample data to construct a confidence interval for the population mean  Assume that the population has a normal distribution.
A laboratory tested twelve chicken eggs and found that the mean amount of cholesterol was 185 milligrams with s=17.6 milligrams. Construct a 95% confidence interval for the true mean cholesterol content of all such eggs.
A)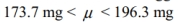
B)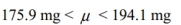
C)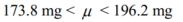
D)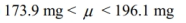
Assume that the population has a normal distribution.A laboratory tested twelve chicken eggs and found that the mean amount of cholesterol was 185 milligrams with s=17.6 milligrams. Construct a 95% confidence interval for the true mean cholesterol content of all such eggs.
A)
B)
C)
D)
Question
Use the given degree of confidence and sample data to construct a confidence interval for the population mean μ. Assume that the population has a normal distribution. 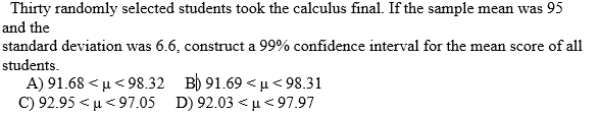
Question
In constructing a confidence interval for  or
or  , a table is used to find the critical values
  for values of
  For larger values of n,
  can be
approximated by using the following formula: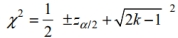 where k is the number of degrees of freedom and
  is the critical z-score. Construct the 90 % confidence interval for
  using the following sample data: a sample of size n=232 yields a mean weight of 154 lb and a standard deviation of 25.5 lb. Round the confidence interval limits to the nearest hundredth.
A)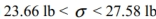
B)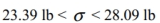
C)
D)
or , a table is used to find the critical values for values of For larger values of n, can beapproximated by using the following formula:
where k is the number of degrees of freedom and is the critical z-score. Construct the 90 % confidence interval for using the following sample data: a sample of size n=232 yields a mean weight of 154 lb and a standard deviation of 25.5 lb. Round the confidence interval limits to the nearest hundredth.A)
B)
C)
D)
Question
Question
Question
A 99% confidence interval (in inches) for the mean height of a population is 
This result is based on a sample of size 144. Construct the 95% confidence interval. (Hint: you will first need to find the sample mean and sample standard deviation).
A)
B)
C)
D)
This result is based on a sample of size 144. Construct the 95% confidence interval. (Hint: you will first need to find the sample mean and sample standard deviation).
A)
B)
C)
D)
Question
To find the standard deviation of the diameter of wooden dowels, the manufacturer measures 19 randomly selected dowels and finds the standard deviation of the sample to be s=0.16 . Find the 95 % confidence interval for the population standard deviation 
A)
B)
C)
D)
A)
B)
C)
D)
Question
A one-sided confidence interval for p can be written as 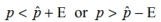 where the margin of error E is modified by replacing
  with
with  If a teacher wants to report that the fail rate on a test is at most x with 90 % confidence, construct the appropriate one -sided confidence interval. Assume that a simple random sample of 74 students results in 8 who fail the test.
A)
B)
C)
D)
where the margin of error E is modified by replacing with If a teacher wants to report that the fail rate on a test is at most x with 90 % confidence, construct the appropriate one -sided confidence interval. Assume that a simple random sample of 74 students results in 8 who fail the test.A)
B)
C)
D)
Question
Do one of the following, as appropriate:
(a) Find the critical value
(b) find the critical value
99 % ; n=17 ; is unknown; population appears to be normally distributed.
A)
B)
C)
D)
(a) Find the critical value
(b) find the critical value
99 % ; n=17 ;
is unknown; population appears to be normally distributed.A)
B)
C)
D)
Question
Use the given degree of confidence and sample data to construct a confidence interval for the population proportion p.
n=130, x=69 ; 90% confidence
A)
B)
C)
D)
n=130, x=69 ; 90% confidence
A)
B)
C)
D)
Question
Express the confidence interval  in the form of
A)
B)
C)
D)
in the form of A)
B)
C)
D)
Question
Question
Find the degree of confidence used in constructing the confidence interval  - for the population proportion p using sample data with n=109, x=65 .
A) 88 %
B) 90 %
C) 95 %
D) 99 %
- for the population proportion p using sample data with n=109, x=65 .A) 88 %
B) 90 %
C) 95 %
D) 99 %
Question
Of 118 randomly selected adults, 34 were found to have high blood pressure. Construct a 95 % confidence interval for the true percentage of all adults that have high blood pressure.
A)
B)
C)
D)
A)
B)
C)
D)
Question
Identify the distribution that applies to the following situation:
In constructing a confidence interval of , you have 50 sample values and they appear to be from a population with a skewed distribution. The population standard deviation is not known.
A) Student t distribution
B) Normal distribution
C) Chi-square distribution
D) None of the three distributions is appropriate.
In constructing a confidence interval of
, you have 50 sample values and they appear to be from a population with a skewed distribution. The population standard deviation is not known.A) Student t distribution
B) Normal distribution
C) Chi-square distribution
D) None of the three distributions is appropriate.
Question
Use the given data to find the minimum sample size required to estimate the population proportion. Margin of error: 0.008 ; confidence level: 98% ;  unknown
A) 22,184
B) 10,384
C) 21,207
D) 20,308V
unknownA) 22,184
B) 10,384
C) 21,207
D) 20,308V
Question
A group of 59 randomly selected students have a mean score of 29.5 with a standard deviation of 5.2 on a placement test. What is the 90 % confidence interval for the mean score,  , of all students taking the test?
A)
B)
C)
D)
, of all students taking the test?A)
B)
C)
D)
Question
Find the critical value  corresponding to a sample size of 19 and a confidence level of 99 percent.
A) 37.156
B) 6.265
C) 34.805
D) 7.015
corresponding to a sample size of 19 and a confidence level of 99 percent.A) 37.156
B) 6.265
C) 34.805
D) 7.015
Question
Express a confidence interval defined as (0.432,0.52) in the form of the point estimate _____  the margin of error______
Express both in three decimal places.
A)
B)
C)
D)
the margin of error______Express both in three decimal places.
A)
B)
C)
D)
Question
A laboratory tested 82 chicken eggs and found that the mean amount of cholesterol was 228 milligrams with 
Construct a 95% confidence interval for the true mean cholesterol content, of all such eggs.
A)
B)
C)
D)
Construct a 95% confidence interval for the true mean cholesterol content,
of all such eggs.A)
B)
C)
D)
Question
Question
Use the given degree of confidence and sample data to construct a confidence interval for the population mean  Assume that the population has a normal distribution.
A laboratory tested twelve chicken eggs and found that the mean amount of cholesterol was 185 milligrams with s=17.6 milligrams. A confidence interval of mg is constructed for the true mean cholesterol content of all such eggs. It was assumed that the population has a normal distribution. What confidence level does this interval represent?
A) 99%
B) 95%
C) 98%
D) 80%
Assume that the population has a normal distribution.A laboratory tested twelve chicken eggs and found that the mean amount of cholesterol was 185 milligrams with s=17.6 milligrams. A confidence interval of
mg is constructed for the true mean cholesterol content of all such eggs. It was assumed that the population has a normal distribution. What confidence level does this interval represent? A) 99%
B) 95%
C) 98%
D) 80%
Question
Use the given degree of confidence and sample data to construct a confidence interval for the population proportion p.
n=56, x=30 ; 95% confidence
A)
B)
C)
D)
n=56, x=30 ; 95% confidence
A)
B)
C)
D)
Question
Fill in the blank: The critical value  that corresponds to a ______% confidence level is 2.33 .
A) 88
B) 90
C) 98
D) 99
that corresponds to a ______% confidence level is 2.33 . A) 88
B) 90
C) 98
D) 99
Question
Which of the following critical values is appropriate for a 98% confidence level where n=7 ;  and the population appears to be normally distributed.
A)
B)
C)
D)
and the population appears to be normally distributed.A)
B)
C)
D)
Question
The following is a 95 % confidence interval of the proportion of female medical school students:  based on data from the American Medical Association. What is the point estimate of the proportion of females in the population of medical school students? Write a brief statement that correctly interprets the confidence interval given.
based on data from the American Medical Association. What is the point estimate of the proportion of females in the population of medical school students? Write a brief statement that correctly interprets the confidence interval given. Question
Question
Question
When determining the sample size needed to achieve a particular error estimate you need to know  What are two methods of estimating
  if
if  is unknown?
What are two methods of estimating if is unknown? Question
Interpret the following 95 % confidence interval for mean weekly salaries of shift managers at Guiseppe's Pizza and Pasta.
Question
Question
Question
Under what circumstances can you replace  with s in the formula
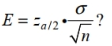
with s in the formula Question
Question
In general, what does "degrees of freedom" refer to? Find the degrees of freedom for the given information, assuming that you want to construct a confidence interval estimate of  Six human skulls from around 4000 B.C. were measured, and the lengths have a mean of 94.2 mm and a standard deviation of 4.9 mm.
Six human skulls from around 4000 B.C. were measured, and the lengths have a mean of 94.2 mm and a standard deviation of 4.9 mm. Question
Question
Question
Define margin of error. Explain the relation between the confidence interval and the margin of error. Suppose a confidence interval is  Redefine the confidence interval into a format using the margin of error and the point estimate of the population mean.
Redefine the confidence interval into a format using the margin of error and the point estimate of the population mean. Question
Question
Question
How do you determine whether to use the z or t distribution in computing the margin of error, 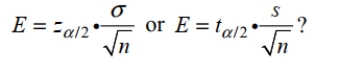
Question
Question
Why is  the best point estimate of
  ?
?
the best point estimate of ? Question
Identify the correct distribution (z, t, or neither)for each of the following 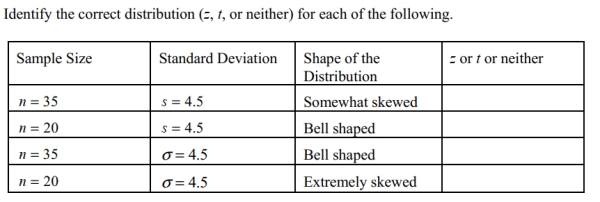
Question

Unlock Deck
Sign up to unlock the cards in this deck!
Unlock Deck
Unlock Deck
1/60
Play
Full screen (f)
Deck 7: Estimating Parameters and Determining Sample Sizes
1
The margin of error ________ ________ (increases or decreases)with an increase in confidence level.
A) increases; increases
B) increases; decreases
C) decreases; increases
D) decreases; decreases
A) increases; increases
B) increases; decreases
C) decreases; increases
D) decreases; decreases
C
2
Fifty people are selected randomly from a certain population and it is found that 12 people in the sample are over six feet tall. What is the best point estimate of the proportion of people in the population who are over 6 feet tall?
A) 0.76
B) 0.24
C) 0.50
D) 0.18
A) 0.76
B) 0.24
C) 0.50
D) 0.18
B
3
Use the given degree of confidence and sample data to construct a confidence interval for the population proportion p .
n=195, x=162 ; 95 % confidence
A)
B)
C)
D)
n=195, x=162 ; 95 % confidence
A)
B)
C)
D)
4
Of 380 randomly selected medical students, 21 said that they planned to work in a rural community. Find a 95 % confidence interval for the true proportion of all medical students who plan to work in a rural community.
A)
B)
C)
D)
A)
B)
C)
D)
Unlock Deck
Unlock for access to all 60 flashcards in this deck.
Unlock Deck
k this deck
5
Do one of the following, as appropriate:
(a) Find the critical value
(b) find the critical value
(c) state that neither the normal nor the t distribution applies.
90% confidence interval for n=9 ; population appears to be very skewed.
A)
B)
C)
D) Neither the normal nor the t distribution applies.
(a) Find the critical value
(b) find the critical value
(c) state that neither the normal nor the t distribution applies.
90% confidence interval for
n=9 ; population appears to be very skewed.A)
B)
C)
D) Neither the normal nor the t distribution applies.
Unlock Deck
Unlock for access to all 60 flashcards in this deck.
Unlock Deck
k this deck
6
Express the confidence interval (0.432,0.52) in the form of
A)
B)
C)
D)
A)
B)
C)
D)
Unlock Deck
Unlock for access to all 60 flashcards in this deck.
Unlock Deck
k this deck
7
Use the given degree of confidence and sample data to construct a confidence interval for the population mean Assume that the population has a normal distribution. n=30 , s=10.5,90 % confidence
A)
B)
C)
D)
Assume that the population has a normal distribution. n=30 , s=10.5,90 % confidenceA)
B)
C)
D)
Unlock Deck
Unlock for access to all 60 flashcards in this deck.
Unlock Deck
k this deck
8
Find the critical value corresponding to a sample size of 19 and a confidence level of 99 percent.
A) 37.156
B) 6.265
C) 34.805
D) 7.015
corresponding to a sample size of 19 and a confidence level of 99 percent.A) 37.156
B) 6.265
C) 34.805
D) 7.015
Unlock Deck
Unlock for access to all 60 flashcards in this deck.
Unlock Deck
k this deck
9
Which critical value is appropriate for a 99% confidence level where n=17 ; is unknown and the population appears to be normally distributed?
A)
B)
C)
D)
is unknown and the population appears to be normally distributed?A)
B)
C)
D)
Unlock Deck
Unlock for access to all 60 flashcards in this deck.
Unlock Deck
k this deck
10
Assume that a sample is used to estimate a population proportion p. Find the margin of error E that corresponds to the given statistics and confidence level. Round the margin of error to four decimal places.
98% confidence; the sample size is 800, of which 40% are successes
A) 0.0355
B) 0.0339
C) 0.0404
D) 0.0446
98% confidence; the sample size is 800, of which 40% are successes
A) 0.0355
B) 0.0339
C) 0.0404
D) 0.0446
Unlock Deck
Unlock for access to all 60 flashcards in this deck.
Unlock Deck
k this deck
11
If the computed minimum sample size n needed for a particular margin of error is not a whole number, round the value of n _____ (up or down) to the next _____ (smaller or larger) whole number.
A) up; smaller
B) up; larger
C) down; smaller
D) down; larger
A) up; smaller
B) up; larger
C) down; smaller
D) down; larger
Unlock Deck
Unlock for access to all 60 flashcards in this deck.
Unlock Deck
k this deck
12
Find the value of that corresponds to a confidence level of 89.48%.
A) 1.25
B) 1.62
C) 0.0526
D) -1.62
that corresponds to a confidence level of 89.48%.A) 1.25
B) 1.62
C) 0.0526
D) -1.62
Unlock Deck
Unlock for access to all 60 flashcards in this deck.
Unlock Deck
k this deck
13
A survey of 300 union members in New York State reveals that 112 favor the Republican candidate for governor. Construct the 98 % confidence interval for the true population proportion of all New York State union members who favor the Republican candidate.
A)
B)
C)
D)
A)
B)
C)
D)
Unlock Deck
Unlock for access to all 60 flashcards in this deck.
Unlock Deck
k this deck
14
Assume that a sample is used to estimate a population proportion p. Find the margin of error E that corresponds to the given statistics and confidence level.
95% confidence; n=2388, x=1672
A) 0.0248
B) 0.0184
C) 0.0156
D) 0.0206
95% confidence; n=2388, x=1672
A) 0.0248
B) 0.0184
C) 0.0156
D) 0.0206
Unlock Deck
Unlock for access to all 60 flashcards in this deck.
Unlock Deck
k this deck
15
Find the critical value that corresponds to a 91% confidence level.
A) 1.34
B) 1.645
C) 1.70
D) 1.75
that corresponds to a 91% confidence level.A) 1.34
B) 1.645
C) 1.70
D) 1.75
Unlock Deck
Unlock for access to all 60 flashcards in this deck.
Unlock Deck
k this deck
16
Use the given degree of confidence and sample data to construct a confidence interval for the population mean Assume that the population has a normal distribution.
A laboratory tested twelve chicken eggs and found that the mean amount of cholesterol was 185 milligrams with s=17.6 milligrams. Construct a 95% confidence interval for the true mean cholesterol content of all such eggs.
A)
B)
C)
D)
Assume that the population has a normal distribution.A laboratory tested twelve chicken eggs and found that the mean amount of cholesterol was 185 milligrams with s=17.6 milligrams. Construct a 95% confidence interval for the true mean cholesterol content of all such eggs.
A)
B)
C)
D)
Unlock Deck
Unlock for access to all 60 flashcards in this deck.
Unlock Deck
k this deck
17
Use the given degree of confidence and sample data to construct a confidence interval for the population mean μ. Assume that the population has a normal distribution.
Unlock Deck
Unlock for access to all 60 flashcards in this deck.
Unlock Deck
k this deck
18
In constructing a confidence interval for or , a table is used to find the critical values for values of For larger values of n, can be
approximated by using the following formula: where k is the number of degrees of freedom and is the critical z-score. Construct the 90 % confidence interval for using the following sample data: a sample of size n=232 yields a mean weight of 154 lb and a standard deviation of 25.5 lb. Round the confidence interval limits to the nearest hundredth.
A)
B)
C)
D)
or , a table is used to find the critical values for values of For larger values of n, can beapproximated by using the following formula:
where k is the number of degrees of freedom and is the critical z-score. Construct the 90 % confidence interval for using the following sample data: a sample of size n=232 yields a mean weight of 154 lb and a standard deviation of 25.5 lb. Round the confidence interval limits to the nearest hundredth.A)
B)
C)
D)
Unlock Deck
Unlock for access to all 60 flashcards in this deck.
Unlock Deck
k this deck
19
Use the given data to find the minimum sample size required to estimate the population proportion. Margin of error: 0.028; confidence level: 99%; p and q unknown
A) 1116
B) 2223
C) 1939
D) 2115
A) 1116
B) 2223
C) 1939
D) 2115
Unlock Deck
Unlock for access to all 60 flashcards in this deck.
Unlock Deck
k this deck
20
Identify the distribution that applies to the following situation: In constructing a confidence interval of σ you have 50 sample values and they appear to be from a population with a skewed distribution.
A) Student t distribution
B) Normal distribution
C) Chi-square distribution
D) None of the three distributions is appropriate.
A) Student t distribution
B) Normal distribution
C) Chi-square distribution
D) None of the three distributions is appropriate.
Unlock Deck
Unlock for access to all 60 flashcards in this deck.
Unlock Deck
k this deck
21
A 99% confidence interval (in inches) for the mean height of a population is
This result is based on a sample of size 144. Construct the 95% confidence interval. (Hint: you will first need to find the sample mean and sample standard deviation).
A)
B)
C)
D)
This result is based on a sample of size 144. Construct the 95% confidence interval. (Hint: you will first need to find the sample mean and sample standard deviation).
A)
B)
C)
D)
Unlock Deck
Unlock for access to all 60 flashcards in this deck.
Unlock Deck
k this deck
22
To find the standard deviation of the diameter of wooden dowels, the manufacturer measures 19 randomly selected dowels and finds the standard deviation of the sample to be s=0.16 . Find the 95 % confidence interval for the population standard deviation
A)
B)
C)
D)
A)
B)
C)
D)
Unlock Deck
Unlock for access to all 60 flashcards in this deck.
Unlock Deck
k this deck
23
A one-sided confidence interval for p can be written as where the margin of error E is modified by replacing with If a teacher wants to report that the fail rate on a test is at most x with 90 % confidence, construct the appropriate one -sided confidence interval. Assume that a simple random sample of 74 students results in 8 who fail the test.
A)
B)
C)
D)
where the margin of error E is modified by replacing with If a teacher wants to report that the fail rate on a test is at most x with 90 % confidence, construct the appropriate one -sided confidence interval. Assume that a simple random sample of 74 students results in 8 who fail the test.A)
B)
C)
D)
Unlock Deck
Unlock for access to all 60 flashcards in this deck.
Unlock Deck
k this deck
24
Do one of the following, as appropriate:
(a) Find the critical value
(b) find the critical value
99 % ; n=17 ; is unknown; population appears to be normally distributed.
A)
B)
C)
D)
(a) Find the critical value
(b) find the critical value
99 % ; n=17 ;
is unknown; population appears to be normally distributed.A)
B)
C)
D)
Unlock Deck
Unlock for access to all 60 flashcards in this deck.
Unlock Deck
k this deck
25
Use the given degree of confidence and sample data to construct a confidence interval for the population proportion p.
n=130, x=69 ; 90% confidence
A)
B)
C)
D)
n=130, x=69 ; 90% confidence
A)
B)
C)
D)
Unlock Deck
Unlock for access to all 60 flashcards in this deck.
Unlock Deck
k this deck
26
Express the confidence interval in the form of
A)
B)
C)
D)
in the form of A)
B)
C)
D)
Unlock Deck
Unlock for access to all 60 flashcards in this deck.
Unlock Deck
k this deck
27
You want to be 95% confident that the sample variance is within 40% of the population variance. Find the appropriate minimum sample size.
A) 57
B) 224
C) 14
D) 11
A) 57
B) 224
C) 14
D) 11
Unlock Deck
Unlock for access to all 60 flashcards in this deck.
Unlock Deck
k this deck
28
Find the degree of confidence used in constructing the confidence interval - for the population proportion p using sample data with n=109, x=65 .
A) 88 %
B) 90 %
C) 95 %
D) 99 %
- for the population proportion p using sample data with n=109, x=65 .A) 88 %
B) 90 %
C) 95 %
D) 99 %
Unlock Deck
Unlock for access to all 60 flashcards in this deck.
Unlock Deck
k this deck
29
Of 118 randomly selected adults, 34 were found to have high blood pressure. Construct a 95 % confidence interval for the true percentage of all adults that have high blood pressure.
A)
B)
C)
D)
A)
B)
C)
D)
Unlock Deck
Unlock for access to all 60 flashcards in this deck.
Unlock Deck
k this deck
30
Identify the distribution that applies to the following situation:
In constructing a confidence interval of, you have 50 sample values and they appear to be from a population with a skewed distribution. The population standard deviation is not known.
A) Student t distribution
B) Normal distribution
C) Chi-square distribution
D) None of the three distributions is appropriate.
In constructing a confidence interval of
, you have 50 sample values and they appear to be from a population with a skewed distribution. The population standard deviation is not known.A) Student t distribution
B) Normal distribution
C) Chi-square distribution
D) None of the three distributions is appropriate.
Unlock Deck
Unlock for access to all 60 flashcards in this deck.
Unlock Deck
k this deck
31
Use the given data to find the minimum sample size required to estimate the population proportion. Margin of error: 0.008 ; confidence level: 98% ; unknown
A) 22,184
B) 10,384
C) 21,207
D) 20,308V
unknownA) 22,184
B) 10,384
C) 21,207
D) 20,308V
Unlock Deck
Unlock for access to all 60 flashcards in this deck.
Unlock Deck
k this deck
32
A group of 59 randomly selected students have a mean score of 29.5 with a standard deviation of 5.2 on a placement test. What is the 90 % confidence interval for the mean score, , of all students taking the test?
A)
B)
C)
D)
, of all students taking the test?A)
B)
C)
D)
Unlock Deck
Unlock for access to all 60 flashcards in this deck.
Unlock Deck
k this deck
33
Find the critical value corresponding to a sample size of 19 and a confidence level of 99 percent.
A) 37.156
B) 6.265
C) 34.805
D) 7.015
corresponding to a sample size of 19 and a confidence level of 99 percent.A) 37.156
B) 6.265
C) 34.805
D) 7.015
Unlock Deck
Unlock for access to all 60 flashcards in this deck.
Unlock Deck
k this deck
34
Express a confidence interval defined as (0.432,0.52) in the form of the point estimate _____ the margin of error______
Express both in three decimal places.
A)
B)
C)
D)
the margin of error______Express both in three decimal places.
A)
B)
C)
D)
Unlock Deck
Unlock for access to all 60 flashcards in this deck.
Unlock Deck
k this deck
35
A laboratory tested 82 chicken eggs and found that the mean amount of cholesterol was 228 milligrams with
Construct a 95% confidence interval for the true mean cholesterol content, of all such eggs.
A)
B)
C)
D)
Construct a 95% confidence interval for the true mean cholesterol content,
of all such eggs.A)
B)
C)
D)
Unlock Deck
Unlock for access to all 60 flashcards in this deck.
Unlock Deck
k this deck
36
To be able to say with 95% confidence that the standard deviation of a data set is within 10% of the population's standard deviation, the number of observations within the data set must be greater than or equal to what quantity?
A) 805
B) 192
C) 335
D) 250
A) 805
B) 192
C) 335
D) 250
Unlock Deck
Unlock for access to all 60 flashcards in this deck.
Unlock Deck
k this deck
37
Use the given degree of confidence and sample data to construct a confidence interval for the population mean Assume that the population has a normal distribution.
A laboratory tested twelve chicken eggs and found that the mean amount of cholesterol was 185 milligrams with s=17.6 milligrams. A confidence interval of mg is constructed for the true mean cholesterol content of all such eggs. It was assumed that the population has a normal distribution. What confidence level does this interval represent?
A) 99%
B) 95%
C) 98%
D) 80%
Assume that the population has a normal distribution.A laboratory tested twelve chicken eggs and found that the mean amount of cholesterol was 185 milligrams with s=17.6 milligrams. A confidence interval of
mg is constructed for the true mean cholesterol content of all such eggs. It was assumed that the population has a normal distribution. What confidence level does this interval represent? A) 99%
B) 95%
C) 98%
D) 80%
Unlock Deck
Unlock for access to all 60 flashcards in this deck.
Unlock Deck
k this deck
38
Use the given degree of confidence and sample data to construct a confidence interval for the population proportion p.
n=56, x=30 ; 95% confidence
A)
B)
C)
D)
n=56, x=30 ; 95% confidence
A)
B)
C)
D)
Unlock Deck
Unlock for access to all 60 flashcards in this deck.
Unlock Deck
k this deck
39
Fill in the blank: The critical value that corresponds to a ______% confidence level is 2.33 .
A) 88
B) 90
C) 98
D) 99
that corresponds to a ______% confidence level is 2.33 . A) 88
B) 90
C) 98
D) 99
Unlock Deck
Unlock for access to all 60 flashcards in this deck.
Unlock Deck
k this deck
40
Which of the following critical values is appropriate for a 98% confidence level where n=7 ; and the population appears to be normally distributed.
A)
B)
C)
D)
and the population appears to be normally distributed.A)
B)
C)
D)
Unlock Deck
Unlock for access to all 60 flashcards in this deck.
Unlock Deck
k this deck
41
The following is a 95 % confidence interval of the proportion of female medical school students: based on data from the American Medical Association. What is the point estimate of the proportion of females in the population of medical school students? Write a brief statement that correctly interprets the confidence interval given.
based on data from the American Medical Association. What is the point estimate of the proportion of females in the population of medical school students? Write a brief statement that correctly interprets the confidence interval given. Unlock Deck
Unlock for access to all 60 flashcards in this deck.
Unlock Deck
k this deck
42
In a Gallup poll, 1011 adults were asked if they consume alcoholic beverages and 64% of them said that they did. Construct a 90% confidence interval estimate of the proportion of all
adults who consume alcoholic beverages. Can we safely conclude that the majority of adults
consume alcoholic beverages?
adults who consume alcoholic beverages. Can we safely conclude that the majority of adults
consume alcoholic beverages?
Unlock Deck
Unlock for access to all 60 flashcards in this deck.
Unlock Deck
k this deck
43
Six human skulls from around 4000 B.C. were measured, and the lengths have a mean of 94.2 mm and a standard deviation of 4.9 mm. If you want to construct a 95% confidence
interval estimate of the mean length of skulls, what requirements must be satisfied?
interval estimate of the mean length of skulls, what requirements must be satisfied?
Unlock Deck
Unlock for access to all 60 flashcards in this deck.
Unlock Deck
k this deck
44
When determining the sample size needed to achieve a particular error estimate you need to know What are two methods of estimating if is unknown?
What are two methods of estimating if is unknown? Unlock Deck
Unlock for access to all 60 flashcards in this deck.
Unlock Deck
k this deck
45
Interpret the following 95 % confidence interval for mean weekly salaries of shift managers at Guiseppe's Pizza and Pasta.
Unlock Deck
Unlock for access to all 60 flashcards in this deck.
Unlock Deck
k this deck
46
Describe the process for finding the confidence interval for a population proportion
Unlock Deck
Unlock for access to all 60 flashcards in this deck.
Unlock Deck
k this deck
47
Bert constructed a confidence interval to estimate the mean weight of students in his class. The population was very small - only 30. Ruth constructed a confidence interval for the mean
weight of all adult males in the city. She based her confidence interval on a very small
sample of only 5. Which confidence interval is likely to give a better estimate of the mean it is
estimating? Which is likely to be more of a problem, a small sample or a small population?
weight of all adult males in the city. She based her confidence interval on a very small
sample of only 5. Which confidence interval is likely to give a better estimate of the mean it is
estimating? Which is likely to be more of a problem, a small sample or a small population?
Unlock Deck
Unlock for access to all 60 flashcards in this deck.
Unlock Deck
k this deck
48
Under what circumstances can you replace with s in the formula
with s in the formula Unlock Deck
Unlock for access to all 60 flashcards in this deck.
Unlock Deck
k this deck
49
You want to estimate σ for the population of waiting times at McDonald's drive-up windows, and you want to be 95% confident that the sample standard deviation is with 20% of σ. Find
the minimum sample size. Is this sample size practical?
the minimum sample size. Is this sample size practical?
Unlock Deck
Unlock for access to all 60 flashcards in this deck.
Unlock Deck
k this deck
50
In general, what does "degrees of freedom" refer to? Find the degrees of freedom for the given information, assuming that you want to construct a confidence interval estimate of Six human skulls from around 4000 B.C. were measured, and the lengths have a mean of 94.2 mm and a standard deviation of 4.9 mm.
Six human skulls from around 4000 B.C. were measured, and the lengths have a mean of 94.2 mm and a standard deviation of 4.9 mm. Unlock Deck
Unlock for access to all 60 flashcards in this deck.
Unlock Deck
k this deck
51
Define in as clear language as possible how a 95% confidence interval can be used for hypothesis tests.
Unlock Deck
Unlock for access to all 60 flashcards in this deck.
Unlock Deck
k this deck
52
In a Gallup poll of 557 randomly selected adults, 284 said that they were underpaid. Identify the best point estimate of the percentage of adults who say they are underpaid. Construct a
95% confidence interval estimate of the percentage of adults who say that that they are
underpaid. Can we safely conclude that the majority of adults say that they are underpaid?
95% confidence interval estimate of the percentage of adults who say that that they are
underpaid. Can we safely conclude that the majority of adults say that they are underpaid?
Unlock Deck
Unlock for access to all 60 flashcards in this deck.
Unlock Deck
k this deck
53
Define margin of error. Explain the relation between the confidence interval and the margin of error. Suppose a confidence interval is Redefine the confidence interval into a format using the margin of error and the point estimate of the population mean.
Redefine the confidence interval into a format using the margin of error and the point estimate of the population mean. Unlock Deck
Unlock for access to all 60 flashcards in this deck.
Unlock Deck
k this deck
54
Describe the steps for finding a confidence interval
Unlock Deck
Unlock for access to all 60 flashcards in this deck.
Unlock Deck
k this deck
55
Based on a simple random sample of students from her school, Sally obtained a point estimate of the mean weight of students at her school. What additional information would
be provided by a confidence interval estimate of the mean weight?
be provided by a confidence interval estimate of the mean weight?
Unlock Deck
Unlock for access to all 60 flashcards in this deck.
Unlock Deck
k this deck
56
How do you determine whether to use the z or t distribution in computing the margin of error,
Unlock Deck
Unlock for access to all 60 flashcards in this deck.
Unlock Deck
k this deck
57
Draw a diagram of the chi-square distribution. Discuss its shape and values
Unlock Deck
Unlock for access to all 60 flashcards in this deck.
Unlock Deck
k this deck
58
Why is the best point estimate of ?
the best point estimate of ? Unlock Deck
Unlock for access to all 60 flashcards in this deck.
Unlock Deck
k this deck
59
Identify the correct distribution (z, t, or neither)for each of the following
Unlock Deck
Unlock for access to all 60 flashcards in this deck.
Unlock Deck
k this deck
60
In a Gallup poll, 1011 adults were asked if they consume alcoholic beverages and 64% of them said that they did. Construct a 90% confidence interval estimate of the proportion of all
adults who consume alcoholic beverages. Can we safely conclude that the majority of adults
consume alcoholic beverages?
adults who consume alcoholic beverages. Can we safely conclude that the majority of adults
consume alcoholic beverages?
Unlock Deck
Unlock for access to all 60 flashcards in this deck.
Unlock Deck
k this deck
Unlock Deck
Unlock for access to all 60 flashcards in this deck.


