Deck 14: Performance Measurement
Full screen (f)
Question
Question
Question
Question
Question
Question
Question
Question
Question
Question
Question
Question
Question
Question
Question
Question
Question
Question
Question
Question
Question
Question
Question
Question
Question
Question
Use the following information for questions. 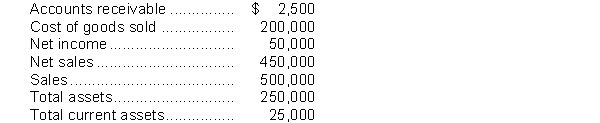
In performing a vertical analysis, the percentage for cost of goods sold is
A) 4.4%.
B) 40.0%.
C) 44.4%.
D) 400.0%.
In performing a vertical analysis, the percentage for cost of goods sold is
A) 4.4%.
B) 40.0%.
C) 44.4%.
D) 400.0%.
Question
Question
Question
Question
Question
Question
Assume the following sales data for a company:  What is the percentage increase in sales from 2017 to 2018?
A) 11%
B) 88%
C) 12%
D) 47%
What is the percentage increase in sales from 2017 to 2018?A) 11%
B) 88%
C) 12%
D) 47%
Question
Question
Use the following information for questions.
In performing a vertical analysis, the percentage for accounts receivable is
A) 0.5%.
B) 1.0%.
C) 5.0%.
D) 10.0%.
In performing a vertical analysis, the percentage for accounts receivable is
A) 0.5%.
B) 1.0%.
C) 5.0%.
D) 10.0%.
Question
Question
Question
Question
Question
Question
Question
Question
Question
Question
Question
Use the following information for questions.
Nelly Inc. reported net credit sales of $24,000,000 and cost of goods sold of $18,000,000 for the year. The average inventory for the year was $6,000,000.
If a company has a current ratio of 1.3:1, what effects will the borrowing of cash by short-term debt and collection of accounts receivable have on the ratio?
Question
Question
Question
Question
Question
Question
Question
Question
Question
Question
Question
Question
Question
Question
Question
Question
The following ratios have been calculated for Rosco and Ramsey Limited for 2018:  Financial statement information for 2018 for Rosco and Ramsey Limited with missing information follows:
 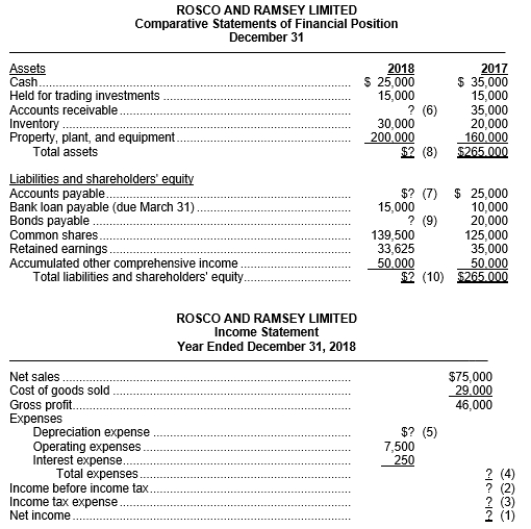 InstructionsUsing the above ratios and information from Rosco and Ramsey Limited's financial statements, fill in the missing information on the financial statements. Follow the sequence indicated. Show calculations that support your answers.
Financial statement information for 2018 for Rosco and Ramsey Limited with missing information follows: InstructionsUsing the above ratios and information from Rosco and Ramsey Limited's financial statements, fill in the missing information on the financial statements. Follow the sequence indicated. Show calculations that support your answers. Question
Comparative information taken from Water Works Corporation's financial statements is shown below: 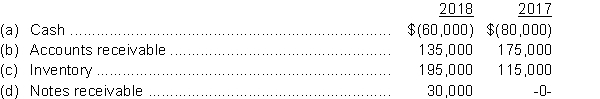 InstructionsUsing horizontal analysis, calculate the percentage change from 2017 to 2018.
InstructionsUsing horizontal analysis, calculate the percentage change from 2017 to 2018. Question
The following items were taken from the financial statements of McGonigal Inc. over a four-year period: 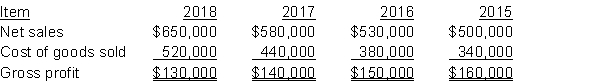 InstructionsUsing horizontal analysis and 2013 as the base year, calculate the horizontal percentages of a base period for net sales, cost of goods sold, and gross profit. Explain whether the trends are favourable or unfavourable for each item.
InstructionsUsing horizontal analysis and 2013 as the base year, calculate the horizontal percentages of a base period for net sales, cost of goods sold, and gross profit. Explain whether the trends are favourable or unfavourable for each item. Question
Selected data from McAllister Corp. are presented below: 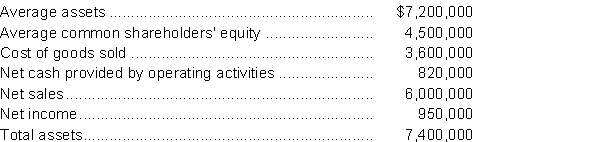 InstructionsCalculate all of the profitability ratios that can be determined from the above information.
InstructionsCalculate all of the profitability ratios that can be determined from the above information. Question
The following items were taken from the financial statements of Nesci Ltd. over a three-year period: 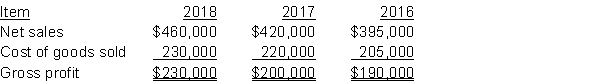 InstructionsUsing horizontal analysis and 2016 as the base year, calculate the horizontal percentages of a base period for net sales, cost of goods sold, and gross profit. Explain whether the trends are favourable or unfavourable for each item.
InstructionsUsing horizontal analysis and 2016 as the base year, calculate the horizontal percentages of a base period for net sales, cost of goods sold, and gross profit. Explain whether the trends are favourable or unfavourable for each item. Question
Presented below are liquidity and solvency ratios for Carmelo Industries, along with industry averages: 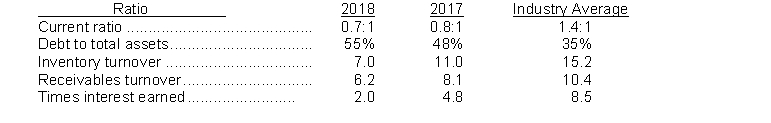 InstructionsAnalyze the company's liquidity and solvency using the information presented. Present a conclusion on the liquidity and solvency, supported by your analysis.
InstructionsAnalyze the company's liquidity and solvency using the information presented. Present a conclusion on the liquidity and solvency, supported by your analysis.
Unlock Deck
Sign up to unlock the cards in this deck!
Unlock Deck
Unlock Deck
1/66
Play
Full screen (f)
Deck 14: Performance Measurement
1
Calculate and interpret ratios that are used to analyze solvency.
Horizontal analysis is a technique for evaluating a series of data, such as line items in a company's financial statements, by expressing them as percentage increases or decreases over two or more years (or periods of time). The horizontal percentage of a base-period amount is calculated by dividing the amount in a specific year (period) by a base-year (period) amount. This percentage calculation normally covers multiple years (periods). The horizontal percentage change for the period is calculated by dividing the dollar amount of the change between two years (or periods) by the prior-year (period) amount. This percentage calculation normally covers two years (or periods) only. Vertical analysis is a technique for evaluating data within one year (or period) by expressing each item in a financial statement as a percentage of a relevant total (base amount) in that same financial statement. For example, the vertical percentage of a base amount can be determined by expressing each item on the income statement as a percentage of revenue (or net sales) or each item on the statement of financial position as a percentage of total assets by dividing the financial statement amount under analysis by the base amount for that particular financial statement.
2
If a company has sales of $100 in 2017 (the base period) and $560 in 2018 (the analysis period), the percentage of the base period is 460%.
False
3
An assessment of liquidity can be done based on only one ratio, such as the current ratio or the receivables ratio.
False
4
A solvency ratio measures the net income or operating success of a company for a given period of time.
Unlock Deck
Unlock for access to all 66 flashcards in this deck.
Unlock Deck
k this deck
5
In the vertical analysis of a statement of financial position, the base for current liabilities is total liabilities.
Unlock Deck
Unlock for access to all 66 flashcards in this deck.
Unlock Deck
k this deck
6
Using vertical analysis on the income statement, a company's net income as a percentage of net sales is 15%; therefore, the cost of goods sold as a percentage of net sales must be 85%.
Unlock Deck
Unlock for access to all 66 flashcards in this deck.
Unlock Deck
k this deck
7
Explain and apply comparative analysis.
Unlock Deck
Unlock for access to all 66 flashcards in this deck.
Unlock Deck
k this deck
8
Calculate and interpret ratios that are used to analyze liquidity.
Unlock Deck
Unlock for access to all 66 flashcards in this deck.
Unlock Deck
k this deck
9
Horizontal analysis is also called
A) percentage analysis.
B) trend analysis.
C) vertical analysis.
D) economic analysis.
A) percentage analysis.
B) trend analysis.
C) vertical analysis.
D) economic analysis.
Unlock Deck
Unlock for access to all 66 flashcards in this deck.
Unlock Deck
k this deck
10
In horizontal analysis, if an item has a negative amount in the base year, and a positive amount in the following year, the percentage change will exceed 100%.
Unlock Deck
Unlock for access to all 66 flashcards in this deck.
Unlock Deck
k this deck
11
If a company has sales of $220 in 2017 and $560 in 2018, the percentage increase in sales from 2017 to 2018 is 155%.
Unlock Deck
Unlock for access to all 66 flashcards in this deck.
Unlock Deck
k this deck
12
Liquidity ratios measure the ability of the company to survive over a long period of time.
Unlock Deck
Unlock for access to all 66 flashcards in this deck.
Unlock Deck
k this deck
13
Comparisons of company data with industry averages provide information about a company's relative position within the industry.
Unlock Deck
Unlock for access to all 66 flashcards in this deck.
Unlock Deck
k this deck
14
The current ratio should not be interpreted on its own without also looking at the receivables turnover and inventory turnover ratios.
Unlock Deck
Unlock for access to all 66 flashcards in this deck.
Unlock Deck
k this deck
15
The receivables turnover ratio is useful in assessing the profitability of receivables.
Unlock Deck
Unlock for access to all 66 flashcards in this deck.
Unlock Deck
k this deck
16
Comparisons of financial data made within a company are called
A) intracompany comparisons.
B) interior comparisons.
C) intercompany comparisons.
D) intramural comparisons.
A) intracompany comparisons.
B) interior comparisons.
C) intercompany comparisons.
D) intramural comparisons.
Unlock Deck
Unlock for access to all 66 flashcards in this deck.
Unlock Deck
k this deck
17
On an income statement analyzed vertically, each item is expressed as a percentage of net income.
Unlock Deck
Unlock for access to all 66 flashcards in this deck.
Unlock Deck
k this deck
18
The first step in any comprehensive analysis is to perform a horizontal and vertical analysis.
Unlock Deck
Unlock for access to all 66 flashcards in this deck.
Unlock Deck
k this deck
19
On a statement of financial position analyzed vertically, total assets are represented by 100%.
Unlock Deck
Unlock for access to all 66 flashcards in this deck.
Unlock Deck
k this deck
20
When preparing a vertical analysis on an income statement, net sales are represented by 100%.
Unlock Deck
Unlock for access to all 66 flashcards in this deck.
Unlock Deck
k this deck
21
In horizontal analysis, the percentage of a base-period amount is calculated by
A) dividing the analysis period amount by the base period amount.
B) dividing the dollar amount of the change since the base period by the base period amount.
C) dividing the item under analysis by net sales.
D) dividing the item under analysis by total assets.
A) dividing the analysis period amount by the base period amount.
B) dividing the dollar amount of the change since the base period by the base period amount.
C) dividing the item under analysis by net sales.
D) dividing the item under analysis by total assets.
Unlock Deck
Unlock for access to all 66 flashcards in this deck.
Unlock Deck
k this deck
22
In vertical analysis of an income statement, the 100% figure is
A) net income.
B) cost of goods sold.
C) gross profit.
D) net sales.
A) net income.
B) cost of goods sold.
C) gross profit.
D) net sales.
Unlock Deck
Unlock for access to all 66 flashcards in this deck.
Unlock Deck
k this deck
23
Horizontal analysis of comparative financial statements includes the
A) development of vertically analyzed statements.
B) calculation of liquidity ratios.
C) calculation of dollar amount changes and percentage changes from the previous to the current year.
D) evaluation of financial statement data that expresses each item in the current period's financial statement as a percentage of a base amount.
Unlock Deck
Unlock for access to all 66 flashcards in this deck.
Unlock Deck
k this deck
24
All of the following statements about vertical analysis are true except
A) vertical analysis makes it easier to for intercompany comparisons.
B) vertical analysis is seldom performed on the income statement.
C) vertical analysis makes it easier to compare companies of different sizes.
D) vertical analysis is seldom performed on the cash flow statement.
A) vertical analysis makes it easier to for intercompany comparisons.
B) vertical analysis is seldom performed on the income statement.
C) vertical analysis makes it easier to compare companies of different sizes.
D) vertical analysis is seldom performed on the cash flow statement.
Unlock Deck
Unlock for access to all 66 flashcards in this deck.
Unlock Deck
k this deck
25
Horizontal analysis is a technique for evaluating financial statement data
A) within a period of time.
B) over a period of time.
C) on a certain date.
D) as it may appear in the future.
A) within a period of time.
B) over a period of time.
C) on a certain date.
D) as it may appear in the future.
Unlock Deck
Unlock for access to all 66 flashcards in this deck.
Unlock Deck
k this deck
26
Use the following information for questions.
In performing a vertical analysis, the percentage for cost of goods sold is
A) 4.4%.
B) 40.0%.
C) 44.4%.
D) 400.0%.
In performing a vertical analysis, the percentage for cost of goods sold is
A) 4.4%.
B) 40.0%.
C) 44.4%.
D) 400.0%.
Unlock Deck
Unlock for access to all 66 flashcards in this deck.
Unlock Deck
k this deck
27
Vertical analysis
A) is a technique for evaluating a series of financial statement data over a period of time to determine the increase (decrease) that has taken place.
B) expresses each item in a financial statement as a percent of a base amount.
C) makes it more difficult to compare different companies.
D) is also called trend analysis.
Unlock Deck
Unlock for access to all 66 flashcards in this deck.
Unlock Deck
k this deck
28
In horizontal analysis, each item is expressed as a percentage of the
A) retained earnings amount.
B) total assets amount.
C) net income amount.
D) base year amount.
A) retained earnings amount.
B) total assets amount.
C) net income amount.
D) base year amount.
Unlock Deck
Unlock for access to all 66 flashcards in this deck.
Unlock Deck
k this deck
29
A horizontal analysis is being conducted with year one as the base year. If year one equals $900, year two equals $960, and year three equals $995, the percentage of the base period for year three is
A) 89%.
B) 100%.
C) 106%.
D) 111%.
A) 89%.
B) 100%.
C) 106%.
D) 111%.
Unlock Deck
Unlock for access to all 66 flashcards in this deck.
Unlock Deck
k this deck
30
In performing a vertical analysis, the base for prepaid expenses is
A) total current assets.
B) total assets.
C) total liabilities.
D) prepaid expenses in a previous year.
A) total current assets.
B) total assets.
C) total liabilities.
D) prepaid expenses in a previous year.
Unlock Deck
Unlock for access to all 66 flashcards in this deck.
Unlock Deck
k this deck
31
Horizontal analysis showed a 25% increase in accounts receivable in 2018 over 2017. Vertical analysis showed accounts receivable declining from 7.5% to 6.8% over the same period. Given this information, what conclusion(s) may be reached?
A) The dollar amount of accounts receivable increased.
B) The dollar amount of accounts receivable decreased.
C) It cannot be determined if the dollar amount of accounts receivable increased or decreased.
D) This result is impossible. An error has been made in the calculations.
A) The dollar amount of accounts receivable increased.
B) The dollar amount of accounts receivable decreased.
C) It cannot be determined if the dollar amount of accounts receivable increased or decreased.
D) This result is impossible. An error has been made in the calculations.
Unlock Deck
Unlock for access to all 66 flashcards in this deck.
Unlock Deck
k this deck
32
Assume the following sales data for a company: What is the percentage increase in sales from 2017 to 2018?
A) 11%
B) 88%
C) 12%
D) 47%
What is the percentage increase in sales from 2017 to 2018?A) 11%
B) 88%
C) 12%
D) 47%
Unlock Deck
Unlock for access to all 66 flashcards in this deck.
Unlock Deck
k this deck
33
Vertical analysis is a technique that expresses each item in a financial statement
A) in dollars and cents.
B) as a percentage of the item in the previous year.
C) as a percentage of a base amount.
D) starting with the highest value down to the lowest value.
A) in dollars and cents.
B) as a percentage of the item in the previous year.
C) as a percentage of a base amount.
D) starting with the highest value down to the lowest value.
Unlock Deck
Unlock for access to all 66 flashcards in this deck.
Unlock Deck
k this deck
34
Use the following information for questions.
In performing a vertical analysis, the percentage for accounts receivable is
A) 0.5%.
B) 1.0%.
C) 5.0%.
D) 10.0%.
In performing a vertical analysis, the percentage for accounts receivable is
A) 0.5%.
B) 1.0%.
C) 5.0%.
D) 10.0%.
Unlock Deck
Unlock for access to all 66 flashcards in this deck.
Unlock Deck
k this deck
35
Horizontal analysis is a technique for evaluating a series of financial statement data over a period of time
A) that has been arranged from the highest number to the lowest number.
B) that has been arranged from the lowest number to the highest number.
C) to determine which items are in error.
D) to determine the amount and/or percentage increase or decrease that has taken place.
A) that has been arranged from the highest number to the lowest number.
B) that has been arranged from the lowest number to the highest number.
C) to determine which items are in error.
D) to determine the amount and/or percentage increase or decrease that has taken place.
Unlock Deck
Unlock for access to all 66 flashcards in this deck.
Unlock Deck
k this deck
36
On financial statements that include vertical analysis, which of the following is set at 100%?
A) total liabilities
B) net income
C) total assets
D) cost of goods sold
A) total liabilities
B) net income
C) total assets
D) cost of goods sold
Unlock Deck
Unlock for access to all 66 flashcards in this deck.
Unlock Deck
k this deck
37
All of the following statements about vertical analysis are true except
A) vertical analysis is also called common size analysis.
B) amounts on the income statement are expressed as a percentage of net sales.
C) vertical analysis shows the relative size of each item in the statement of financial position.
D) vertical analysis is also called trend analysis.
A) vertical analysis is also called common size analysis.
B) amounts on the income statement are expressed as a percentage of net sales.
C) vertical analysis shows the relative size of each item in the statement of financial position.
D) vertical analysis is also called trend analysis.
Unlock Deck
Unlock for access to all 66 flashcards in this deck.
Unlock Deck
k this deck
38
In vertical analysis
A) a base amount is required.
B) a base amount is optional.
C) the same base is used across all financial statements being analyzed.
D) the results of the horizontal analysis are necessary inputs for vertical analysis.
A) a base amount is required.
B) a base amount is optional.
C) the same base is used across all financial statements being analyzed.
D) the results of the horizontal analysis are necessary inputs for vertical analysis.
Unlock Deck
Unlock for access to all 66 flashcards in this deck.
Unlock Deck
k this deck
39
If, over a three-year period, sales increased by 30%, and cost of goods sold increased by 45%,
A) the sales trend is unfavourable, but the cost of goods sold trend is favourable.
B) the sales trend is favourable, but the cost of goods sold trend is unfavourable.
C) both trends are favourable.
D) both trends are unfavourable.
A) the sales trend is unfavourable, but the cost of goods sold trend is favourable.
B) the sales trend is favourable, but the cost of goods sold trend is unfavourable.
C) both trends are favourable.
D) both trends are unfavourable.
Unlock Deck
Unlock for access to all 66 flashcards in this deck.
Unlock Deck
k this deck
40
Under which of the following cases would a percentage change not be calculated?
A) The trend of the amounts is decreasing but all amounts are positive.
B) There is no amount in the base year.
C) The trend of the amounts is decreasing but all amounts are negative.
D) The trend of the amounts is increasing but all amounts are negative.
A) The trend of the amounts is decreasing but all amounts are positive.
B) There is no amount in the base year.
C) The trend of the amounts is decreasing but all amounts are negative.
D) The trend of the amounts is increasing but all amounts are negative.
Unlock Deck
Unlock for access to all 66 flashcards in this deck.
Unlock Deck
k this deck
41
Use the following information for questions.
Nelly Inc. reported net credit sales of $24,000,000 and cost of goods sold of $18,000,000 for the year. The average inventory for the year was $6,000,000.
Best Baskets Limited (BBL) had a current ratio of 0.8:1 before borrowing $50,000 from the bank with a short-term note payable. What effect did the borrowing transaction have on BBL's current ratio?
A) The ratio remained unchanged.
B) The ratio decreased.
C) The ratio increased.
D) Cannot be determined.
Unlock Deck
Unlock for access to all 66 flashcards in this deck.
Unlock Deck
k this deck
42
A high receivables turnover ratio may indicate that
A) customers are making payments quickly.
B) a large portion of the company's sales are on credit.
C) many customers are not paying their receivables.
D) the company's sales have increased.
A) customers are making payments quickly.
B) a large portion of the company's sales are on credit.
C) many customers are not paying their receivables.
D) the company's sales have increased.
Unlock Deck
Unlock for access to all 66 flashcards in this deck.
Unlock Deck
k this deck
43
Use the following information for questions.
Nelly Inc. reported net credit sales of $24,000,000 and cost of goods sold of $18,000,000 for the year. The average inventory for the year was $6,000,000.
Some of the ratios that are used to determine a company's short-term debt paying ability are
A) asset turnover, times interest earned, current ratio, and receivables turnover.
B) times interest earned, inventory turnover, current ratio, and receivables turnover.
C) times interest earned, current ratio, and inventory turnover.
D) current ratio, receivables turnover, and inventory turnover.
Unlock Deck
Unlock for access to all 66 flashcards in this deck.
Unlock Deck
k this deck
44
Use the following information for questions.
Nelly Inc. reported net credit sales of $24,000,000 and cost of goods sold of $18,000,000 for the year. The average inventory for the year was $6,000,000.
A supplier to a company would be most interested in the
A) asset turnover ratio.
B) profit margin ratio.
C) current ratio.
D) free cash flow.
Nelly Inc. reported net credit sales of $24,000,000 and cost of goods sold of $18,000,000 for the year. The average inventory for the year was $6,000,000.
A supplier to a company would be most interested in the
A) asset turnover ratio.
B) profit margin ratio.
C) current ratio.
D) free cash flow.
Unlock Deck
Unlock for access to all 66 flashcards in this deck.
Unlock Deck
k this deck
45
Use the following information for questions.
Nelly Inc. reported net credit sales of $24,000,000 and cost of goods sold of $18,000,000 for the year. The average inventory for the year was $6,000,000.
If a company has a current ratio of 1.3:1, what effects will the borrowing of cash by short-term debt and collection of accounts receivable have on the ratio?
Unlock Deck
Unlock for access to all 66 flashcards in this deck.
Unlock Deck
k this deck
46
Use the following information for questions.
Nelly Inc. reported net credit sales of $24,000,000 and cost of goods sold of $18,000,000 for the year. The average inventory for the year was $6,000,000.
The days in inventory during the year was
A) 15 days.
B) 11 days.
C) 91 days.
D) 122 days.
Nelly Inc. reported net credit sales of $24,000,000 and cost of goods sold of $18,000,000 for the year. The average inventory for the year was $6,000,000.
The days in inventory during the year was
A) 15 days.
B) 11 days.
C) 91 days.
D) 122 days.
Unlock Deck
Unlock for access to all 66 flashcards in this deck.
Unlock Deck
k this deck
47
The current ratio is
A) calculated by dividing current liabilities by current assets.
B) used to evaluate a company's liquidity and short-term debt paying ability.
C) used to evaluate a company's solvency and long-term debt paying ability.
D) calculated by subtracting current liabilities from current assets.
A) calculated by dividing current liabilities by current assets.
B) used to evaluate a company's liquidity and short-term debt paying ability.
C) used to evaluate a company's solvency and long-term debt paying ability.
D) calculated by subtracting current liabilities from current assets.
Unlock Deck
Unlock for access to all 66 flashcards in this deck.
Unlock Deck
k this deck
48
Use the following information for questions.
Nelly Inc. reported net credit sales of $24,000,000 and cost of goods sold of $18,000,000 for the year. The average inventory for the year was $6,000,000.
A weakness of the current ratio is
A) the difficulty of the calculation.
B) that it doesn't take into account the composition of the current assets.
C) that it is rarely used by sophisticated analysts.
D) that it can be expressed as a percentage, as a rate, or as a proportion.
Unlock Deck
Unlock for access to all 66 flashcards in this deck.
Unlock Deck
k this deck
49
A common measure of liquidity is
A) return on assets.
B) receivables turnover.
C) profit margin.
D) debt to total assets.
A) return on assets.
B) receivables turnover.
C) profit margin.
D) debt to total assets.
Unlock Deck
Unlock for access to all 66 flashcards in this deck.
Unlock Deck
k this deck
50
Horizontal analysis
A) is also called trend analysis.
B) can be carried out on statement of financial position data but not on income statement data.
C) is a technique for evaluating a financial statement item in the current year with other items in the current year.
D) uses the base year as the most current year being examined.
Unlock Deck
Unlock for access to all 66 flashcards in this deck.
Unlock Deck
k this deck
51
Use the following information for questions.
Nelly Inc. reported net credit sales of $24,000,000 and cost of goods sold of $18,000,000 for the year. The average inventory for the year was $6,000,000.
Which one of the following would not be considered a liquidity ratio?
A) current ratio
B) inventory turnover ratio
C) receivables turnover ratio
D) return on assets ratio
Unlock Deck
Unlock for access to all 66 flashcards in this deck.
Unlock Deck
k this deck
52
The current ratio is a
A) liquidity ratio.
B) profitability ratio.
C) solvency ratio.
D) cash flow ratio.
A) liquidity ratio.
B) profitability ratio.
C) solvency ratio.
D) cash flow ratio.
Unlock Deck
Unlock for access to all 66 flashcards in this deck.
Unlock Deck
k this deck
53
An inventory turnover ratio
A) measures the number of times, on average, the inventory was sold during the period.
B) is a measure of solvency that focuses on efficient use of inventory.
C) that is significantly lower than the industry average usually indicates difficulty with selling that inventory and the likelihood of incurring lower than average storage costs.
D) that is significantly higher than the industry average may indicate that a company is maintaining inventory levels that are too high.
Unlock Deck
Unlock for access to all 66 flashcards in this deck.
Unlock Deck
k this deck
54
A company with $60,000 in current assets and $40,000 in current liabilities pays a $1,000 current liability. As a result of this transaction, the current ratio and working capital will
A) both decrease.
B) both increase.
C) increase and remain the same, respectively.
D) remain the same and decrease, respectively.
A) both decrease.
B) both increase.
C) increase and remain the same, respectively.
D) remain the same and decrease, respectively.
Unlock Deck
Unlock for access to all 66 flashcards in this deck.
Unlock Deck
k this deck
55
Handles Corp. reported net credit sales of $6,500,000 and cost of goods sold of $3,400,000 for the year. The Accounts Receivable balances at the beginning and end of the year were $525,000 and $575,000, respectively. The receivables turnover ratio was
A) 6.2 times.
B) 11.3 times.
C) 11.8 times.
D) 5.9 times.
A) 6.2 times.
B) 11.3 times.
C) 11.8 times.
D) 5.9 times.
Unlock Deck
Unlock for access to all 66 flashcards in this deck.
Unlock Deck
k this deck
56
Short-term creditors are usually most interested in assessing
A) solvency.
B) liquidity.
C) marketability.
D) profitability.
A) solvency.
B) liquidity.
C) marketability.
D) profitability.
Unlock Deck
Unlock for access to all 66 flashcards in this deck.
Unlock Deck
k this deck
57
The receivables turnover and inventory turnover ratios are used to analyze
A) solvency.
B) profitability.
C) liquidity.
D) leverage.
A) solvency.
B) profitability.
C) liquidity.
D) leverage.
Unlock Deck
Unlock for access to all 66 flashcards in this deck.
Unlock Deck
k this deck
58
Use the following information for questions.
Nelly Inc. reported net credit sales of $24,000,000 and cost of goods sold of $18,000,000 for the year. The average inventory for the year was $6,000,000.
A liquidity ratio measures the
A) net income or operating success of a company over a period of time.
B) ability of the company to survive over a long period of time.
C) short-term ability of the company to pay its maturing obligations and to meet unexpected needs for cash.
D) ability of a company to raise capital.
Unlock Deck
Unlock for access to all 66 flashcards in this deck.
Unlock Deck
k this deck
59
Afrikana Inc. had a balance in the Accounts Receivable account of $820,000 at the beginning of the year and a balance of $880,000 at the end of the year. Net credit sales during the year were $5,920,000. The average collection period of the receivables was
A) 45 days.
B) 52 days.
C) 54 days.
D) 104 days.
A) 45 days.
B) 52 days.
C) 54 days.
D) 104 days.
Unlock Deck
Unlock for access to all 66 flashcards in this deck.
Unlock Deck
k this deck
60
Use the following information for questions.
Nelly Inc. reported net credit sales of $24,000,000 and cost of goods sold of $18,000,000 for the year. The average inventory for the year was $6,000,000.
The inventory turnover ratio for the year was
A) 3.0 times.
B) 33.3 times.
C) 4.0 times.
D) 25.0 times.
Nelly Inc. reported net credit sales of $24,000,000 and cost of goods sold of $18,000,000 for the year. The average inventory for the year was $6,000,000.
The inventory turnover ratio for the year was
A) 3.0 times.
B) 33.3 times.
C) 4.0 times.
D) 25.0 times.
Unlock Deck
Unlock for access to all 66 flashcards in this deck.
Unlock Deck
k this deck
61
The following ratios have been calculated for Rosco and Ramsey Limited for 2018: Financial statement information for 2018 for Rosco and Ramsey Limited with missing information follows: InstructionsUsing the above ratios and information from Rosco and Ramsey Limited's financial statements, fill in the missing information on the financial statements. Follow the sequence indicated. Show calculations that support your answers.
Financial statement information for 2018 for Rosco and Ramsey Limited with missing information follows: InstructionsUsing the above ratios and information from Rosco and Ramsey Limited's financial statements, fill in the missing information on the financial statements. Follow the sequence indicated. Show calculations that support your answers. Unlock Deck
Unlock for access to all 66 flashcards in this deck.
Unlock Deck
k this deck
62
Comparative information taken from Water Works Corporation's financial statements is shown below: InstructionsUsing horizontal analysis, calculate the percentage change from 2017 to 2018.
InstructionsUsing horizontal analysis, calculate the percentage change from 2017 to 2018. Unlock Deck
Unlock for access to all 66 flashcards in this deck.
Unlock Deck
k this deck
63
The following items were taken from the financial statements of McGonigal Inc. over a four-year period: InstructionsUsing horizontal analysis and 2013 as the base year, calculate the horizontal percentages of a base period for net sales, cost of goods sold, and gross profit. Explain whether the trends are favourable or unfavourable for each item.
InstructionsUsing horizontal analysis and 2013 as the base year, calculate the horizontal percentages of a base period for net sales, cost of goods sold, and gross profit. Explain whether the trends are favourable or unfavourable for each item. Unlock Deck
Unlock for access to all 66 flashcards in this deck.
Unlock Deck
k this deck
64
Selected data from McAllister Corp. are presented below: InstructionsCalculate all of the profitability ratios that can be determined from the above information.
InstructionsCalculate all of the profitability ratios that can be determined from the above information. Unlock Deck
Unlock for access to all 66 flashcards in this deck.
Unlock Deck
k this deck
65
The following items were taken from the financial statements of Nesci Ltd. over a three-year period: InstructionsUsing horizontal analysis and 2016 as the base year, calculate the horizontal percentages of a base period for net sales, cost of goods sold, and gross profit. Explain whether the trends are favourable or unfavourable for each item.
InstructionsUsing horizontal analysis and 2016 as the base year, calculate the horizontal percentages of a base period for net sales, cost of goods sold, and gross profit. Explain whether the trends are favourable or unfavourable for each item. Unlock Deck
Unlock for access to all 66 flashcards in this deck.
Unlock Deck
k this deck
66
Presented below are liquidity and solvency ratios for Carmelo Industries, along with industry averages: InstructionsAnalyze the company's liquidity and solvency using the information presented. Present a conclusion on the liquidity and solvency, supported by your analysis.
InstructionsAnalyze the company's liquidity and solvency using the information presented. Present a conclusion on the liquidity and solvency, supported by your analysis. Unlock Deck
Unlock for access to all 66 flashcards in this deck.
Unlock Deck
k this deck
Unlock Deck
Unlock for access to all 66 flashcards in this deck.


