Deck 4: Analysis of Financial Statements
Full screen (f)
Question
Question
Question
Question
Question
Question
Question
Question
Question
Question
Question
Question
Question
Question
Question
Question
Question
Question
Question
Question
Question
Question
Question
Question
Question
Table 4 -1. Income Statement
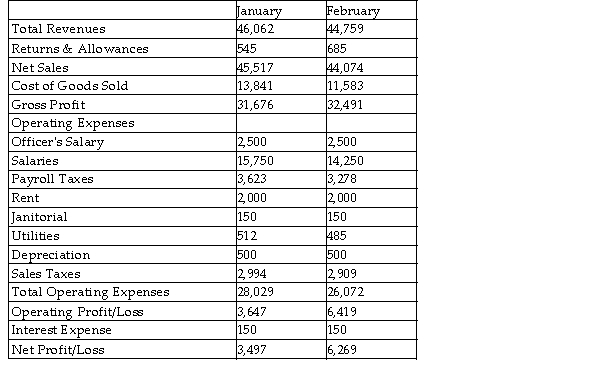
Refer to Table 4 -1. Using a vertical analysis of January data, Cost of Goods were approximately percent.
A) 30.05
B) 0.3041
C) 35.65
D) 30.41
Refer to Table 4 -1. Using a vertical analysis of January data, Cost of Goods were approximately percent.
A) 30.05
B) 0.3041
C) 35.65
D) 30.41
Question
Question
Table 4 -1. Income Statement
Refer to Table 4 -1. Between January and February, the items that did not change in dollar value included all of the following EXCEPT
A) Payroll Taxes.
B) Depreciation.
C) Rent.
D) Janitorial.
E) Officer's Salary.
Refer to Table 4 -1. Between January and February, the items that did not change in dollar value included all of the following EXCEPT
A) Payroll Taxes.
B) Depreciation.
C) Rent.
D) Janitorial.
E) Officer's Salary.
Question
Question
Table 4 -1. Income Statement
The U.S. Government raised the minimum wage from $4.75 to $5.25 between 1996 and 1997. What was the percentage change in the minimum wage?
A) 9.52
B) -9.52
C) 10.53
D) -10.53
The U.S. Government raised the minimum wage from $4.75 to $5.25 between 1996 and 1997. What was the percentage change in the minimum wage?
A) 9.52
B) -9.52
C) 10.53
D) -10.53
Question
Table 4 -1. Income Statement
Refer to Table 4 -1. Using a vertical analysis of January data, Payroll Taxes were approximately percent
A) 0.0796
B) 0.0737
C) 7.96
D) 7.37
Refer to Table 4 -1. Using a vertical analysis of January data, Payroll Taxes were approximately percent
A) 0.0796
B) 0.0737
C) 7.96
D) 7.37
Question
Table 4 -1. Income Statement
Refer to Table 4 -1. Using horizontal analysis, Payroll Taxes _ percent. _ by approximately _
A) decreased; 9.52
B) increased; 10.52
C) decreased; 10.52
D) increased; 9.52
Refer to Table 4 -1. Using horizontal analysis, Payroll Taxes _ percent. _ by approximately _
A) decreased; 9.52
B) increased; 10.52
C) decreased; 10.52
D) increased; 9.52
Question
Question
Question
Question
Table 4 -1. Income Statement
In 2003 the Handy Yogurt shop had $267,386 in Gross Revenues; in 2004, they had $215,398. What is the percentage change in sales?
A) -24.14%
B) 24.14%
C) 19.44%
D) -19.44%
In 2003 the Handy Yogurt shop had $267,386 in Gross Revenues; in 2004, they had $215,398. What is the percentage change in sales?
A) -24.14%
B) 24.14%
C) 19.44%
D) -19.44%
Question
Table 4 -1. Income Statement
Last year Sam earned $25,000 and received no bonus. This year he earned the same amount but received a $2,000 bonus. What was the percentage change in his annual earnings?
A) 7.41
B) 8.00
C) -92.00
D) -11.20
Last year Sam earned $25,000 and received no bonus. This year he earned the same amount but received a $2,000 bonus. What was the percentage change in his annual earnings?
A) 7.41
B) 8.00
C) -92.00
D) -11.20
Question
Table 4 -1. Income Statement
In 2005, the Handy Yogurt shop had $345,265 in Gross Revenues; in 2006, they had $357,388. What is the percentage change in sales?
A) -3.39%
B) 3.39%
C) -3.51%
D) 3.51%
In 2005, the Handy Yogurt shop had $345,265 in Gross Revenues; in 2006, they had $357,388. What is the percentage change in sales?
A) -3.39%
B) 3.39%
C) -3.51%
D) 3.51%
Question
Question
Question
Table 4 -1. Income Statement
Refer to Table 4 -1. Using horizontal analysis, Net Profit percent. _ by approximately
A) decreased; 44.22
B) increased; 79.27
C) decreased; 79.27
D) increased; 44.22
Refer to Table 4 -1. Using horizontal analysis, Net Profit percent. _ by approximately
A) decreased; 44.22
B) increased; 79.27
C) decreased; 79.27
D) increased; 44.22
Question
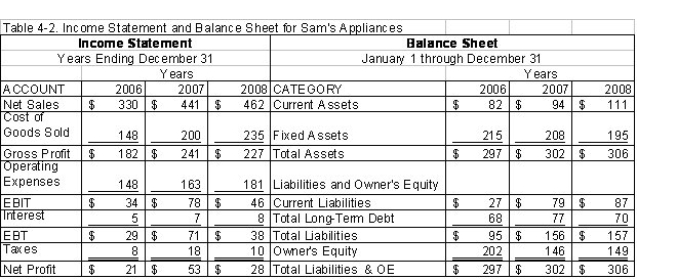
Refer to Table 4 -2. The Total Asset Turnover ratio for 2007 was approximately
A) 1.44.
B) 1.49.
C) 1.54.
D) 1.47.
Question
Question
Refer to Table 4 -2. The current ratio for this company in 2007 was approximately
A) 1.28.
B) 1.94.
C) 1.19.
D) 1.24.
Question
Refer to Table 4 -2. The Fixed Asset Turnover ratio for 2008 was approximately
A) 2.37.
B) 2.29.
C) 1.52.
D) 2.22.
Question
Question
Refer to Table 4 -2. The Debt to Total Assets ratio for 2008 was approximately
A) 0.51.
B) 0.36.
C) 1.95.
D) 0.71.
Question
Refer to Table 4 -2. The current ratio for this company in 2008 was approximately
A) 1.19.
B) 1.94.
C) 1.24.
D) 1.28.
Question
Refer to Table 4 -2. The Fixed Asset Turnover ratio for 2007 was approximately
A) 2.12.
B) 2.09.
C) 2.37.
D) 2.26.
Question
Question
Question
Refer to Table 4 -2. The Debt to Equity ratio for 2007 was approximately
A) 0.93.
B) 0.54.
C) 2.07.
D) 1.07.
Question
Refer to Table 4 -2. The percentage change in sales from 2007 to 2008 was approximately
A) 4.54.
B) -4.76.
C) -4.54.
D) 4.76.
E) 45.4.
Question
Table 4 -1. Income Statement
are used to measure the ability of a firm to meet its short -term creditor's claims.
A) Activity ratios
B) Leverage ratios
C) Liquidity ratios
D) Market ratios
E) Profitability ratios
are used to measure the ability of a firm to meet its short -term creditor's claims.
A) Activity ratios
B) Leverage ratios
C) Liquidity ratios
D) Market ratios
E) Profitability ratios
Question
Question
Refer to Table 4 -2. The percentage change in fixed assets between 2007 and 2008 was approximately
A) 6.25.
B) -6.25.
C) -6.66.
D) 6.66.
Question
Refer to Table 4 -2. The Gross Profit Margin ratio for 2008 was approximately
A) 2.04.
B) 2.11.
C) 0.49.
D) 0.47.
Question
Refer to Table 4 -2. The Gross Profit Margin ratio for 2007 was approximately
A) 0.55.
B) 0.44.
C) 0.53.
D) 0.45.
Question
Refer to Table 4 -2. The Debt to Total Assets ratio for 2007 was approximately
A) 0.84.
B) 0.52.
C) 1.19.
D) 1.94.
Question
Refer to Table 4 -2. The Total Asset Turnover ratio for 2008 was approximately
A) 4.16.
B) 1.52.
C) 2.37.
D) 2.22.
Question
Refer to Table 4 -2. The Debt to Equity ratio for 2008 was approximately
A) 2.05.
B) 1.05.
C) 0.51.
D) 1.95.
E) 0.95.
Question
Question
Question
Question
Question
Carl's Toy Factory had the following items listed on its balance sheet. Cash, 1,590; Accounts Receivable, 5,746; Accounts Payable, 9,563; Inventory, 7,879; Equipment, 35,743; Land, 50,000; Buildings, 135,487; Mortgage, 125,276. Based on this information what was Carl's current ratio?
A) 2.14
B) 1.37
C) 1.59
D) 0.77
Question
Question
In 2004, James had Cost of Goods of 358,358; in 2005, they were 365,069. On the last day 2004 his Inventory was 45,675, and on the last day of 2005 it was 51,559. What is the Inventory Turnover for James' Television Sales Shop for 2005?
A) 7.51
B) 7.44
C) 7.34
D) 7.37
Question
Question
Carl's Toy Factory had the following items listed on its balance sheet. Cash, 1,590; Accounts Receivable, 5,746; Accounts Payable, 9,563; Inventory, 7,879; Equipment, 35,743; Land, 50,000; Buildings, 135,487; Mortgage, 125,276. Based on this information what was Carl's quick ratio?
A) 1.59
B) 2.14
C) 0.77
D) 1.37
Question
Question
Question
In 2005, Joan had Cost of Goods of 58,358; in 2006, they were 65,069. On the last day 2005 her Inventory was 675, and on the last day of 2006 it was 1,559. What is the Inventory Turnover for Joan's Coffee Shop for 2006?
A) 58.25
B) 55.25
C) 41.74
D) 52.25
Question
Question
Question
Question
Question
In 2005, The Best Donut Shop had cash sales of 83,684 and total sales of 176,413. Accounts Receivable were 3,275. What was Accounts Receivable Turnover?
A) 28.31
B) 25.55
C) 53.37
D) 39.71
Question
Question

Unlock Deck
Sign up to unlock the cards in this deck!
Unlock Deck
Unlock Deck
1/79
Play
Full screen (f)
Deck 4: Analysis of Financial Statements
1
The current ratio is calculated by dividing current assets by current liabilities.
True
2
There is more than one way to calculate the ROE.
True
3
The current ratio is calculated by dividing current assets minus inventory by current liabilities.
False
4
Vertical analysis of an income statement is obtained by using Net Profit as a constant and dividing every figure on the income statement by Net Profit.
Unlock Deck
Unlock for access to all 79 flashcards in this deck.
Unlock Deck
k this deck
5
Market ratios determine how well a company is marketing its products.
Unlock Deck
Unlock for access to all 79 flashcards in this deck.
Unlock Deck
k this deck
6
Liquidity ratios measure the ability of a firm to meet its long -term obligations.
Unlock Deck
Unlock for access to all 79 flashcards in this deck.
Unlock Deck
k this deck
7
Vertical analysis of a balance sheet is obtained by using Total Liabilities as a constant and dividing every figure on the balance sheet by Total Liabilities.
Unlock Deck
Unlock for access to all 79 flashcards in this deck.
Unlock Deck
k this deck
8
As long as you choose your method of financial analysis carefully, any single method will provide you with enough information to completely evaluate your firm
Unlock Deck
Unlock for access to all 79 flashcards in this deck.
Unlock Deck
k this deck
9
Horizontal Analysis is obtained by determining the dollar value change in an account from a base period to a successive time period.
Unlock Deck
Unlock for access to all 79 flashcards in this deck.
Unlock Deck
k this deck
10
Operating cash flow per share is a much better predictor of company stability than earnings per share.
Unlock Deck
Unlock for access to all 79 flashcards in this deck.
Unlock Deck
k this deck
11
Vertical analysis of an income statement is obtained by using Net Sales as a constant and dividing every figure on the income statement by Net Sales.
Unlock Deck
Unlock for access to all 79 flashcards in this deck.
Unlock Deck
k this deck
12
It is advantageous for managers to increase debt financing and exhibit an increased ROE.
Unlock Deck
Unlock for access to all 79 flashcards in this deck.
Unlock Deck
k this deck
13
A ratio is a relationship between two numbers, expressed as a fraction.
Unlock Deck
Unlock for access to all 79 flashcards in this deck.
Unlock Deck
k this deck
14
Vertical analysis of a balance sheet is obtained by using Total Assets as a constant and dividing every figure on the balance sheet by Total Assets.
Unlock Deck
Unlock for access to all 79 flashcards in this deck.
Unlock Deck
k this deck
15
If a company has no debt financing, its return on equity equals its return on assets.
Unlock Deck
Unlock for access to all 79 flashcards in this deck.
Unlock Deck
k this deck
16
A single ratio always provides us with meaningful information.
Unlock Deck
Unlock for access to all 79 flashcards in this deck.
Unlock Deck
k this deck
17
Horizontal Analysis is obtained by determining the percentage change in an account from a base period to a successive time period.
Unlock Deck
Unlock for access to all 79 flashcards in this deck.
Unlock Deck
k this deck
18
Market ratios indicate what price investors are willing to pay for ownership in the company.
Unlock Deck
Unlock for access to all 79 flashcards in this deck.
Unlock Deck
k this deck
19
Profitability ratios determine how well a firm is using its assets and sales revenue to generate a positive return for its owners.
Unlock Deck
Unlock for access to all 79 flashcards in this deck.
Unlock Deck
k this deck
20
As the debt to asset ratio increases, the ROE decreases.
Unlock Deck
Unlock for access to all 79 flashcards in this deck.
Unlock Deck
k this deck
21
Too much credit sales may overstate the earnings of a company.
Unlock Deck
Unlock for access to all 79 flashcards in this deck.
Unlock Deck
k this deck
22
If a company has a 70 percent debt to total assets ratio, approximately 70 cents of every dollar of assets is owed to the company creditors.
Unlock Deck
Unlock for access to all 79 flashcards in this deck.
Unlock Deck
k this deck
23
Leverage ratios measure the firm's ability to use its own money to fund operations.
Unlock Deck
Unlock for access to all 79 flashcards in this deck.
Unlock Deck
k this deck
24
The higher the accounts receivable turnover, the lower the average collection period.
Unlock Deck
Unlock for access to all 79 flashcards in this deck.
Unlock Deck
k this deck
25
Table 4 -1. Income Statement
Refer to Table 4 -1. Using a vertical analysis of January data, Cost of Goods were approximately percent.
A) 30.05
B) 0.3041
C) 35.65
D) 30.41
Refer to Table 4 -1. Using a vertical analysis of January data, Cost of Goods were approximately percent.
A) 30.05
B) 0.3041
C) 35.65
D) 30.41
Unlock Deck
Unlock for access to all 79 flashcards in this deck.
Unlock Deck
k this deck
26
When comparing income statement items to balance sheet items in a single ratio, we use the average of the items on the balance sheet.
Unlock Deck
Unlock for access to all 79 flashcards in this deck.
Unlock Deck
k this deck
27
Table 4 -1. Income Statement
Refer to Table 4 -1. Between January and February, the items that did not change in dollar value included all of the following EXCEPT
A) Payroll Taxes.
B) Depreciation.
C) Rent.
D) Janitorial.
E) Officer's Salary.
Refer to Table 4 -1. Between January and February, the items that did not change in dollar value included all of the following EXCEPT
A) Payroll Taxes.
B) Depreciation.
C) Rent.
D) Janitorial.
E) Officer's Salary.
Unlock Deck
Unlock for access to all 79 flashcards in this deck.
Unlock Deck
k this deck
28
The operating cash flow per share ratio uses information from the statement of cash flows and the income statement.
Unlock Deck
Unlock for access to all 79 flashcards in this deck.
Unlock Deck
k this deck
29
Table 4 -1. Income Statement
The U.S. Government raised the minimum wage from $4.75 to $5.25 between 1996 and 1997. What was the percentage change in the minimum wage?
A) 9.52
B) -9.52
C) 10.53
D) -10.53
The U.S. Government raised the minimum wage from $4.75 to $5.25 between 1996 and 1997. What was the percentage change in the minimum wage?
A) 9.52
B) -9.52
C) 10.53
D) -10.53
Unlock Deck
Unlock for access to all 79 flashcards in this deck.
Unlock Deck
k this deck
30
Table 4 -1. Income Statement
Refer to Table 4 -1. Using a vertical analysis of January data, Payroll Taxes were approximately percent
A) 0.0796
B) 0.0737
C) 7.96
D) 7.37
Refer to Table 4 -1. Using a vertical analysis of January data, Payroll Taxes were approximately percent
A) 0.0796
B) 0.0737
C) 7.96
D) 7.37
Unlock Deck
Unlock for access to all 79 flashcards in this deck.
Unlock Deck
k this deck
31
Table 4 -1. Income Statement
Refer to Table 4 -1. Using horizontal analysis, Payroll Taxes _ percent. _ by approximately _
A) decreased; 9.52
B) increased; 10.52
C) decreased; 10.52
D) increased; 9.52
Refer to Table 4 -1. Using horizontal analysis, Payroll Taxes _ percent. _ by approximately _
A) decreased; 9.52
B) increased; 10.52
C) decreased; 10.52
D) increased; 9.52
Unlock Deck
Unlock for access to all 79 flashcards in this deck.
Unlock Deck
k this deck
32
When comparing income statement items to balance sheet items in a single ratio, we use the average of the items on the income statement.
Unlock Deck
Unlock for access to all 79 flashcards in this deck.
Unlock Deck
k this deck
33
If the total asset turnover ratio is less than one, then the average total assets are not generating enough sales.
Unlock Deck
Unlock for access to all 79 flashcards in this deck.
Unlock Deck
k this deck
34
Methods of analyzing financial statements include
A) horizontal analysis.
B) vertical analysis.
C) ratio analysis.
D) all of the above.
E) only A and C above.
A) horizontal analysis.
B) vertical analysis.
C) ratio analysis.
D) all of the above.
E) only A and C above.
Unlock Deck
Unlock for access to all 79 flashcards in this deck.
Unlock Deck
k this deck
35
Table 4 -1. Income Statement
In 2003 the Handy Yogurt shop had $267,386 in Gross Revenues; in 2004, they had $215,398. What is the percentage change in sales?
A) -24.14%
B) 24.14%
C) 19.44%
D) -19.44%
In 2003 the Handy Yogurt shop had $267,386 in Gross Revenues; in 2004, they had $215,398. What is the percentage change in sales?
A) -24.14%
B) 24.14%
C) 19.44%
D) -19.44%
Unlock Deck
Unlock for access to all 79 flashcards in this deck.
Unlock Deck
k this deck
36
Table 4 -1. Income Statement
Last year Sam earned $25,000 and received no bonus. This year he earned the same amount but received a $2,000 bonus. What was the percentage change in his annual earnings?
A) 7.41
B) 8.00
C) -92.00
D) -11.20
Last year Sam earned $25,000 and received no bonus. This year he earned the same amount but received a $2,000 bonus. What was the percentage change in his annual earnings?
A) 7.41
B) 8.00
C) -92.00
D) -11.20
Unlock Deck
Unlock for access to all 79 flashcards in this deck.
Unlock Deck
k this deck
37
Table 4 -1. Income Statement
In 2005, the Handy Yogurt shop had $345,265 in Gross Revenues; in 2006, they had $357,388. What is the percentage change in sales?
A) -3.39%
B) 3.39%
C) -3.51%
D) 3.51%
In 2005, the Handy Yogurt shop had $345,265 in Gross Revenues; in 2006, they had $357,388. What is the percentage change in sales?
A) -3.39%
B) 3.39%
C) -3.51%
D) 3.51%
Unlock Deck
Unlock for access to all 79 flashcards in this deck.
Unlock Deck
k this deck
38
Activity ratios indicate how efficiently a business is using its assets.
Unlock Deck
Unlock for access to all 79 flashcards in this deck.
Unlock Deck
k this deck
39
We can obtain the financial reports of publicly held corporations by
A) reading trade journals.
B) calling the company directly.
C) using published data in sources such as Value Line.
D) using EDGAR on the Internet.
E) all of the above.
A) reading trade journals.
B) calling the company directly.
C) using published data in sources such as Value Line.
D) using EDGAR on the Internet.
E) all of the above.
Unlock Deck
Unlock for access to all 79 flashcards in this deck.
Unlock Deck
k this deck
40
Table 4 -1. Income Statement
Refer to Table 4 -1. Using horizontal analysis, Net Profit percent. _ by approximately
A) decreased; 44.22
B) increased; 79.27
C) decreased; 79.27
D) increased; 44.22
Refer to Table 4 -1. Using horizontal analysis, Net Profit percent. _ by approximately
A) decreased; 44.22
B) increased; 79.27
C) decreased; 79.27
D) increased; 44.22
Unlock Deck
Unlock for access to all 79 flashcards in this deck.
Unlock Deck
k this deck
41
Refer to Table 4 -2. The Total Asset Turnover ratio for 2007 was approximately
A) 1.44.
B) 1.49.
C) 1.54.
D) 1.47.
Unlock Deck
Unlock for access to all 79 flashcards in this deck.
Unlock Deck
k this deck
42
indicate what price investors are willing to pay for ownership in the company.
A) Activity ratios
B) Leverage ratios
C) Liquidity ratios
D) Market ratios
E) Profitability ratios
A) Activity ratios
B) Leverage ratios
C) Liquidity ratios
D) Market ratios
E) Profitability ratios
Unlock Deck
Unlock for access to all 79 flashcards in this deck.
Unlock Deck
k this deck
43
Refer to Table 4 -2. The current ratio for this company in 2007 was approximately
A) 1.28.
B) 1.94.
C) 1.19.
D) 1.24.
Unlock Deck
Unlock for access to all 79 flashcards in this deck.
Unlock Deck
k this deck
44
Refer to Table 4 -2. The Fixed Asset Turnover ratio for 2008 was approximately
A) 2.37.
B) 2.29.
C) 1.52.
D) 2.22.
Unlock Deck
Unlock for access to all 79 flashcards in this deck.
Unlock Deck
k this deck
45
are used to determine how well a company is managing its assets.
A) Activity ratios
B) Leverage ratios
C) Liquidity ratios
D) Market ratios
E) Profitability ratios
A) Activity ratios
B) Leverage ratios
C) Liquidity ratios
D) Market ratios
E) Profitability ratios
Unlock Deck
Unlock for access to all 79 flashcards in this deck.
Unlock Deck
k this deck
46
Refer to Table 4 -2. The Debt to Total Assets ratio for 2008 was approximately
A) 0.51.
B) 0.36.
C) 1.95.
D) 0.71.
Unlock Deck
Unlock for access to all 79 flashcards in this deck.
Unlock Deck
k this deck
47
Refer to Table 4 -2. The current ratio for this company in 2008 was approximately
A) 1.19.
B) 1.94.
C) 1.24.
D) 1.28.
Unlock Deck
Unlock for access to all 79 flashcards in this deck.
Unlock Deck
k this deck
48
Refer to Table 4 -2. The Fixed Asset Turnover ratio for 2007 was approximately
A) 2.12.
B) 2.09.
C) 2.37.
D) 2.26.
Unlock Deck
Unlock for access to all 79 flashcards in this deck.
Unlock Deck
k this deck
49
determine how well the firm is using its assets and sales revenue to generate a positive return for its owners.
A) Activity ratios
B) Leverage ratios
C) Liquidity ratios
D) Market ratios
E) Profitability ratios
A) Activity ratios
B) Leverage ratios
C) Liquidity ratios
D) Market ratios
E) Profitability ratios
Unlock Deck
Unlock for access to all 79 flashcards in this deck.
Unlock Deck
k this deck
50
Liquidity ratios include the
A) A and B above.
B) A and C above.
C) current ratio.
D) inventory turnover ratio.
E) quick ratio.
A) A and B above.
B) A and C above.
C) current ratio.
D) inventory turnover ratio.
E) quick ratio.
Unlock Deck
Unlock for access to all 79 flashcards in this deck.
Unlock Deck
k this deck
51
Refer to Table 4 -2. The Debt to Equity ratio for 2007 was approximately
A) 0.93.
B) 0.54.
C) 2.07.
D) 1.07.
Unlock Deck
Unlock for access to all 79 flashcards in this deck.
Unlock Deck
k this deck
52
Refer to Table 4 -2. The percentage change in sales from 2007 to 2008 was approximately
A) 4.54.
B) -4.76.
C) -4.54.
D) 4.76.
E) 45.4.
Unlock Deck
Unlock for access to all 79 flashcards in this deck.
Unlock Deck
k this deck
53
Table 4 -1. Income Statement
are used to measure the ability of a firm to meet its short -term creditor's claims.
A) Activity ratios
B) Leverage ratios
C) Liquidity ratios
D) Market ratios
E) Profitability ratios
are used to measure the ability of a firm to meet its short -term creditor's claims.
A) Activity ratios
B) Leverage ratios
C) Liquidity ratios
D) Market ratios
E) Profitability ratios
Unlock Deck
Unlock for access to all 79 flashcards in this deck.
Unlock Deck
k this deck
54
indicate how much of a company's net worth and asset commitment are being financed with debt.
A) Activity ratios
B) Leverage ratios
C) Liquidity ratios
D) Market ratios
E) Profitability ratios
A) Activity ratios
B) Leverage ratios
C) Liquidity ratios
D) Market ratios
E) Profitability ratios
Unlock Deck
Unlock for access to all 79 flashcards in this deck.
Unlock Deck
k this deck
55
Refer to Table 4 -2. The percentage change in fixed assets between 2007 and 2008 was approximately
A) 6.25.
B) -6.25.
C) -6.66.
D) 6.66.
Unlock Deck
Unlock for access to all 79 flashcards in this deck.
Unlock Deck
k this deck
56
Refer to Table 4 -2. The Gross Profit Margin ratio for 2008 was approximately
A) 2.04.
B) 2.11.
C) 0.49.
D) 0.47.
Unlock Deck
Unlock for access to all 79 flashcards in this deck.
Unlock Deck
k this deck
57
Refer to Table 4 -2. The Gross Profit Margin ratio for 2007 was approximately
A) 0.55.
B) 0.44.
C) 0.53.
D) 0.45.
Unlock Deck
Unlock for access to all 79 flashcards in this deck.
Unlock Deck
k this deck
58
Refer to Table 4 -2. The Debt to Total Assets ratio for 2007 was approximately
A) 0.84.
B) 0.52.
C) 1.19.
D) 1.94.
Unlock Deck
Unlock for access to all 79 flashcards in this deck.
Unlock Deck
k this deck
59
Refer to Table 4 -2. The Total Asset Turnover ratio for 2008 was approximately
A) 4.16.
B) 1.52.
C) 2.37.
D) 2.22.
Unlock Deck
Unlock for access to all 79 flashcards in this deck.
Unlock Deck
k this deck
60
Refer to Table 4 -2. The Debt to Equity ratio for 2008 was approximately
A) 2.05.
B) 1.05.
C) 0.51.
D) 1.95.
E) 0.95.
Unlock Deck
Unlock for access to all 79 flashcards in this deck.
Unlock Deck
k this deck
61
Which of the following formulas is used to determine Fixed Asset Turnover?
A) fixed assets/gross sales
B) cost of goods sold/fixed assets
C) net sales/fixed assets
D) fixed assets/net sales
E) gross sales/fixed assets
A) fixed assets/gross sales
B) cost of goods sold/fixed assets
C) net sales/fixed assets
D) fixed assets/net sales
E) gross sales/fixed assets
Unlock Deck
Unlock for access to all 79 flashcards in this deck.
Unlock Deck
k this deck
62
The balance sheet for Jim's Hardware has the following items listed. Current Liabilities, $25,345; Long -Term Debt, $100,000; Total Liabilities, $125,345; Total Assets, $325,490. What is the Owner's Equity for this company?
A) $200,145
B) $25,345
C) $225,490
D) Cannot calculate with the information provided.
A) $200,145
B) $25,345
C) $225,490
D) Cannot calculate with the information provided.
Unlock Deck
Unlock for access to all 79 flashcards in this deck.
Unlock Deck
k this deck
63
The Handy Dandy Corporation has an income statement that indicates that Earnings Before Taxes is $2,375,486 and it pays taxes at 35% of earnings. It currently has 1 million shares of common stock outstanding and does not issue preferred stock. What is this corporation's approximate Earnings per Share?
A) $1.54
B) $0.42
C) $0.65
D) $2.38
A) $1.54
B) $0.42
C) $0.65
D) $2.38
Unlock Deck
Unlock for access to all 79 flashcards in this deck.
Unlock Deck
k this deck
64
Operating Cash Flow per share
A) uses information from the income statement and the balance sheet.
B) uses information from the statement of cash flows and the income statement.
C) uses information from the balance sheet and the statement of cash flows.
D) all of the above.
A) uses information from the income statement and the balance sheet.
B) uses information from the statement of cash flows and the income statement.
C) uses information from the balance sheet and the statement of cash flows.
D) all of the above.
Unlock Deck
Unlock for access to all 79 flashcards in this deck.
Unlock Deck
k this deck
65
Carl's Toy Factory had the following items listed on its balance sheet. Cash, 1,590; Accounts Receivable, 5,746; Accounts Payable, 9,563; Inventory, 7,879; Equipment, 35,743; Land, 50,000; Buildings, 135,487; Mortgage, 125,276. Based on this information what was Carl's current ratio?
A) 2.14
B) 1.37
C) 1.59
D) 0.77
Unlock Deck
Unlock for access to all 79 flashcards in this deck.
Unlock Deck
k this deck
66
A company has the following information on their income statement and balance sheet: Total Sales $345,678; Returns and Allowances $15,500; Cost of Goods Sold $175,000; Total Assets $500,000; Current Assets $25,000. What is their Fixed Asset Turnover ratio?
A) 0.691
B) 0.695
C) 0.728
D) 0.660
E) 0.368
A) 0.691
B) 0.695
C) 0.728
D) 0.660
E) 0.368
Unlock Deck
Unlock for access to all 79 flashcards in this deck.
Unlock Deck
k this deck
67
In 2004, James had Cost of Goods of 358,358; in 2005, they were 365,069. On the last day 2004 his Inventory was 45,675, and on the last day of 2005 it was 51,559. What is the Inventory Turnover for James' Television Sales Shop for 2005?
A) 7.51
B) 7.44
C) 7.34
D) 7.37
Unlock Deck
Unlock for access to all 79 flashcards in this deck.
Unlock Deck
k this deck
68
Liquidity ratios can be obtained from information on the balance sheet, while Activity Ratios require information obtained from the
A) income statement, balance sheet, and statement of cash flows.
B) balance sheet only.
C) income statement only.
D) income statement and balance sheet.
E) none of the above
A) income statement, balance sheet, and statement of cash flows.
B) balance sheet only.
C) income statement only.
D) income statement and balance sheet.
E) none of the above
Unlock Deck
Unlock for access to all 79 flashcards in this deck.
Unlock Deck
k this deck
69
Carl's Toy Factory had the following items listed on its balance sheet. Cash, 1,590; Accounts Receivable, 5,746; Accounts Payable, 9,563; Inventory, 7,879; Equipment, 35,743; Land, 50,000; Buildings, 135,487; Mortgage, 125,276. Based on this information what was Carl's quick ratio?
A) 1.59
B) 2.14
C) 0.77
D) 1.37
Unlock Deck
Unlock for access to all 79 flashcards in this deck.
Unlock Deck
k this deck
70
In 2005, The Handy Catering Service had cash sales of 254,134, credit sales of 125,371, and total sales of 379,505. Accounts Receivable were 9,765. What was Accounts Receivable Turnover?
A) 19.43
B) 33.36
C) 12.84
D) 26.02
E) There is not enough information provided to answer this question.
A) 19.43
B) 33.36
C) 12.84
D) 26.02
E) There is not enough information provided to answer this question.
Unlock Deck
Unlock for access to all 79 flashcards in this deck.
Unlock Deck
k this deck
71
Earnings per share
A) is easy to manipulate.
B) may overstate the profitability of the company.
C) does not separate cash sales from credit sales on the income statement.
D) all of the above.
A) is easy to manipulate.
B) may overstate the profitability of the company.
C) does not separate cash sales from credit sales on the income statement.
D) all of the above.
Unlock Deck
Unlock for access to all 79 flashcards in this deck.
Unlock Deck
k this deck
72
In 2005, Joan had Cost of Goods of 58,358; in 2006, they were 65,069. On the last day 2005 her Inventory was 675, and on the last day of 2006 it was 1,559. What is the Inventory Turnover for Joan's Coffee Shop for 2006?
A) 58.25
B) 55.25
C) 41.74
D) 52.25
Unlock Deck
Unlock for access to all 79 flashcards in this deck.
Unlock Deck
k this deck
73
The Handy Dandy Corporation has an income statement that indicates that Operating Income is $2,375,486 and Net Profit is $1,375,486. It currently has 2 million shares of common stock outstanding and does not issue preferred stock. What is this corporation's approximate Earnings per Share?
A) $0.69
B) $1.18
C) $0.46
D) $0.79
E) $0.19
A) $0.69
B) $1.18
C) $0.46
D) $0.79
E) $0.19
Unlock Deck
Unlock for access to all 79 flashcards in this deck.
Unlock Deck
k this deck
74
Earnings per share differs from operating cash flow per share in that
A) EPS uses less shares in its calculation than cash flow per share does.
B) EPS uses net income and operating cash flow uses actual cash flow per share.
C) EPS is a market ratio.
D) EPS uses the balance sheet and the income statement.
A) EPS uses less shares in its calculation than cash flow per share does.
B) EPS uses net income and operating cash flow uses actual cash flow per share.
C) EPS is a market ratio.
D) EPS uses the balance sheet and the income statement.
Unlock Deck
Unlock for access to all 79 flashcards in this deck.
Unlock Deck
k this deck
75
If a company's stock currently sells in the marketplace for $55 per share, and the book value of this stock is $25 per share, what is the Price Earnings ratio if the Earnings per Share is $3.00?
A) 0.12
B) 0.05
C) 8.33
D) 18.33
A) 0.12
B) 0.05
C) 8.33
D) 18.33
Unlock Deck
Unlock for access to all 79 flashcards in this deck.
Unlock Deck
k this deck
76
The Handy Dandy Corporation has an income statement that indicates that Operating Income is $2,375,486 and Net Profit is $1,375,486. It currently has 2 million shares of common stock outstanding and 1 million shares of preferred stock that pays a dividend of $1.00 per share. What is this corporation's approximate Earnings per Share?
A) $0.69
B) $0.19
C) $0.79
D) $1.18
E) $0.46
A) $0.69
B) $0.19
C) $0.79
D) $1.18
E) $0.46
Unlock Deck
Unlock for access to all 79 flashcards in this deck.
Unlock Deck
k this deck
77
In 2005, The Best Donut Shop had cash sales of 83,684 and total sales of 176,413. Accounts Receivable were 3,275. What was Accounts Receivable Turnover?
A) 28.31
B) 25.55
C) 53.37
D) 39.71
Unlock Deck
Unlock for access to all 79 flashcards in this deck.
Unlock Deck
k this deck
78
In 2005, The Handy Catering Service had cash sales of 254,134, credit sales of 125,371, and total sales of 379,505. Accounts Receivable were 9,765. If there are 365 days in 2005, what was the Average Collection Period?
A) 18.78 days
B) 9.39 days
C) 28.43 days
D) 14.03 days
E) There is not enough information provided to answer this question.
A) 18.78 days
B) 9.39 days
C) 28.43 days
D) 14.03 days
E) There is not enough information provided to answer this question.
Unlock Deck
Unlock for access to all 79 flashcards in this deck.
Unlock Deck
k this deck
79
The balance sheet for Jim's Hardware has the following items listed. Current Liabilities, $25,345; Long -Term Debt, $100,000; Total Liabilities, $125,345; Total Assets, $325,490. What is the Debt to Equity Ratio for this company?
A) 0.385
B) 0.499
C) 0.307
D) 0.626
E) 0.198
A) 0.385
B) 0.499
C) 0.307
D) 0.626
E) 0.198
Unlock Deck
Unlock for access to all 79 flashcards in this deck.
Unlock Deck
k this deck
Unlock Deck
Unlock for access to all 79 flashcards in this deck.


